menu
close

Author(s):

Kai Arvai | Banque de France
Katja Mann | Copenhagen Business School

Keywords:

Digitalization , Inequality , Consumption , Income

JEL Codes:

E21 , E22 , J31 , O33 , O41
This paper studies the welfare effects of digitalization by measuring how digitalization affects consumption of high- and low-income households. We assemble a novel dataset of digital technology used in the production process, link it to US consumption data and establish a new stylized fact: High-income households consume a higher share of digitally produced products than low-income households. Furthermore, inflation has been lower for more digitalized goods. This suggests that digitalization has not only increased income inequality – as previous literature has shown – but has also altered the relative purchasing power of households, disproportionally benefiting the rich. We quantify this effect in a model. 
Digitalization is  fundamentally impacting our economy as it changes the way we produce and consume. A large body of academic literature in economics has studied how digitalization affects labor markets. There is substantial evidence for increased labor market polarization and higher income inequality following waves of digitalization, see for example Autor and Dorn (2013) or Autor and Acemoglu (2018). Less attention has been devoted to the question how relative consumer prices have changed following this technological trend, and which households in particular benefit from it.
Our paper (Arvai and Mann, 2022) therefore studies how digitalization affects consumption inequality, putting a special focus on differential consumption patterns of households along the income distribution. We find that the poorest 30 % households have a substantially lower share of digital technology in their consumption basket. At the same time, inflation has been lower for goods and services with more digital content. This implies that the relative purchasing power of poor households has been eroded by digitalization over the last decades. We estimate that this loss in purchasing power for the poor has eaten up most of their income increases. The middle part of the income distribution has lost in terms of income and benefited via cheaper consumption basket while the top 20 % could benefit both via income and via cheaper prices.
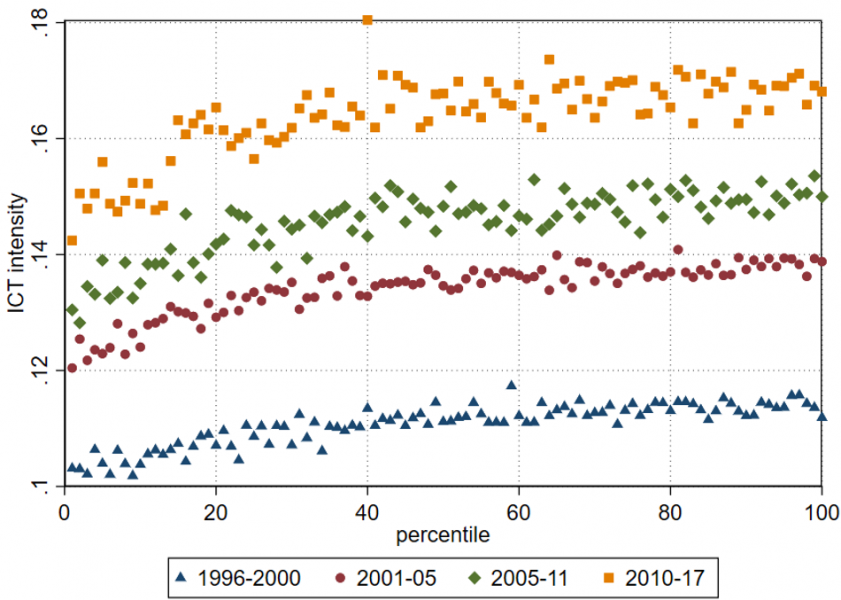
A priori, it is not clear which households – whether rich or poor—consume more digital products. A crucial step in our analysis is therefore to develop a measure of digitalization in the consumption baskets of households along the income distribution. Our digitalization measure captures how much digital technology has been used to produce and provide certain products and services. First, we study the capital stock at the industry level, classifying assets as digital vs. non-digital. Based on this classification, we establish our main measure, “ICT intensity”, the share of digital capital in the total capital stock of an industry. Next, To account for intermediate products and services with their corresponding digital intensity, we consider the overall production network of the US economy. By tracing the input-output structure, we obtain a digital intensity measure for more than 300 different final commodities. These final commodities are then matched to consumption categories in the consumption expenditure survey, the most extensive US survey of household expenditure. This enables us to compute the digital intensity of the consumption basket for each household. As the survey also reports household income, we can study how the digital content of the basket differs along the income distribution (Figure 1).
Figure 1: ICT intensity of the consumption basket along the income distribution
 width=

Notes: The graph shows the ICT share of the consumption basket by percentile for 1996-2017 period. Source: BEA, CEX and own calculations.
At any point in time, digital intensity increases in household income. In particular, there are substantial differences between the bottom 30% and the top 70% of the income distribution. In the most recent period (2010-2017) the poorest 30% have a digital intensity of around 15%, while for the richer households, this share was at around 17%.
What accounts for these differences across households? The data suggest that a broad range of products and services drive the results. For low-income households, products such as for example food and textile are relatively more important as they spend a large fraction of their income on these necessities. The ICT intensity of these products is, however, generally low. For rich households, some ICT-intensive services absorb a large part of their expenditure. Finance and insurance, as well as expenditures on education are more important for more affluent households and use a large share of digital capital in their production process.
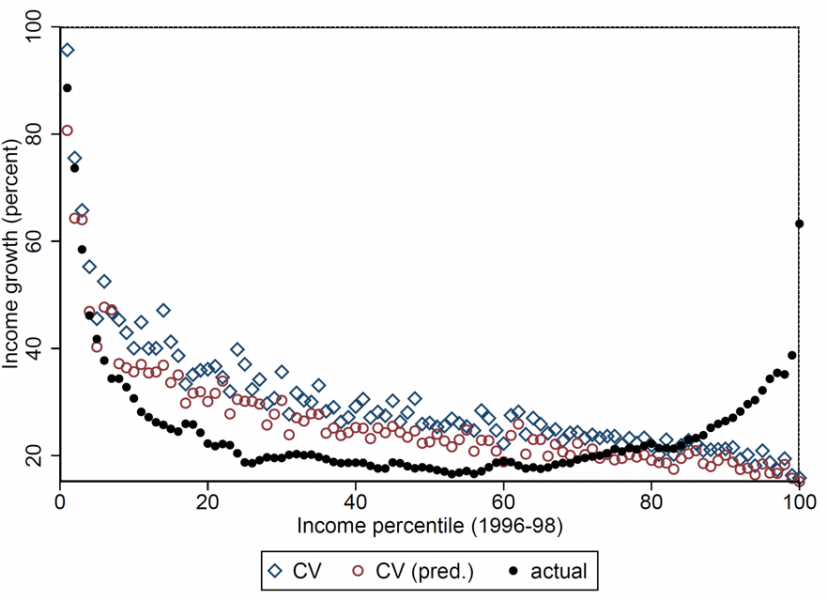
After having established how the exposure of digital technology in the consumption basket differs  along the income distribution, we assess how relevant these differences are in terms of purchasing power. To this end, we combine the commodity-level ICT intensity measure with data on price changes from the BLS between 1995 and 2017. We find that goods and services with higher ICT intensity tend to experience lower price inflation. To pin down the financial costs (or benefits) of digitalization across households, we conduct a compensatory variation. This is a thought experiment departing from the actual expenditure of households in 1997. We then calculate how much additional income we need to give to these households such that they are able to afford the same consumption bundle when facing the (higher) 2017 prices. Figure 2 shows the required income for households along the income distribution.
Figure 2: Required Compensatory variation for price changes along the income distribution
 width=

Notes: This graph plots the compensatory variation (blue squares), the actual nominal increase in income (black circles) and the compensatory variation for ICT induced price changes (red circles) for each income percentile between 1997 and 2017. Source: BEA, CEX, BLS and own calculations.
Both measures of compensatory variation (CV) are strictly declining across income deciles, implying that poor households need the largest income boost to afford the same consumption basket given the price inflation observed in the data. In other words, inflation has been the most harmful for the poorest households. Strikingly, if you use the price inflation of products that is predicted by looking at their ICT content, the required compensatory variation lies only slightly below the value computed with the actual data. This suggests that ICT intensity plays an important role for the required compensation. Digitalization benefits the rich. Last, compare the compensatory variation with the actual nominal income increase households experienced. The well-established u-shaped pattern (Autor and Dorn, 2013) of income polarization is evident in our data as well. For most households, the experienced income increase is not enough to compensate them for the price increases that they experienced, except for the top 20%.
The conventional wisdom of a u-shaped polarization is therefore overruled when considering price changes as well. While the poorest households benefit in form of relatively higher income, their consumption bundle becomes more expensive. For the middle of the income distribution, their relative income declines while their consumption basket becomes cheaper. The rich households have the best of both worlds: Their income increases and at the same time their consumption basket gets cheaper.

The data analysis is simplified in many ways, for example we cannot establish what share of income polarization is actually due to digitalization. Therefore, in the paper we go one step further: we build a model in which digitalization affects both the prices of consumer goods and the income that households receive. Calibrating the model to match key features of the US economy, we are able to quantify the welfare effects of digitalization. We find that rich households benefit substantially from digitalization, as their consumption has increased by almost 30% over the last 60 years, whereas poor households are hardly any better off. Changes in consumer prices accounts for about one fourth of the effect. It is therefore important to take price changes into account when thinking about welfare effects of digitalization.

About the authors

Kai Arvai

Kai Arvai joined the Banque de France as a research economist in September 2021. His research focuses on macroeconomic topics such as monetary or international economics and also on innovation and the macroeconomy. He holds a PhD from the University of Bonn.

Katja Mann

Katja Mann is an assistant professor at Copenhagen Business School. She works on long-run topics in macroeconomics, such as the effects of technological change and demographic aging. She obtained her PhD from Bonn University in 2018.

More on these topics

Tags: