menu
close

Author(s):

Nina Biljanovska | International Monetary Fund (IMF)
Chenxu Fu | University of Tokyo
Deniz Igan | Bank for International Settlements (BIS)

Keywords:

housing affordability , real estate markets , mortgages

JEL Codes:

R3 , G51 , I31

The views expressed in the paper do not represent those of the International Monetary Fund (IMF) or the Bank for International Settlements (BIS).

Housing affordability is a crucial yet elusive concept, especially when it comes to cross-country assessments. In a recent paper, we introduce a new dataset that summarizes a mortgage-based indicator of housing affordability for a sample of 40 countries spanning in some cases as early as the 1970s. According to this indicator, compared to the 1990s, affordability has improved. This is largely explained by lower mortgage rates and favorable economic conditions. In the cross-section of countries, housing is more affordable in advanced economies than in emerging market economies. An important dimension to consider here is the development of mortgage markets and the mode with which households become owner-occupiers, namely with or without a mortgage. It remains uncertain what the future holds. In a “soft landing”—a scenario where interest rates decline while incomes do not experience significant decreases—housing affordability may improve. That said, supply-side constraints may put upward pressure on house prices and offset the impact of lower rates and higher incomes.

Housing affordability: how to measure?

Recent developments in housing markets around the world put a limelight on housing affordability. During the short but deep COVID-19 recession, contrary to expectations and in contrast to experience in earlier recessions, house prices rose at record levels in many countries. This rise often reflected a combination of demand and supply factors. On the demand side, policy support measures sustained income and allowed financing conditions to remain favorable at a time when many households started looking for more space. On the supply side, constraints on new construction and on mobility kept a tight rein on the number of available properties in the market. While many observers during the pandemic noted that financial risks remained limited thanks to policies put in place in the aftermath of the Global Financial Crisis (GFC) (see, for instance, Igan, Kohlscheen, and Rungcharoenkitkul, 2022), concerns have been raised about housing affordability. Even before the pandemic magnified the challenge, affordability was already a policy concern for many countries around the world, as prices quickly resumed their upward march following the correction or pause around the GFC (e.g. Ahir and Loungani, 2019; Ahir et al., 2021; Deb et al., 2022; Beraldi and Zhao, 2023). And, in the wake of the most aggressive monetary policy tightening in recent memory, house prices in several countries appear to have quickly bottomed out and started rising once again.

One of the challenges in assessing how big a concern housing affordability is stems from the lack of cross-country indicators beyond simple metrics. The price-to-income ratio (PIR) has been used often as a proxy for affordability and is available from international organizations such as the BIS and the OECD, as an index that primarily compares the developments in house prices to developments in income per capita. Its main downside is that it does not take into consideration any mortgage market or housing characteristics. For instance, an increase in mortgage interest rates would worsen affordability by increasing the monthly payments required, even if house prices and household income were held constant. Also, an increase in mortgage rates could decrease house prices, which would reduce the simple price-to-income and complicate the assessment of housing affordability. Another proxy of housing affordability is the OECD’s housing cost overburden rate, which captures the percentage of households spending over 40% of their income on housing, including costs like rent, mortgage payments, utilities, and maintenance. While this measure is an indicator of the financial burden housing costs place on households for shelter, particularly for those with lower incomes, it takes housing tenure choices as given and does not consider whether a typical family that would prefer to own rather than rent can qualify for a mortgage loan to purchase a typical home, based on prevailing prices and interest rates. Yet another proxy that could be considered is the BIS’ debt service ratio. This measure, however, does not necessarily capture housing affordability, but rather the burden of debt (including but not limited to housing-related debt) on a household’s income.

In order to capture the important role of housing finance for affordability, we define housing affordability as the ability of a household to make the regular mortgage payments needed to purchase a home while continuing to be able to meet other essential needs and still have an income buffer. This is then a function of household income and house prices, but also mortgage rates, the loan-to-value ratio, and the term-to-maturity of the mortgage loan as the latter factors determine how much a household needs to pay on a monthly basis.

Using this information, the housing affordability index (HAI) can be obtained as the ratio between household income and a qualifying income that a household would need to earn to qualify for a typical mortgage to purchase a typical house. A higher ratio corresponds to more affordable housing: more specifically, an HAI value of 100 indicates that a median-income household has exactly enough income to qualify for a mortgage loan on an average-priced home; an index level of above (below) 100 indicates that a household has more (less) than the qualifying income to apply for a mortgage for a house with an average price. Here our focus is on owner-occupiers. Of course, households may also choose to be renters. Then the affordability concept would relate to the ratio of household income to rents. Our analysis still would provide some insight into rental affordability as well, given the close relationship between house prices and rents.

A handful of countries, including Australia, Canada, New Zealand, the United Kingdom, and the United States, have readily-available indicators of housing affordability that take into consideration mortgage market or housing characteristics. But the methodology used in computing these indices varies across countries, which could present a challenge by introducing a measurement error when conducting cross-country analysis. Our main contribution in Biljanovska, Fu, and Igan (2023) is to construct such an index consistently across 40 countries (33 advanced economies and 7 emerging markets), spanning the time period between 1970 and 2021 at quarterly frequency.

Affordability over time

Figure 1 shows the mean, median, and the 25th and 75th cross-country percentiles of the affordability index over time for the countries in our sample.

Figure 1: Housing affordability index for 40 countries over 50 years
 width=
Sources: Authors’ calculations; see the working paper annex for detailed information.
Notes: Housing affordability index (HAI) is the ratio between household income and a qualifying income that a household would need to earn to qualify for a typical mortgage to purchase a typical house. A value of 100 indicates that a median-income household has exactly enough income to qualify for a mortgage loan on an average-priced home; an index level of above (below) 100 indicates that a household has more (less) than the qualifying income to apply for a mortgage for a house with an average price. The average is computed using GDP as country weights.

In the period between the 1970s and mid-1990s, the median value of the index was below 100, which indicates that the median-income household had a hard time obtaining a mortgage for an average-priced house. Even the 75th cross-country percentile of the index was below 100. During the 2000s, affordability improved as the cross-country median of the index exceeded the 100-mark. Affordability collapsed during the GFC but recovered quickly. Since 2010, affordability has continued to improve, and the median remained comfortably above 100 while the 25th cross-country percentile hovered just below.

To better understand the drivers of affordability over time, consider the evolution of each of the time-varying components of HAI, namely, nominal mortgage rates, nominal median household income, and nominal house prices. Nominal mortgage rates declined over the sample period, in line with the widely-documented secular decline in the natural rate of interest globally as well as financial liberalization patterns, leading to higher competition among lenders and financial deepening. All else equal, this decline in interest rates would contribute to higher levels of HAI and more affordable housing due to lower borrowing costs. At the same time, nominal household income and nominal house prices increased consistently, with the latter experiencing a notable correction during the GFC and a subsequent recovery. These trends, overall, are not too surprising as household income and house prices exhibit an upward time trend.

For a more structured analysis, we look at how changes in each of the time-varying factors in the formula (nominal household income, nominal house prices and nominal mortgage rates) relate to changes in the HAI globally. Figure 2 plots the sum of the average growth rates across countries of each of these factors, weighted by GDP, over the sample period. This is not a decomposition exercise but rather an examination of the changes in the time-varying components of HAI. By construction and holding all other variables constant, an increase in household income should improve affordability while an increase in house prices or interest rates should worsen affordability.

Figure 2: Changes in the housing affordability index and its time-varying components
 width=
Sources: Authors’ calculations; see the working paper annex for detailed information.
Notes: Housing affordability index (HAI) is the ratio between household income and a qualifying income that a household would need to earn to qualify for a typical mortgage to purchase a typical house. A value of 100 indicates that a median-income household has exactly enough income to qualify for a mortgage loan on an average-priced home; an index level of above (below) 100 indicates that a household has more (less) than the qualifying income to apply for a mortgage for a house with an average price. The average is computed using GDP as country weights.

This simple exercise gives the first clues on the factors driving the dynamics of HAI over time. The decline in the HAI during the mid-1970s and early 1980s coincided with an increase in house prices and borrowing rates, which was not offset by the increase in household income. On the flipside, the improvement in affordability following the GFC was concomitant with lower borrowing rates and falling house prices while household income moved little. Finally, during the pandemic, the growth in house prices stands out in relation to the decline in affordability while the other time-varying components actually go in the direction of improved affordability.

It is important to note that the HAI primarily captures the immediate impact of the factors we consider, particularly when it comes to interest rates. A significant drop in mortgage rates would elevate HAI, but that increase does not account for future interest rate adjustments or potential refinancing required to sustain the higher HAI level. In other words, the constructed HAI measure indicates if an average “new buyer” would qualify for a typical loan at a certain point in time. This limitation is more prevalent in countries where adjustable-rate mortgages are predominant.

It is also noteworthy that this broad-based depiction brushes over differences across countries in the evolution of affordability over time. Particularly, improvements in the HAI are primarily influenced by reduced borrowing costs in countries where house prices are not inflated. Another way of putting this is that lower borrowing costs can go only some way to offset an increase in house prices. Indeed, in several countries with very strong house price growth and signs of stretched valuations, low interest rates have not been enough to counterbalance the affordability strain caused by high property prices. For illustrative purposes, consider these three countries: Belgium, Canada, and the United Kingdom. Focusing on the period of low-for-long interest rates that prevailed in the 2010s, there are notable differences. In Belgium, affordability improved as the decline in interest rates offset the moderate increase in house prices. In Canada, affordability worsened as the decline in interest rates was not enough to offset the strong growth in house prices. The United Kingdom exhibited a combination of these forces: affordability worsened from the beginning to the middle of the decade under focus (2010s), and then levelled off. This matches the robust recovery in house prices that followed the post-GFC correction and the much slower pace of house price appreciation following the Brexit vote.

Affordability across countries

Across countries, the average HAI varies considerably, reflecting a myriad of country characteristics. Housing in advanced economies has been generally more affordable than in emerging markets. The mean value of the affordability index in advanced economies is 118 compared to 85 in emerging markets for the period from 2001q1 to 2021q4. In terms of the variance, advanced economies exhibit somewhat smaller variance compared to emerging markets, with the standard deviation equal to 48 and 53 over the same time horizon for the two country groups, respectively.

When we rank countries by the level of average HAI as shown in Figure 3, Eastern European countries (e.g., the Baltics, the Czech Republic, Poland) top the list with index values touching or exceeding 150.

This could reflect traditionally high homeownership rates and a relatively old housing stock, which tends to be of lower quality and cheaper. On the other end of the spectrum, the set of economies is a mixed bunch: Australia, Hong Kong SAR, Russia, and Turkey all have average index values below 50. The reasons for very low affordability levels in these countries are likely different. For instance, in Australia, house prices increased at a fast clip for several decades “driven by demand shifts and amplified by legacy imbalances and a slow supply response” (IMF Staff Report released in February 2018). In Turkey, a lower level of mortgage market development could be the reason. Put more specifically, a typical Turkish household may not be able to afford the mortgage loan but still manages to purchase a home through alternative means such as accumulated savings and/or informal borrowing from family and friends.

Figure 3: Average housing affordability index over the sample period by country
 width=
Sources: Authors’ calculations; see the working paper annex for detailed information.
Notes: Housing affordability index (HAI) is the ratio between household income and a qualifying income that a household would need to earn to qualify for a typical mortgage to purchase a typical house. A value of 100 indicates that a median-income household has exactly enough income to qualify for a mortgage loan on an average-priced home; an index level of above (below) 100 indicates that a household has more (less) than the qualifying income to apply for a mortgage for a house with an average price.

The narrow focus on mortgage repayment affordability is an important caveat of the methodology we use. Consider one dimension, namely, outright home ownership versus ownership with a mortgage is one illustration of this. In countries with higher GDP per capita – which also tend to have more developed mortgage markets – outright home ownership is low but ownership with a mortgage is high. It is in these countries that the HAI constructed here could be more informative.

Other caveats also apply. The index generally can do a decent job in capturing the constraints a typical household faces at a given point in time in order to fulfil an objective of credit-financed home ownership. It cannot, however, broader question of whether homeownership achieved in this manner is sustainable, e.g., if mortgage payments remain affordable over the course of the loan given shocks to interest rates and to household income, or if stretching the household budget in order to afford the mortgage loan squeezes affordability of other essential goods and services. These points are particularly pertinent in the current juncture: the median HAI across countries improved over the last few decades, largely on account of low interest rates. This is because the index is based on the mortgage affordability concept; in other words, it measures how costly owning a home is conditional on being able to access a mortgage at the prevalent market rate. But this trend has started reversing already with the rise in interest rates and will likely get worse as rate resets kick in. Hence, the improvement of the HAI especially in the past decade or so can be ephemeral.

Directions for future research

Biljanovska, Fu, and Igan (2023) aims to introduce, to a broad set of researchers and policymakers, a novel dataset on housing affordability for a sample of 40 countries spanning in some cases as early as the 1970s until 2021Q4. To construct the index, we compile information on mortgage rates, typical maturity and LTV ratios, average size of a house, and average number of household members for each country. Unlike other measures, ours considers important characteristics of the mortgage markets.

There are several areas where future research can build on, using this new index of housing affordability. For instance, more systematic analysis of the cross-country differences in the HAI could shed light on the structural determinants of housing tenure choices. The impact on affordability of different government policies at a granular level and over different horizons could help policymakers assess the relative costs and benefits, including intertemporal trade-offs in achieving affordability goals. How housing affordability can help understand private consumption and housing investment is another direction that could be explored.

References

Ahir, Hites and Prakash Loungani. 2019. IMF Assessments of Housing Markets Around the World. Background slides for the Annual Meeting of the International Housing Association, February.

Ahir, Hites, Nina Biljanovska, Chenxu Fu, Deniz Igan, and Prakash Loungani. 2022. Housing Prices Continue to Soar in Many Countries Around the World. IMF Blog Chart of the Week, October 18.

Beraldi, Francesco and Yunhui Zhao. 2023. The Pricing-Out Phenomenon in the U.S. Housing Market. IMF Working Paper No. 2023/01.

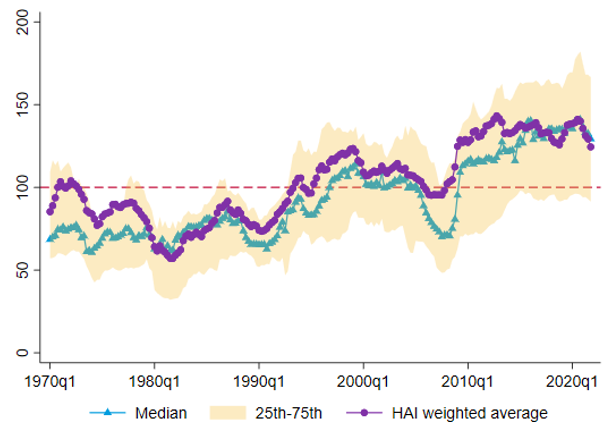
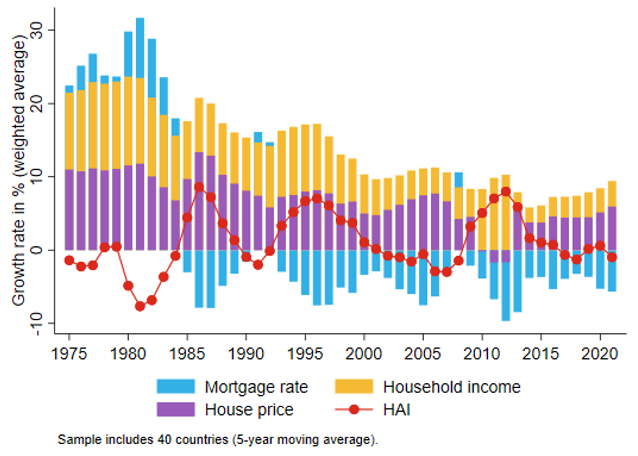
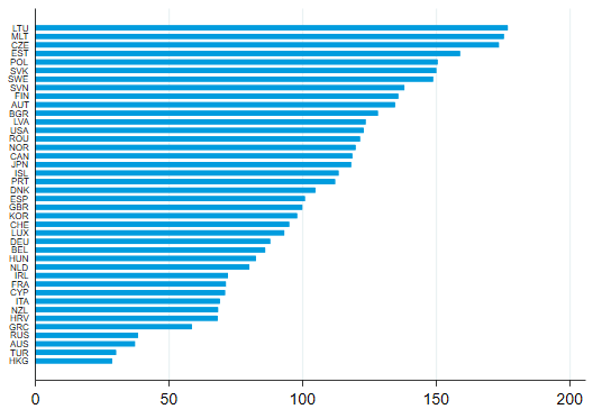
Biljanovska, Nina, Chenxu Fu, and Deniz Igan. 2023. Housing affordability: a new dataset. BIS Working Paper No. 1149.

Deb, Pragyan, Harald Finger, Kenichiro Kashiwase, Yosuke Kido, Siddharth Kothari, Evan Papageorgiou, Henry Hoyle, and Anne Oeking. 2022. Housing Market Stability and Affordability in Asia-Pacific. IMF Departmental Paper No. 2022/020.

Igan, Deniz, Emanuel Kohlscheen, and Phurichai Rungcharoenkitkul. 2022. Housing market risks in the wake of the pandemic. BIS Bulletin No. 50.

About the authors

Nina Biljanovska

Nina Biljanovska is an economist at the Macro-Financial Division in the Research Department of the International Monetary Fund (IMF). Previously she worked in the IMF’s Institute for Capacity Development and on the Brazil and Ecuador teams in the Western Hemisphere Department. Her research interests include macro-policy, financial regulation, real estate markets, and behavioral finance. She holds a PhD in Economics from Goethe University Frankfurt.

Chenxu Fu

Chenxu Fu is currently a PhD candidate in international finance at the University of Tokyo. He has held research associate positions at the Asian Development Bank and the International Monetary Fund. His research interests include macro-financial issues, financial policies, and green finance. He earned an MSc in economics and finance from Centro de Estudios Monetarios y Financieros and a BSc in economics from the London School of Economics and Political Science.

Deniz Igan, BIS - photo
Deniz Igan

Deniz Igan is the Head of Macroeconomic Analysis at the Bank for International Settlements (BIS). Prior to joining the BIS, she held several positions at the International Monetary Fund, most recently as the Chief of the Systemic Issues Division in the Research Department, co-editor of IMF Research Perspectives and an adviser to the editor of the Finance & Development magazine. Her research interests include financial crises, corporate finance, real estate markets and political economy. Her work has been published in various outlets, including policy-oriented academic journals such as NBER Macroeconomics Annual and Economic Policy. She is a CEPR research fellow, a fellow in the EUI-School of Transnational Governance Policy Leaders Program and a panelist in the Zillow House Price Expectations Survey. Deniz holds a PhD from Princeton University.

More on these topics

Tags: