The COVID-19 pandemic and the measures required to contain it have dealt a major blow to private consumption. At the same time, income losses have been cushioned considerably by government support schemes, leading to an unprecedented accumulation of savings. This article explores the extent to which excess savings can be expected to be spent and how forcefully private consumption may recover, once the containment measures are lifted and uncertainty decreases. The detailed survey results broken down by respondents’ income and age groups provide insights into the distributional impact of the crisis and, following the rebound of consumer spending on durables in 2020-Q3, the scope for further pent-up demand to materialise. The analysis shows that young and low-income earners have suffered most, while the eldest (65+) and high-income earners have been able to set aside considerable savings, suggesting that their income has been largely sheltered while consumption has fallen. All in all, the analysis does not point to a significant additional impulse from consumer spending going forward. The analysis of country-specific developments largely corroborates the findings for the EU as a whole.
The COVID-19 pandemic and the associated virus containment measures, including self-imposed restrictions to mobility for fear of infection, have severely constrained private consumption. At the same time, income losses have been considerably cushioned through government support schemes and the shift to remote working for a large proportion of workers. This, in combination with heightened uncertainty, has led to an unprecedented accumulation of both ‘forced’ and precautionary savings.
Graph 2.1: Household savings, gross disposable income and private consumption
EU, billion euro
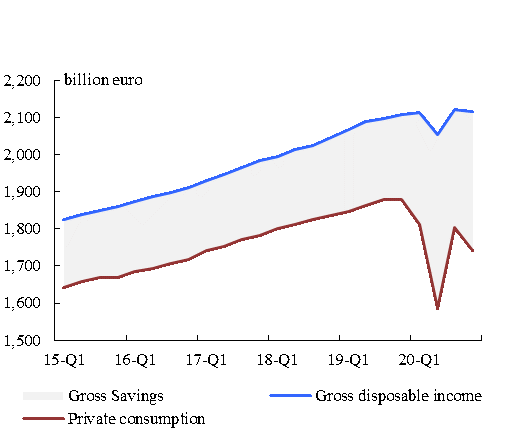
Source: National Accounts, Eurostat.
In 2020, private consumption in the EU decreased by 7.0% compared to 2019, contributing significantly to the fall in GDP over the same period. By contrast, over the first three quarters of the year, household gross disposable income increased (+0.6% year-on-year) and the household saving rate rose by as much as 6.5 percentage points, to 18.4% of gross disposable income.
Looking ahead, the strength of the recovery in consumption and output will crucially depend on the speed at which accumulated savings are unwound. This in turn will depend on how consumers perceive their current and expected financial situation, the distribution of the savings across socio-economic groups of the population, such as income and age, and the level of prevailing uncertainty regarding the economic outlook.
This special topic explores these questions by taking a close look at the detailed results from the Commission’s monthly consumer surveys. The presence in the surveys of both retrospective questions, inquiring about developments over the past 12 months, and forward-looking questions about the 12 months ahead, provides a picture of how consumers assess their financial situation and their consumption/saving intentions during the entire COVID-crisis period, including the period when the recovery is expected to take hold. Information on the socio-economic characteristics of the respondents in the survey allows for insights into the distributional impact of the crisis and the scope for pent-up demand to materialise.
Graph 2.2 provides an overview of the evolution of survey results directly related to respondents’ personal financial situation.
Graph 2.2: Selected consumer survey results
EU, percentage balances3
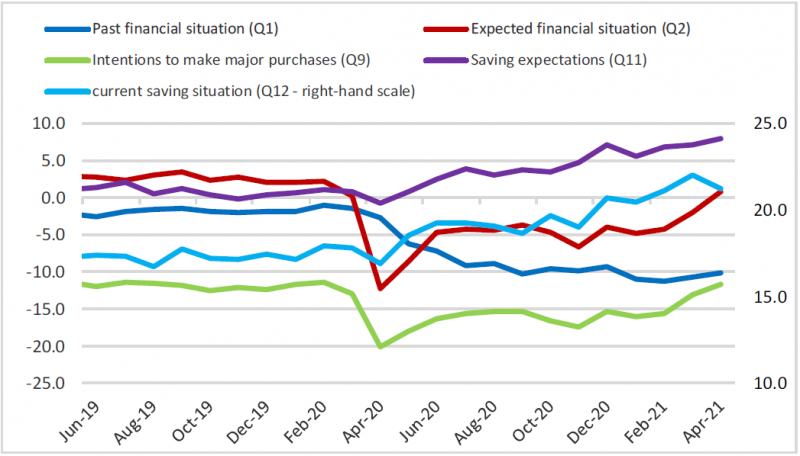
Consumers’ assessment of their households’ financial situation over the past 12 months (Question 1 of the survey, Q1 henceforth) declined steadily between the beginning of the COVID crisis and February this year, and has remained broadly stable but well below its pre-crisis level in March and April 2021. Expectations regarding their financial situation (question Q2) and spending intentions (for ‘major purchases’) for the next 12 months (Q9) fell sharply during the first lockdown, before partially recovering when containment measures were eased at the beginning of the summer in 2020 (see Graph 2.2). The balances for these questions then remained broadly stable up to February 2021 and have recovered in March and April 2021, almost back to their February 2020 level. Finally, consumers’ savings expectations for the next 12 months (Q11) and assessments of their households’ current saving or dissaving situation (Q12) decreased slightly at the beginning of the crisis, but have been trending upwards since April 2020. Both assessments relating to savings are currently at record high levels.
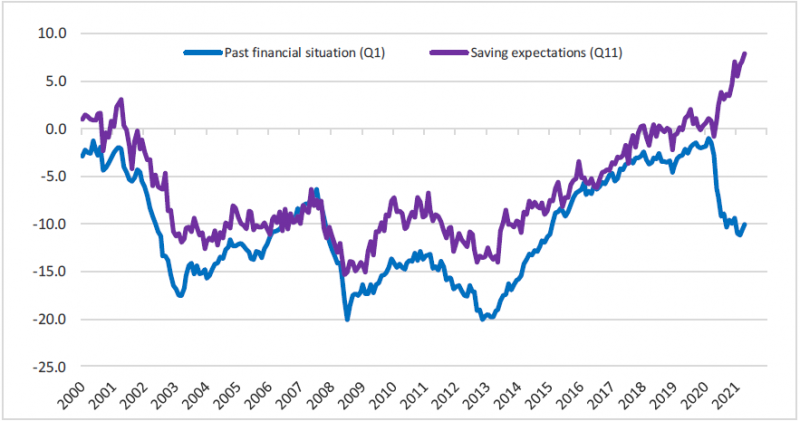
From a longer-term perspective, the COVID crisis marks a break in the historically close relationship between how consumers assess their household’s past financial situation and their saving intentions, as shown in Graph 2.3. In the past, the co-movement of the two series confirmed that the assessment of the financial situation was a key driver for saving, i.e. the better the financial situation was perceived, the more households would want to set aside, and vice versa. Consequently, before the COVID-19 crisis, the saving rate had been broadly stable over time, varying between 11% and 14% in the EU. However, since the beginning of the crisis, the two series have been trending in opposite directions, pointing to an increasing disconnect between consumers’ propensity to save and their perceived financial situation. This could be due to either precaution taking over as the dominant saving motive, or to the sheer impossibility to consume as much as desired leading to forced savings, or a mixture of the two.
Graph 2.3: Assessment of the household’s past financial situation and saving expectations
EU, percentage balances
Graph 2.4 confirms the break in the historically strong positive correlation between consumers’ assessment of their household’s past and expected financial situation (Q1 and Q2) and developments in private consumption.
Graph 2.4: Private consumption and consumers’ assessment of their household’s past and expected financial situation
EU, quarterly data, year-on-year changes and percentage balances
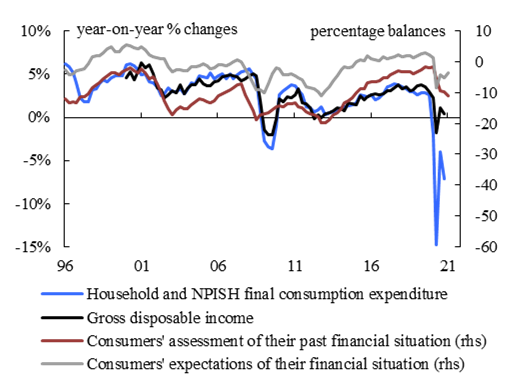
Sources: National Accounts, Eurostat and DG ECFIN harmonised consumer survey.
The dramatic fall in private consumption registered in the first (-2.1% year‑on‑year) and second quarter (-14.9%) of 2020 is far greater than the mild and drawn-out decline in the balance for question Q1 and cannot be fully explained by the drop in gross disposable income either. Similarly, the strong, though incomplete rebound in private consumption in 2020-Q3, was at odds with the steady worsening of consumers’ perceived financial situation. The sharp fall and partial recovery of consumers’ expectations about their future financial situation (Q2) more correctly tracked the dynamics in consumers’ actual spending in the first three quarters of 2020, but again the magnitude of the swings was out of proportion.
Overall, the large gap between the dramatic drop in consumption and increased propensity to save, on the one hand, and the mild decline in consumers’ perceived financial situation, on the other hand, suggests that the former is likely due to the lack of spending opportunities triggered by the restrictions to daily life. Further evidence that households cut their consumption primarily because they had fewer opportunities to spend and for fear of infection is provided by the special surveys of households conducted by the Bank of Italy and the German Federal Bank.4 At the same time, the deterioration of consumers’ expectations concerning their financial situation during the first phase of the COVID crisis (see Graph 2.2) would also suggest that savings accumulated during that period, and thus foregone consumption, were partly motivated by precautionary reasons.5
These findings would suggest that once the containment measures are eased or lifted and uncertainty about the evolution of the pandemic and future income decreases, excess savings could be spent, fuelling a forceful recovery of private consumption. However, other considerations warrant caution.
First, the steady decline in consumers’ assessment of their past financial situation over the past 12 months, with some signs of stabilisation coming only very recently, could imply that even once the virus containment measures are lifted, many consumers may be unable to return to pre-crisis levels of consumption.
Second, a closer look at the breakdown of consumption expenditure by purpose (see Graph 2.5) shows that the initial decline in consumption spending reflected strong decreases in services, durable and semi-durable goods. The collapse in the consumption of durable goods was recouped over the summer of last year when restrictions were eased but also enabled by consumers’ increased recourse to on-line shopping. While services also benefitted from the easing of restrictions, their consumption remains well below the levels recorded before the
crisis. Given that foregone consumption of services can hardly be recouped, the prospects for pent-up demand for services to strongly boost future consumption may be limited. However, some pent-up demand may also come from semi durables, such as clothing.
Graph 2.5: Final consumption expenditure of households by purpose
EU, 2019-Q4=100
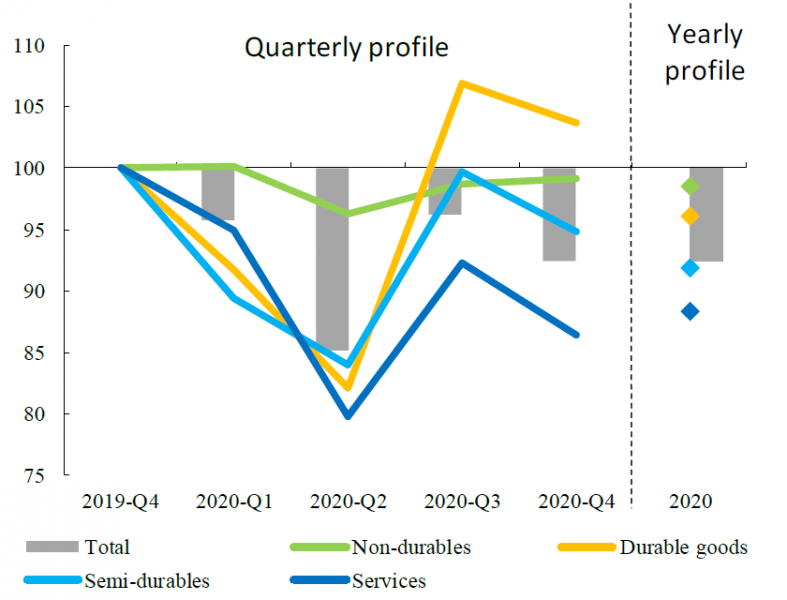
Source: own calculations based on quarterly national accounts, Eurostat.
One important aspect to take into account when assessing the strength of potential pent-up demand is the socio-economic distribution of accumulated savings. If, as is to be expected, savings have been accumulated primarily by higher income households whose propensity to save is comparatively high and whose propensity to consume is correspondingly low, they will be less likely to be unleashed quickly for consumption use immediately after social distancing measures are relaxed.6
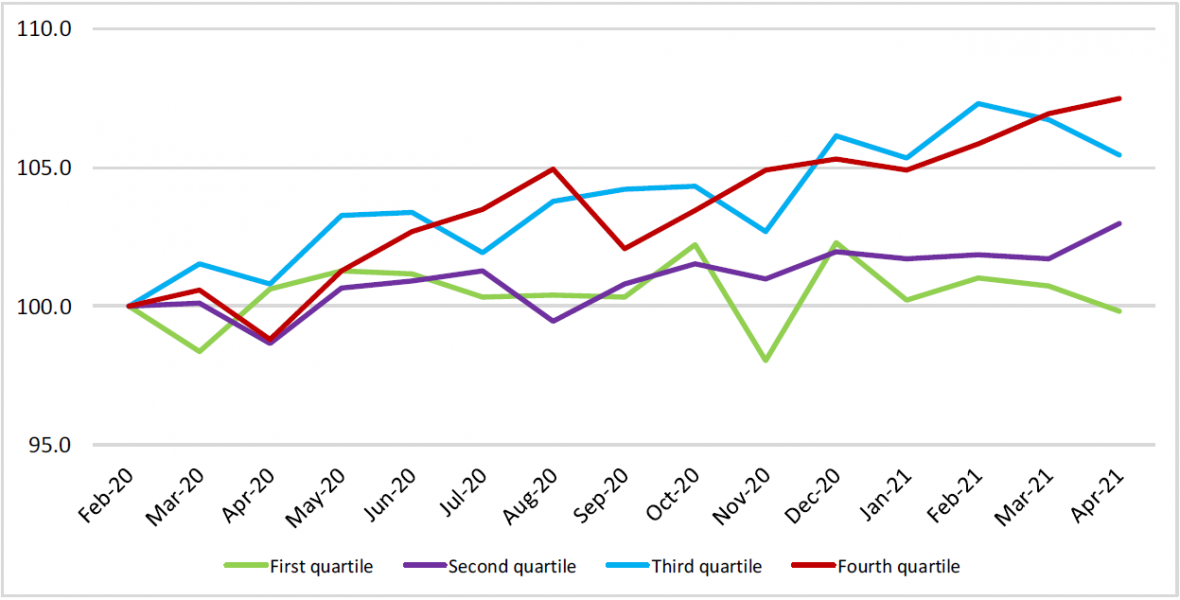
The Commission’s consumer survey provides for a breakdown of the results into four (household) income quartiles. Changes in consumers’ assessment of their current financial situation in terms of saving or dissaving (question Q12)7 since February 2020 vary widely across income categories. On balance, consumers in the upper quartiles report large increases in savings (see Graph 2.6), suggesting that their income levels have been largely sheltered while consumption has fallen due to fewer opportunities to spend while in lockdown. By contrast, those in the lower income quartiles have either increased their savings very slightly, or not at all.
Graph 2.6: Households’ current financial situation (saving vs. dissaving, balance of positive minus negative replies)
EU, Feb. 2020 = 100
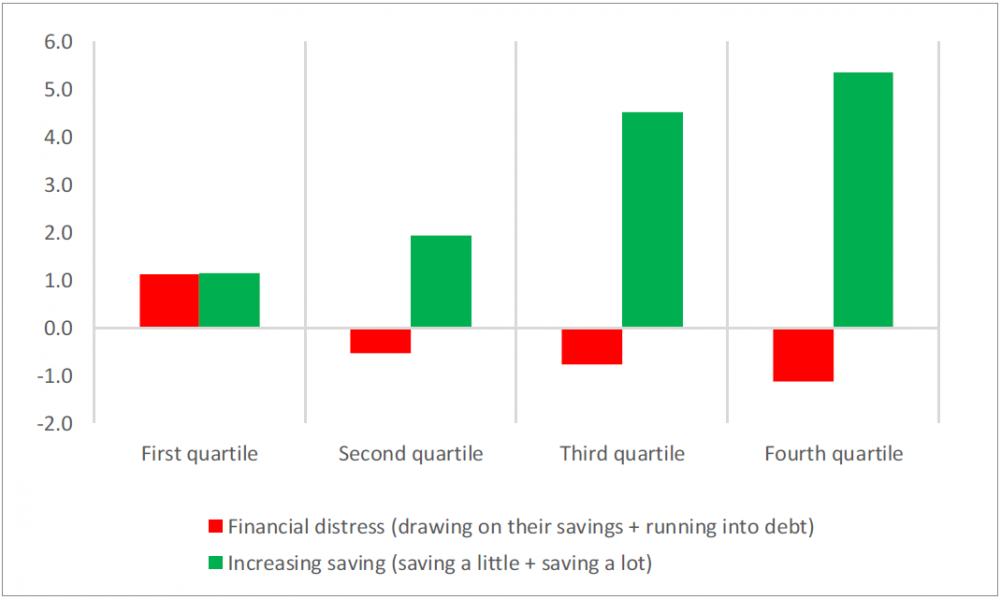
Since the beginning of the crisis, a larger share of lower-income households have had to draw on their savings or run into debt for their living expenses and fewer respondents declared being able to make ends meet (Graph 2.7). The other income groups recorded a decline in the incidence of financial distress, while significantly more households from the upper two quartiles reported an increase in their savings.
Graph 2.7: Share of respondents who are in financial distress or are saving
EU, Apr. 2021 compared to Feb. 2020 (percentage point change), non-seasonally adjusted
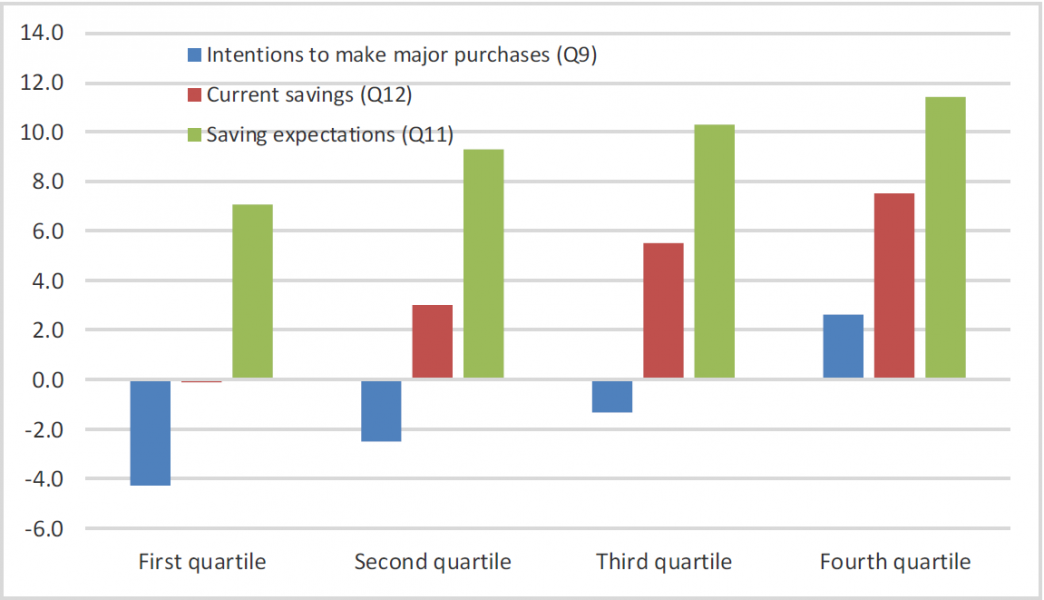
Consumers’ intentions to make major purchases in the next 12 months (Q9) and the current and expected saving situation (Q12 and Q11) are highly correlated with their income group (see Graph 2.8). Since February 2020, the marked increase in the saving intentions of low-income groups has been mirrored by the steep decline in their intention to make major purchases. Consumers’ saving expectations (Q11) have also increased significantly in the higher income groups, with hardly any increase in their combined intentions to spend on major purchases (Q9). Overall, this lowers prospects for large pent-up demand to materialise.
Graph 2.8: Intention to make major purchases, households’ financial situation in terms of saving or dissaving, and saving expectations
EU, Apr. 2021 compared to Feb. 2020 (pp change)
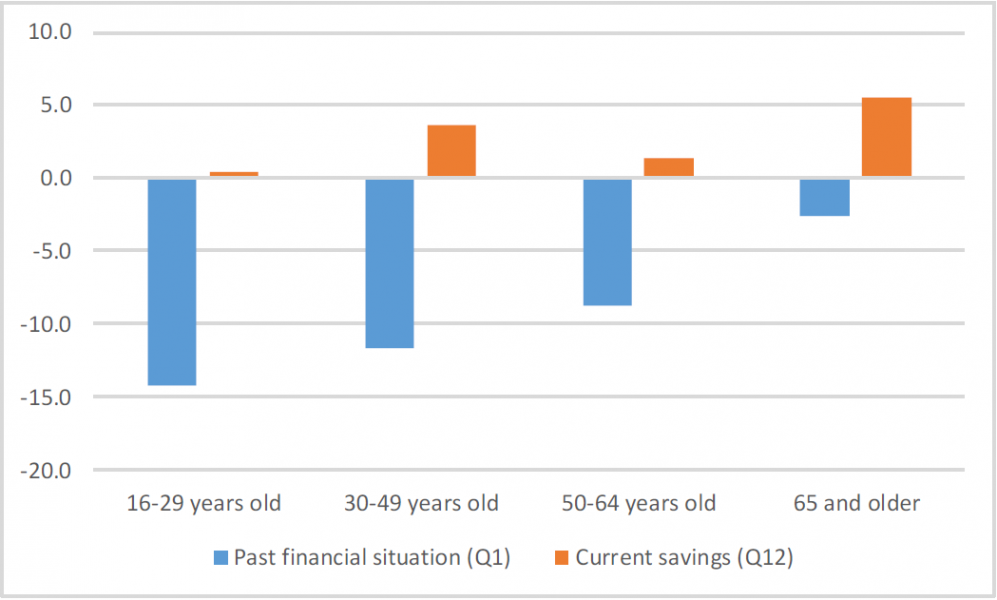
The divergence between consumer groups is even more significant when looking at the breakdown by age (see Graph 2.9). Since February 2020, consumers’ assessment of their financial situation over the last 12 months (Q1) has dramatically fallen for younger respondents, while it has remained virtually unchanged for the oldest (65+ years).
This can be explained by the fact that pensions, the main income source for older respondents, have continued to be paid out during the pandemic crisis. Accordingly, older people are also reporting the greatest improvement in their savings position (Q12) and they are the only group who have seen a clear decrease in financial distress during the crisis (see Graph 2.10).
Graph 2.9: Consumers’ assessment of their past financial situation
EU, Apr. 2021 compared to Feb. 2020 (pp change)
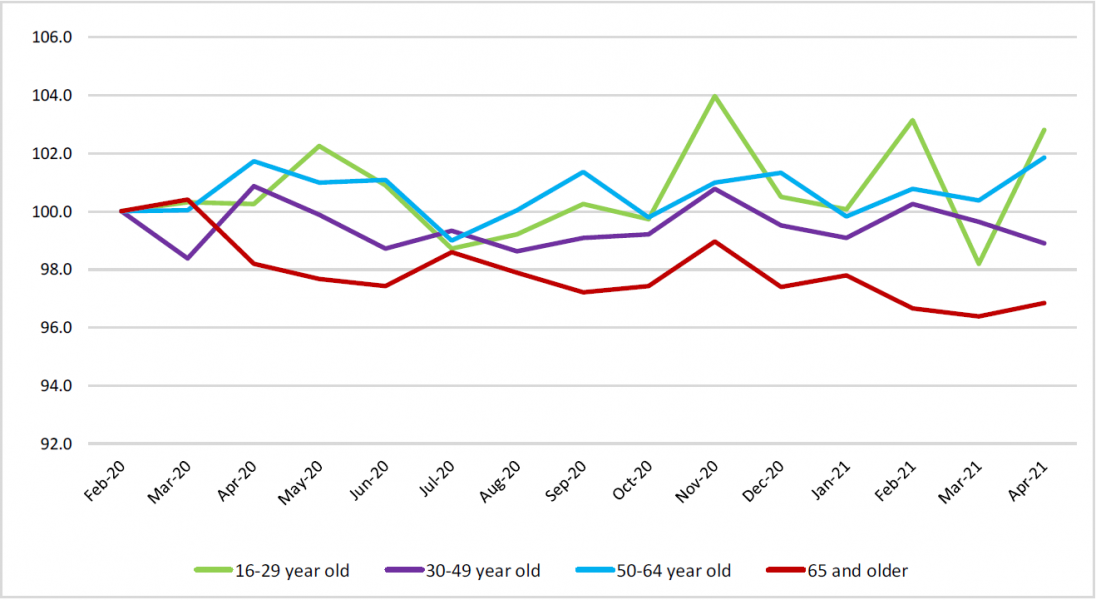
Graph 2.10: Share of respondents who are drawing on their savings or running into debt by age group
EU, Feb. 2020 =100, non-seasonally adjusted
All in all, the analysis of the consumer survey results by income and age groups does not point to a significant impulse from pent-up consumer spending going forward. In particular, low-income earners report low or no accumulated savings, but high savings intentions and low intention to spend money on major purchases. At the same time, the relatively large increase in the saving position of the higher income groups and older people is not likely to be quickly reversed, given the low propensity to consume of these groups.
Compared to February 2020, consumers’ assessment of their past financial situation has deteriorated in all EU countries, except for Finland, the Netherlands, France and Bulgaria, where the indicator increased slightly or remained broadly stable (Graph 2.11).
Graph 2.11: Consumers’ assessment of their past financial situation
Apr. 2021 compared to Feb. 2020
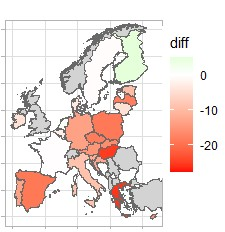
While the financial situation assessment is well below its pre-crisis level in most cases, the severity of the drop varies across EU countries. In Sweden, consumers’ assessment of their past financial situation is only marginally below its pre-crisis level, while in Greece, Malta and Hungary the indicator dropped by more than 20 points below its February 2020 level.
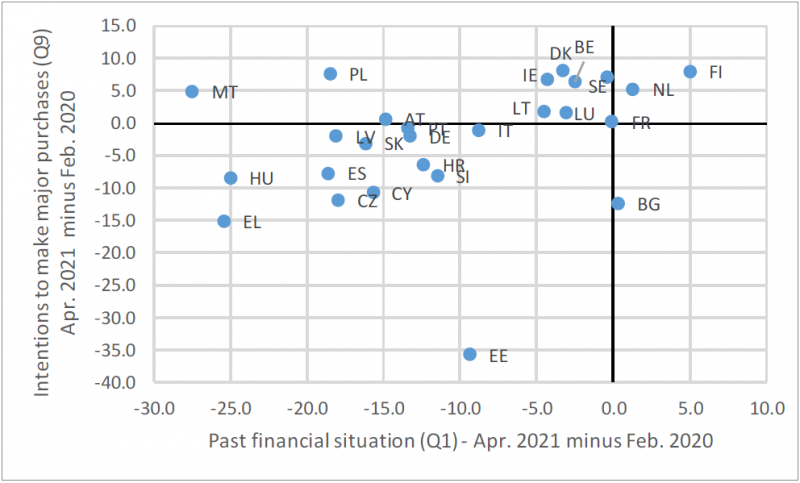
Across countries, consumers’ perceptions of changes to their financial situation are generally highly correlated with the changes in their intentions to make major purchases in the next 12 months (Q9) (see Graph 2.12).
Graph 2.12: Consumers’ assessment of their past financial situation and their intentions to make major purchases
Apr. 2021 compared to Feb. 2020, pp change
In the majority of countries, consumers have lowered their intentions to make major purchases (Q9). This is the case even for half of the countries where consumer savings have increased over the last 12 months (Q12) (Graph 2.13), thus again pointing to limited potential for a fast rebound of consumption once the pandemic has been brought under control.
Graph 2.13: Consumers’ assessment of their current savings and intentions to spend on major purchases
Apr. 2021 compared to Feb. 2020, pp change
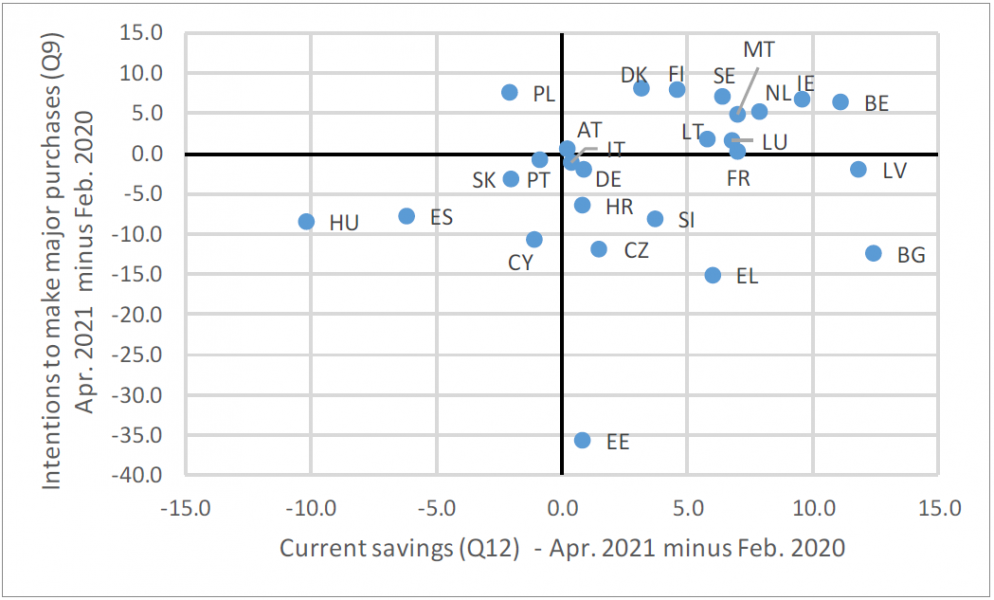
In a group of countries, namely Hungary, Slovakia, Spain, Portugal, Poland and Cyprus, consumers report both a more negative assessment of their past financial situation and an erosion in savings.
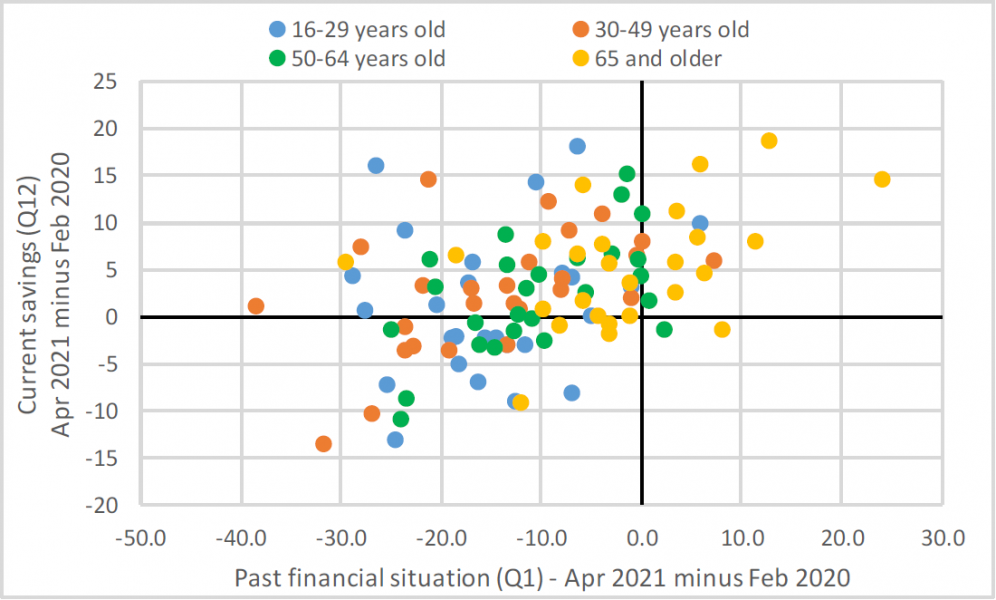
As reported for the EU aggregate, in most countries, the consumers hardest hit by the pandemic crisis are young (from 16 to 29 years old) and in the lower income quartile, whereas the oldest (65+) and highest income quartile consumers seem to be the least affected. In the large majority of countries, the only consumer groups reporting that their past financial situation has improved and that they have managed to increase their savings (laying in the upper-right quadrant of Graph 2.14) are those 65 years or older.
Graph 2.14: Consumers’ assessment of their past financial situation and current savings, by age group
Apr. 2021 compared to Feb. 2020, pp change
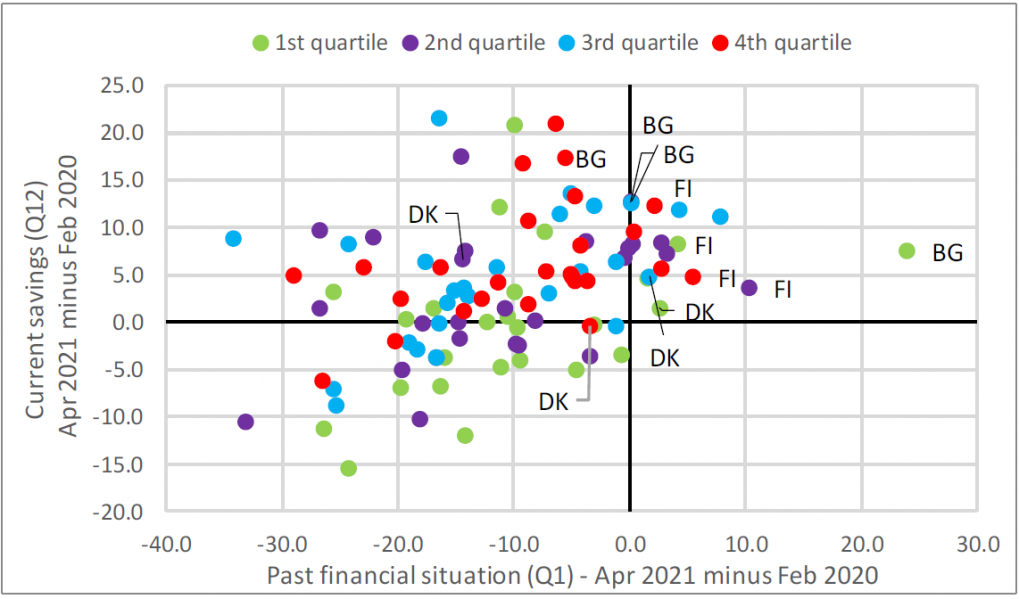
When looking at the breakdown by income quartiles, the differences are less clear (see Graph 2.15). However, higher-income households have generally revised their assessment of their past financial situation (Q1) downwards by less and have managed to save more (Q12) over the past year. Notable exceptions are Bulgaria and Denmark, where the lowest quartiles report an improvement in their past financial situation, while the highest income quartiles report a worsening. In Finland, both the past financial situation (Q1) and current savings (Q12) have improved for all income quartiles.
Graph 2.15: Consumers’ assessment of their past financial situation and current savings, by income quartile
Apr. 2021 compared to Feb. 2020, pp change
This article looks at the consumer survey data up to April 2021 to assess the impact of the COVID-19 pandemic and its accompanying containment measures on the financial situation of consumers and their future saving and spending intentions.
The first finding is that the historically close co-movement between respondents’ assessments of their past financial situation and consumer spending growth has broken down since the onset of the crisis. The mild and steady decline in consumers’ assessment of their financial situation over the past 12 months does not follow the evolution of private consumption, which fell dramatically in the first half of last year and rebounded strongly, though incompletely, in the third quarter. Also, the deterioration in consumers’ financial expectations in the first phase of the COVID crisis cannot fully account for the extent of the fall in consumption spending. This indicates that the restrictions to spending on certain types of goods and services have curbed consumer spending significantly, over and above any precautionary motive, suggesting that once the containment measures are lifted and uncertainty decreases, excess savings could be spent and private consumption could recover more forcefully.
The consumption of durable goods, however, has already recovered significantly, particularly in 2020-Q3, thereby lessening hopes for a forceful pent-up demand ahead.
Moreover, the steady decline in consumers’ assessment of their past financial situation over the past 12 months, with some signs of stabilisation coming only recently, could imply that even once virus containment measures are lifted, many consumers may not be able to swiftly return to pre-crisis levels of consumption.
The breakdown of the consumer survey results by categories of consumers provides interesting additional insights. The comparison of the impact of the crisis on different income groups shows that low-income earners (first quartile of the income distribution) have suffered the most. They have reported a very limited increase in savings and an increasing share of them even had to draw on their savings. By contrast, consumers in the upper quartiles have reported sizeable increases in savings, suggesting that their incomes have been largely sheltered while consumption has fallen.
Looking at the impact on different age groups, the results show that the eldest (65+) have suffered the least. They have been setting aside the most, while younger households have been drawing more on savings as their financial situation has worsened.
All in all, the analysis of the consumer survey results by income and age groups does not point to significant additional impulses from consumer spending going forward. Also, interesting in their own right, these findings point to growing wealth inequality and an increasing generational wealth gap.
Finally, the analysis of cross-country developments corroborates the findings presented for the EU as a whole. In most countries, there has been an increasing gap between income groups and age groups with respect to their assessment and expectations on saving and spending.
This policy note is a slightly updated version of the article „Special topic: Will consumers save the EU recovery? – Insights from the Commission’s consumer survey“, first published in the European Business Cycle Indicators – 1st Quarter 2021. It should not be reported as representing the views of the European Commission. The views expressed in this document are solely those of the authors and do not necessarily represent the official views of the European Commission.
We gratefully acknowledge the useful contributions and comments from Laura Bardone, Head of Unit “Economic situation, forecasts, business and consumer surveys”, Christian Gayer, Head of Sector “Business and consumer surveys and short-term forecast”, and Joao Miguel Leal, Economic Analyst in the “Macro-economic forecasts and short-term economic developments” sector.
All survey data are seasonally adjusted unless noted otherwise.
See Bank of Italy, Economic Bulletin nr 1, 2021, and Deutsche Bank, Monthly Report, December 2020.
Empirical studies investigating the consumption wealth channel usually find a decreasing propensity to consume out of unanticipated increases in wealth across the wealth distribution. A study for France found a marginal propensity of 11.5% in the bottom of the wealth distribution versus a non-significant effect in the top of the distribution; see e.g. Arrondel, L., Lamarche, P. and F. Savignac (2015). ‘Wealth effects on consumption across the wealth distribution: empirical evidence’. ECB Working Paper Series 1817, June.
Q12: Which of these statements best describes the current financial situation of your household: ++ we are saving a lot, + we are saving a little, = we are just managing to make ends meet on our income, – we are having to draw on our savings, — we are running into debt.