In the current situation, financial institutions must cope with both declining revenues and rising costs. In this respect, increasing regulatory requirements have evolved as a considerable cost driver in recent years. Therefore, banks need to increase efficiency of their regulatory reporting.
This policy note introduces a sharing economy in reporting that utilizes the Shapley value to govern cooperation. Within the set-up, financial institutions cooperate in non-core business areas to create synergies in their regulatory reporting. These synergies may lead to a cost reduction that are referred to as economies of share. The Shapley (1953) solution is used to distribute such synergy gains Pareto efficiently. Accordingly, gains are distributed in line with the marginal synergy contributions of the agents. The approach incentivizes participation in a sharing platform and thereby serves as a successful governance scheme.
Financial sector institutions are facing significant challenges. In recent years, decreasing net interest margins, digitalization, new competitors such as FinTechs, and continuously rising regulatory requirements have led to declining revenues and rising costs in the financial sector (English and Hammond, 2018). Banks and other financial institutions must adapt to the far-reaching industry transformation and take appropriate measures to navigate through crises and to ensure business continuity (Plenk et al., 2019). Regulatory reporting factories designed as sharing economy platforms can be a solution to cope with these challenges. Such platforms offer shared infrastructures and services to support the technical and functional operation of the reporting system. Due to the shared infrastructure services, average costs can be reduced, and economies of share are realized. Additionally, outsourcing of IT and processes offers opportunities to be able to react to potential disruptions with the appropriate business continuity management (Lux and Plenk, 2020). A game-theoretic distribution mechanism is proposed to provide a governance scheme for the sharing economy platform.
This paper is organized as follows. Chapter 2 describes the role that regulatory reporting plays in banks. Chapter 3 defines the term sharing economy and applies it to the reporting case. Chapter 4 states challenges that any form of sharing has to cope with. Chapter 5 explains how the Shapley solution known from cooperative game theory opens up avenues to overcome obstacles and establish a sharing economy in regulatory reporting. Chapter 6 concludes.
Fulfilling reporting obligations of banking regulations is a non-core business area where competition is not conducive to business success. Therefore, regulatory reporting should not tie up resources and capacities needed for crucial investments in core business areas. In reality, however, inefficient processes cause higher costs than necessary. A major reason for such deficiency is a very low utilization of innovative technology within the banking regulatory reporting regime. In most regulatory frameworks and jurisdictions, the regulatory data flow still happens in quasi-manual, template-based fashion. Only a few jurisdictions have started to think about how new technologies like artificial intelligence (AI), application programming interfaces (API), big data, cloud technology, high-performance computing, and blockchain / distributed ledger technologies (DLT) can be used to open new possibilities in the field of regulatory reporting. Meanwhile, many of these technologies have matured far enough to offer new approaches for regulatory reporting, which may help to dampen costs. However, new technologies often cannot be deployed efficiently due to a lack of common standards in data models and processing (Drvar et al., 2020).
The above deficiencies in regulatory reporting call for a wider transformation of the industry. A possible transformative path is to exploit the opportunities that the various models of a sharing economy offer.
There is no common understanding of the term sharing economy.1 However, all definitions have in common that sharing means granting access to the use of something while not redistributing ownership of it. This form of exchange is enabled by an organization with a platform2 character supported by an engaged peer-to-peer community that is practicing collaborative consumption as it consumes so-called club goods. Use of the latter is non-rivalrous in a way that it does not lead to depletion of the good. Users, however, can be excluded from consumption. In contrast, classical redistribution markets fully transfer ownership of private goods where use is rivalrous and users are excludable.
A key feature of sharing platforms is that they serve as a governance scheme to make accessible hitherto unexploited capacities of resources which, in principle, can be activated and marketized. For example, a peer supplier can offer the use of his resource at temporal or quantitative limitations that would otherwise discourage customers on non-platform markets as they look for suppliers that can be trusted to provide a good at any time in the preferred quantity. However, with a platform, peer-clients know that they will find an equivalent service on the platform at any time or quantity. Here, the club good provided by the platform exists in the form of an increase in a) reliability of supply and b) decreased marketing costs that result from increased market accessibility. It can be argued that only a platform unlocks the potential to utilize peer-supply capacities that would otherwise be very costly.
Apart from organizing supply-side accessibility, platforms also increase the reach of a market at the demand side as more diverse demand profiles can become visible. Thereby, platforms lead to generalized increasing returns, because more demand of a certain good offers the opportunity to produce it at larger scales where average costs are lower (Buchanan and Yoon, 1999). Platforms in general, create positive externalities via network effects: The more supply and demand enters the platform, the greater are the exchange opportunities for all parties involved and the better are the prospects of increasing the platform reach in a second round.
Sharing economies can lead to a decrease in average costs, help to fully exploit all available resources and establish market exchanges that enable general efficiency increases. The fruits of such sharing platform externalities can be referred to as economies of share.
A collaborative approach in regulatory reporting can serve multiple financial institutions by sharing large parts of the inputs necessary to produce reportings. The participants of such a shared reporting factory could achieve savings by using, for example, common IT deployments, IT maintenances as well as licenses and operations. Thereby, computing capacities and cloud usage can be managed more economically.
A joint factory establishes standardizations which will not only improve the efficiency of the entire reporting system but also increase its quality. In this way both the supervised institutions and the supervisor benefit from a collaborative approach (Lux and Plenk, 2020).
Table 1 states the sharing economy case of a financial reporting factory designed as a platform that helps to realize the joint provision of several club goods for reporting peers. These reporting peers jointly demand the same reporting relevant services from a single provider.
The shared reporting factory is not a platform in the sense that it is an intermediate on a marketplace where peers act as supply and demand of the requested services themselves. However, the factory acts as a platform by facilitating market-type negotiations that provide the governance means for many peers to act as a single entity that demands several club goods from a single provider, as observed with monopsonies (demand-side monopoly). Peers share with each other individual synergy and bargaining power resources that are hitherto locked for joint exploitation.
Table 1
Shared peer-resources and provided club goods in the reporting case across different service areas.
|
Reporting service area |
Service |
Shared peer-individual resource |
Club Good |
|
Joint technical operation and administration |
Software licenses |
Individual bargaining power |
A fixed cost decrease due to negotiated quantity discount |
|
Joint technical operation and administration |
System administration |
Synergy potential to increase efficiency via higher utilization rate |
A fixed cost decrease from reduced staff per unit of service provided |
|
Joint technical operation and administration |
Hardware capacity |
Individual bargaining power and synergy potential within a distributed computing framework |
A fixed cost decrease from reduced hardware deployments per unit of service provided |
|
Joint technical operation and administration |
Technology consulting |
Synergy potential to increase efficiency via solving a task valuable to all with single effort
|
A fixed cost decrease from reduced staff per unit of service provided
|
|
Joint technical/functional operation and administration |
Project management |
||
|
Joint technical/functional operation and administration |
Administrative overhead |
||
|
Joint functional operation and administration |
Functional requirements definition |
||
|
Joint functional operation and administration |
Data modelling and ETL processing |
Sharing is a form of cooperation that generates costs. Individuals and organizations will only participate in cooperative action if they can expect benefits that clearly outweigh costs. The following sections explain the possible types of costs and show how benefits can be generated and distributed such that cooperation is beneficial for sharing participants and will therefore be the dominant strategy.
The operation phase of sharing is complex, potentially conflictual, and hence requires costly coordination of action. Also, ex ante cooperation, costs arise from negotiating effective governance structures that define both decision making and distributional rules which find potential consent of participants (Buchanan and Tullock, 1962). Additionally, times of societal transformations often come with general uncertainty which renders it individually profitable to invest in blockade and conflict rather than approval (Aufderheide, 1998). Then, negotiators gamble for higher individual shares from the common gains. This blockade of a solution that actually only sees winners, could be misinterpreted as self-harming behavior, although it is rational. As with any negotiations, equality among negotiators is a delicate balance: sharing partners must both respect and trust each other, which is more likely among equals. The opportunity to exchange, however, is often only present with partners unequally endowed.
Regulatory reporting fully depends on upstream front office and back office divisions and is tied by its technological restrictions. At the CEO level, heterogenous software and architectural landscapes within and across banks seem to offer little room for strategic focus on cooperation in reporting.
Directing attention to reporting divisions, resources are mainly bound by operative tasks. Additionally, involved employees can have limited personal interest in change when they profit from intra-company niches where they are indispensable specialists. In this respect, some managers and employees could fear a devaluation of their expertise or the outsourcing of activities in case their institution cooperates with others. Such inertia to stick with status quo solutions is further intensified by hidden information and a general lack of transparency when only regulatory reporting divisions know the true cost structures and drivers.
A further issue are internal negotiation costs. Most banks are operating globally, which increases the costs of employing common governance structures that are needed to build a sharing economy.
In order to face the economically challenging times, banks are currently interested in easy-to-implement cost reductions rather than the setup of long run projects that cooperation would demand.
Most unfortunately, banks cannot hope for regulators to remedy the situation by steering the market towards a joint cooperative approach, as supervisory bodies are neutral to operative strategies and behave technology agnostic in general.
Different to the non-cooperative branch, which is more prominent in public awareness, cooperative game theory does not look at situations where several actors freely choose their strategies towards each other, which will then result in a self-enforced equilibrium behavior. In contrast, the cooperative branch assumes a situation where actors will be part of a binding contract that manages a common resource by allocating common costs or benefits among the contract coalition. Any contractual allocation will be the result of a solution approach that fulfills certain axioms.
One specific solution concept was first proposed by Llyod Shapley in 1953.3 The main idea behind the approach, commonly referred to as the Shapley value, is that the distributed individual returns, revenues, or costs should reflect the value the recipient has as being a valuable coalition partner from a strategic point of view.4 This value is measured in terms of a partner’s marginal contribution to the objective of all coalitions that can possibly evolve among participants. If minimized joint costs are distributed, a valuable coalition partner is one that adds little extra costs to joint costs. Hence, coalition members must pay for the average marginal costs they add to all possible coalitions. If a joint benefit or revenue is allocated among a coalition, valuable members are those that add a joint benefit by participating. Accordingly, partners receive benefits in line with their marginal impact on joint returns. Note that the calculation of Shapley values is explained in the following sections.
The Shapley solution is implementing a stable and pareto efficient solution whenever the underlying game is convex (Shapley, 1953). The latter implies that the joint gains strictly increase with new participants.
The Shapley approach has been applied to a real world-setting before: it has been studied in network settings as with airport fees (Littlechild and Thompson, 1977), public transportations (Fischer, 2008), logistics (Strangmeier and Fiedler, 2011), and gas pipelines (Cobanli, 2014). Additionally, machine learning uses it as a method in data valuation (Ghorbani and Zou, 2019; Jia et al., 2020). Google Analytics services (2021) already practice a Shapley-inspired approach within data-driven attribution.
The solution concept can be operationalized by defining a characteristic function that returns an objective’s value for all possible coalitions. Therefore, at first, it must be considered whether the objective of the coalition will be distributing costs or rather benefits.
Within a non-revenue generating business unit as regulatory reporting, ultimate benefits are clearly the achieved cost reductions that stem from realizing synergies. Therefore, either cost reductions or costs themselves can be distributed. In any case, the cost drivers of reporting have to be made tangible to be able to measure marginal cost impacts of individual coalition members. Therefore, this paper conceptualizes the cost drivers of reporting as reporting items.
5.1.1 A framework to determine coalition functions
Reporting items are inputs that enable the individual reporting agent to report correctly, for example, with respect to 1) including all offered types of products; 2) adapting the chosen regulatory or accounting methods; 3) timely processing of data volumes; 4) operation of technical systems; 5) delivering a data quality that avoids validation errors. A reporting items catalogue will list all reporting items a specific reporting agent needs to deliver a valid report.
There is room for cost reductions based on synergies whenever a single spending on the production of a reporting item is sufficient to realize the item for multiple agents. This single spending will only be feasible with items that are comparable in their characteristics across all agents (e.g., standard products, standard core systems). Such items are labeled homogenous items.
See appendix figure 1 for a graphical example, where three banks list reporting items A to K in their items catalogue from which four are homogenous and hence qualify for achieving synergies.
Based on this conceptualization of cost drivers, either costs or benefits can be distributed. In both constellations, individual Shapley values are calculated for all coalition members at first. Subsequently, for each individual participant, the share of its own Shapley value in the sum of all participants Shapley values is computed and referred to as the Shapley share. This share can be multiplied with the amount to be shared among platform participants which can be benefits and costs but also the margin earned by the factory itself. Such factory margin must be calculated as a percentage, which is negotiated between the group of factory participants and the factory, and then applied to an assessment base like factory expenses, for example.5
5.1.2 Option A: Distributing benefits among participants
When choosing to distribute the benefits of cooperation, the focus is on homogenous items only as these are the ones where cost reductions can result from the sharing of peer resources. Nevertheless, non-homogenous items can be produced by the factory, however, at individual billings.
Shapley values are calculated based on achievable cost reductions, i.e., synergies that are derived from the dispersion of homogenous items among reporting agents. Whenever partners match a specific homogenous reporting item, a synergy can be detected and kept in a synergy matrix (see figure 2). During this stage of the calculation, weights can be applied to each type of homogenous reporting item to reflect their differing cost intensities.
Based on such a synergy matrix, we can state realized synergies (cost reductions) for all possible factories, which is a mapping sufficient to serve as a function from which Shapley values can be calculated for each partner. To do so, the marginal synergy contribution of each partner is calculated for every possible coalition that could evolve (see figure 3). The marginal synergy contribution is the difference between the synergy payoffs of the joint coalition including the considered partner (see column “w/”) and without it (column “w/o”). Subsequently, the Shapley value is calculated by building the average over all such marginal synergy contributions to possible coalitions.6 Finally, the corresponding Shapley share can be multiplied with realized factory expenses spent on homogenous items.
Although expenses are distributed, we regard the presented approach as a way to distribute benefits because the – compared to the status quo – smaller factory expenses already entail the cost cuttings and are distributed in a way that respects the marginal contribution of the individual to this new state.7
Figure 4 and 5 show how expenses on the production of homogenous and hon-homogenous items as well as the factory margin are distributed within the platform coalition. Compared to the status quo, clearly all participants are better off when participating in the platform coalition.
5.1.3 Option B: Distributing costs among participants
When distributing costs, Shapley values are calculated based on all reporting items that represent relevant cost drivers (see figure 6). Again, the different cost intensities of reporting items can be considered by applying a weight to each reporting item that reflects the item’s share in the overall factory expenses. Finally, Shapley shares can be multiplied with factory expenses to return individual cost contributions.
5.1.4 Comparison of option A and option B
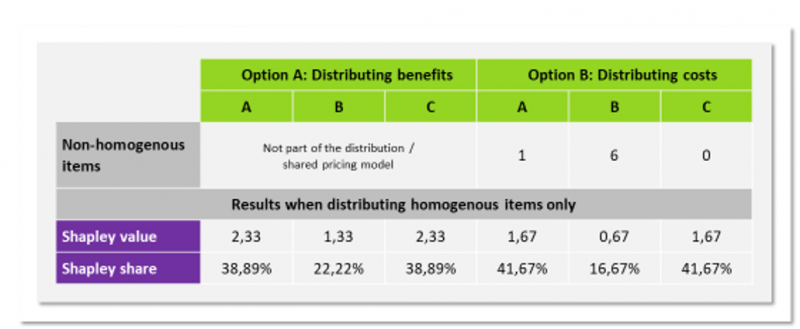
In appendix figure 7, Shapley shares of option A and option B are compared, while restricting the distribution to homogenous items. Accordingly, Shapley values that reflect a participant’s marginal cost contribution (option B) reach a different result than do Shapley values based on marginal contributions to reducing joint costs (option A).
The results show that option A requires higher contributions from participants that are less important for achieving joint benefits within a common factory than option B does. In times where many shared factories compete against each other, this rule can represent a competitive advantage, because it attracts future participants that are favorable for reducing joint costs further rather than those who are not. Unlike merely distributing costs, we therefore favor option A and hence let factory coalition members participate according to their synergy potential.
A transitional process towards a joint market factory can lead via, first, operating several specialized RegTech Factory sharing communities, which serve banks that are similar with respect to business profile, software landscape (e.g., core banking systems), type of ownership (e.g., public versus private banks) or legal form (e.g., mutual or cooperative banks). Subsequently, such diverse sharing communities can successively be consolidated within a joint factory covering the entire market.
Launching a shared factory that enables banks to participate in the economies of share will be a step-by-step process. One possible approach is a factory that starts with a limited set of participants that can easily discover their synergy potential at a limited set of services, for example, in technical operations, where low hanging fruits can easily be harvested. Thereafter, such a factory could increase step-by-step and in a linear fashion both the number of participants and the depth of services covered by the factory production. Another possible approach is a factory that restricts the set of services in the beginning and focuses on integrating more and more participants, before cooperation is rolled out to other service areas. Finally, there might be many shared factories evolving in parallel, each adopting an approach that best suits its participants expected benefits.
The financial sector is facing declining revenues while costs are rising continuously. This paper offers an approach to increase efficiency in regulatory reporting of financial sector entities. We propose to establish sharing platforms that decrease average costs and thereby create economies of share for which they serve as a common governance scheme. Within the regulatory reporting industry, economies of share can be realized particularly in the area of joint technical and functional operation as well as administration. Several obstacles could hinder the transformation towards a sharing practice such as disputes on how to distribute synergy gains across agents. The Shapley value provides a Pareto efficient distribution mechanism that considers the individual agent’s impact on the joint result and can therefore be considered as a fair solution. The given example shows that every cooperation partner is better off compared to the case without a sharing economy. Finally, this paper points out different implementation scenarios that facilitate the transformation process towards cooperation by means of sharing in the financial industry.
Figure 1
Example: Classification of reporting items in a shared factory case.
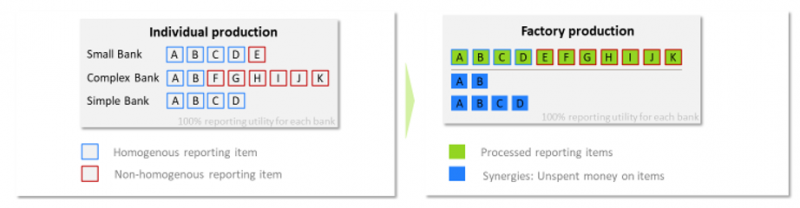
Figure 2
Option A: distributing benefits. Set up of the synergy matrix to derive coalition payoffs.
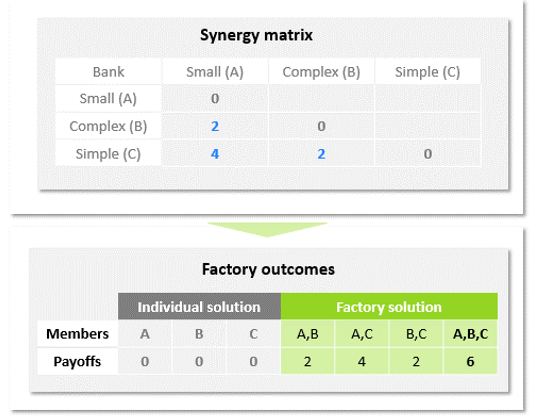
Figure 3
Option A: Distributing benefits. Computation of the Shapley value and share.

Figure 4
Option A: Distributing benefits. Result of pricing based on the Shapley value.
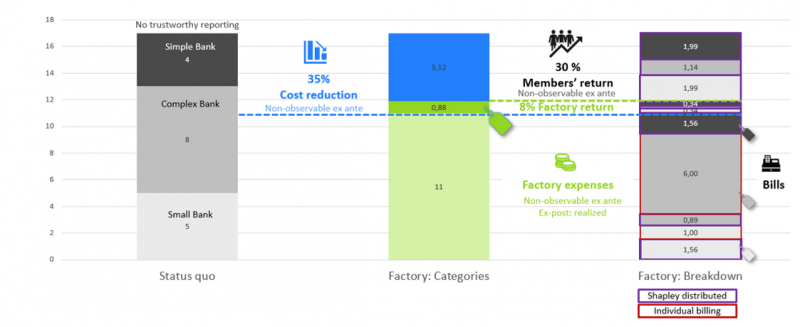
Figure 5
Option A: Distributing benefits. Pricing of homogenous items based on the adapted Shapley approach.
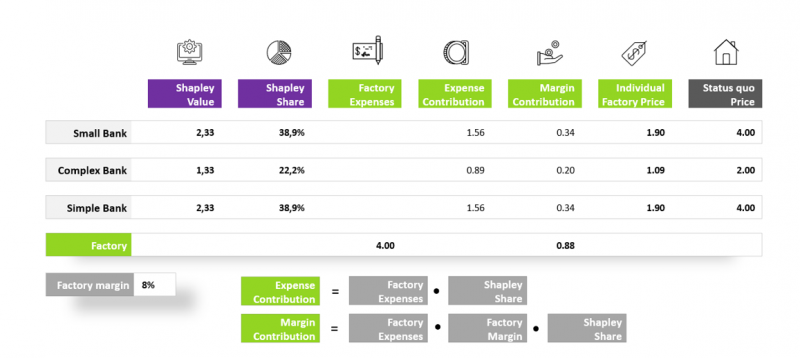
Figure 6
Option B: Distributing cost. Computation of the Shapley value and share.
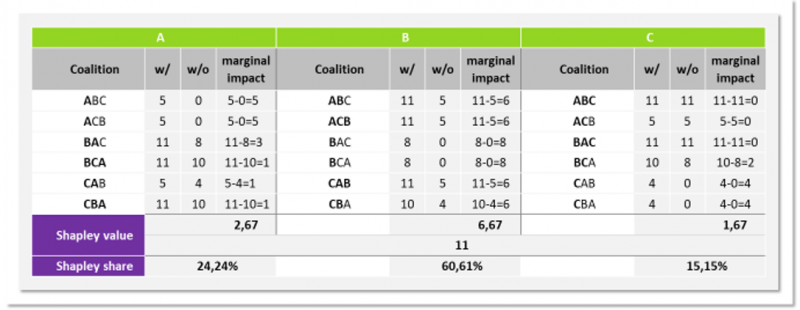
Figure 7
Comparison of option A and option B while applying Shapley pricing to homogenous items only.
Pareto efficiency ensures that all gains on the table are distributed. This axiom ensures that all market participants could unite under a common factory in principle. Anti-trust agencies will however not have to worry about witnessing the cradle of a monopoly, as any factory will start in a competitive set-up where other actors may decide to enter the market for factories. Also, in case we would see a single factory in the end, this would be a two-sided monopoly where not only supply (the factory platform) but also demand (participating banks) is represented by a single party. In such a setting, participating banks are ultimately connected and therefore have a strong negotiation power. They can credibly threat to jointly leave the factory in case it performs badly in realizing synergies at low cost.
Additivity enables the factory participants to exclude a set of services from an initial factory and outsource it to another specialized factory. If the latter factory is also governed by a Shapley pricing approach, additivity will ensure that adding up the participants’ returns across both factories, will result in the same value as with the single factory.
Symmetry ensures fairness in the respect that participants with the same value to the factory have to pay the same price and therefore participate equally in the synergy returns of homogenous items.
No zero players guarantees that participants without any contribution to the joint synergies will not profit from them. Accordingly, this axiom rules out free-riding as well as contribution to costs that a participant does not take an advantage from.
Limited stability states the Shapley solution to only be stable in so-called convex sets such that it is only rational not to form other coalitions outside the factory in case the factory operation manages to strictly realize economies of scale at an increasing number of participants. Therefore, the Shapley approach puts the joint factory under a pressure to perform.
Aufderheide, D. (1998). Warum saufen die Pferde nicht? Zur Beobachtung selbstschädigender Blockaden der Interessengruppen in Zeiten gesellschaftlichen Umbruchs. In M. Leschke, & I. Pies, Gary Beckers ökonomischer Imperialismus (pp. 107-135). Tübingen: Mohr Siebeck.
Bruno, B., & Faggini, M. (2017). Sharing Economy: For an Economic Taxonomy. International Journal of Economics and Finance, pp. 174-178.
Buchanan, J. M., & Tullock, G. (1962). The Calculus of Consent: Logical Foundations of Constitutional Democracy. Michigan: University of Michigan Press: Ann Arbor Paperbacks.
Buchanan, J. M., & Yoon, Y. J. (1999). Generalized increasing returns, eulers’s theorem, and the competitive equilibrium. History of Political Economy, pp. 511-523.
Cobanli, O. (2014). An Application of Cooperative Game Theory: Strategic Investments in the Natural Gas Network. pp. 1-141.
Drvar, M., Turner, D. J., Piechocki, D. M., Stiegeler, E., & Münch, D. (2020). The future of data collection and data management: Agile RegOps for digitalizing the regulatory value chain. pp. 1-15.
English, S., & Hammond, S. (2018). Cost of compliance. Thompson Reuters.
Fischer, D. (2008). Konzepte der kooperativen Spieltheorie. In D. Fischer, Leistungsgerechte Zuteilung von Erlösen in Netzwerkorganisationen (pp. 63-77). Nomos.
Ghorbani, A., & Zou, J. (2019). Data shapley: Equitable valuation of data for machine learning. arXiv preprint arXiv.
Google LLC. (2021). support.google.com. Retrieved from https://support.google.com/analytics/answer/3191594?hl=de
Jia, R., Dao, D., Wang, B., Hubis, F. A., Hynes, N., Gurel, N., & Spanos, C. (2019). Towards efficient data valuation based on the shapley value. arXiv preprint arXiv.
Lightfoot, J., & Spinetto, R. (1993). An algorithm for sharing costs of operating a computer network. Omega (Oxford), pp. 585-592.
Lux, J., & Plenk, M. (2020). Die Regtech Factory – “Economies of Share” als Lösungsansatz im Meldewesen. Zeitschrift für das gesamte Kreditwesen, pp. 22-27.
Moazed, A., & Johnson, N. (2016). Modern Monopolies: What It Takes to dominate the 21st Century Economy. New York: St. Martin’s Press, Inc.
Plenk, M., Levant, I., & Bellon, N. (2019). How Technology (or Distributed Ledger Technology and Algorithms Like Deep Learning and Machine Learning) Can Help to Comply with Regulatory Requirements. In V. Liermann, & C. Stegmann, The Impact of Digital Transformation and FinTech on the Finance Professional (pp. 241-257). Cham: Springer Nature.
Rochet, J.-C., & Tirole, J. (2003). Platform Competition in Two-Sided Markets. Journal of the European Economic Association, pp. 990-1029.
Shapley, L. S. (1953). A value for n-person games. In H. W. Kuhn, & A. W. Tucker, Contributions to the Theory of Games (pp. 307-317). Princeton: Princeton University Press.
Strangmeier, R., & Fiedler, M. (2011). Lösungskonzepte zur Allokation von Kooperationsvorteilen in der kooperativen Transportdisposition. pp. 1-100.
Winter, E. (2002). The Shapley value. In S. H. R. J. Aumann, Handbook of game theory (S. 2025–2054). Amsterdam.
See Bruno and Faggini (2017) for a thorough literature review and taxonomy of the term.
A platform is an intermediary that creates value by facilitating exchanges (Rochet and Tirole, 2003; Moazed, 2016).
Lloyd S. Shapley received the 2012 Nobel Memorial Prize in Economic Science.
A detailed summary of the Shapely value is provided by Winter (2002).
Note that it would not be feasible to use realized cost reductions as an assessment base. Such procedure would require participants to state their ex ante factory spendings per reporting item as a reference point from which the factory expenses are deducted. Then, however, participants always have an incentive to underestimate the ex ante factory costs as this would diminish the assessment base and hence their individual contribution to the factory margin.
Note that the Shapley solution fulfills a specific set of axioms which is related to the setting of option A in Appendix II.
Another practical reason in favor of such an approach is the lack of better alternatives. Cost reductions which are realized while evolving from an ex ante factory state to the factory state cannot be redistributed as this would demand participants to honestly and fully report their current reporting costs and transfer them to the factory. Then, the factory could calculate an individual payback by applying the individual Shapley shares to the difference between the sum of all participants ex ante factory outlays and the factory expenses. In such a setting, all participants have an incentive to underestimate their ex ante factory outlays such that they can profit from a pot that is equipped by others.