New reports show that the financial sector is increasingly adopting machine learning (ML) tools to manage credit risk. In this environment, supervisors face the challenge of allowing credit institutions to benefit from technological progress and financial innovation, while at the same time ensuring compatibility with regulatory requirements, and that technological neutrality is observed. We propose a new framework for supervisors to measure the risk-adjusted performance of ML models, harnessing the process for validating internal ratings-based (IRB) systems for regulatory capital to detect ML’s limitations in credit default prediction. From a supervisory standpoint, having a structured methodology for assessing ML models could increase transparency and remove an obstacle to innovation in the financial industry.
According to an IIF survey (2019a)1 the most common use of Machine Learning (ML) in the financial industry is in the field of credit scoring. Out of 60 international institutions consulted, 37% have fully operational ML models dedicated to automating credit scoring processes. The survey also reveals that credit institutions have reduced the use of ML in capital calculation, stress testing and even provisions, while increased the use in business-related solutions such as decisions on granting new credit, monitoring outstanding loans, and early-warning systems. One of the reasons mentioned by institutions to abandon the use of ML for regulatory capital is that “regulatory requirements do not always align with the direct application of ML models, due to the fact that regulatory models have to be simple, while ML models might be more complex (although not impossible) to interpret and explain”. The scale of the challenge of aligning ML with the prudential regulation becomes clear with the reported reduction in the use of ML for calculating regulatory capital, which fell from 20% in 2018 to 10% in 2019. A recent study (see European Banking Authority, 2020) reports a similar figure, with close to 10% of European institutions currently using ML models for capital purposes.
Another survey by the UK financial authorities (Bank of England 2019a)2 points on the same direction. Most of the banking institutions who responded to this survey answered that they already use ML, mainly for lending (i.e. credit scoring and pricing). The survey also shows that the use of ML in the financial industry is not restricted to banking institutions. Other types of institutions, such as insurance companies or asset managers have started to implement these types of models. Similarly, at European level the use of ML and big data is gaining traction in the Fintech industry based on studies conducted by the European Banking Authority (EBA) (2017c and 2018) and Eccles et al (2020).3
It definitely seems as though we are in an early adoption phase of AI/ML technology in the provision of financial services4, and especially in credit risk management. More and more institutions are studying the feasibility of ML in the market, which clearly show their interest in this innovation. However, under the current regulatory landscape the use of simpler statistical models is predominant in the market because institutions prioritize the ease of interpretability and explainability of results over the potential gains on predictive power (see European Banking Authority 2020). How can supervisors face the challenge of allowing innovation while respecting technological neutrality and compliance with regulation?
We have conducted a review of the academic literature on credit default prediction comparing the predictive power of ML models with traditional quantitative ones.5 In particular, we chose papers that use as a benchmark a logistic regression or Logit. This will help us understand the performance of ML models in predictive power terms as their algorithmic complexity increases.
The following Figure 1 presents in an orderly manner all the papers included in our literature review6. On the horizontal axis we divide the papers based on the ML technique used and the a priori algorithmic complexity.7 On the vertical axis we measure the gain in predictive power relative to the discriminatory power obtained using a Logit model on the same sample. While as mentioned above the sample sizes and the nature of the underlying exposures and model designs differ between studies, they all highlight that the more advanced ML techniques (e.g. random forest and deep neural networks) predict better than traditional statistical models. The predictive gains are very heterogeneous, reaching up to 20% and not behaving monotonically as we advance towards more algorithmically complex models.
Figure 1. The dilemma between prediction and algorithmic complexity
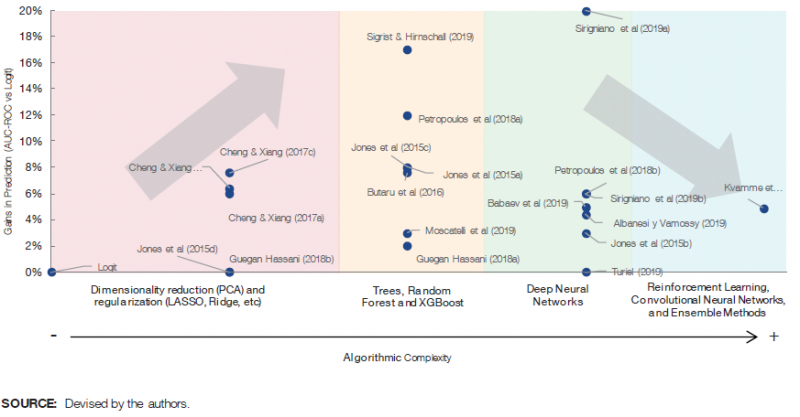
Ultimately, from the literature review we conclude that there are potential significant predictive gains for institutions, leading us to further investigate the definition of the risks associated with the use of ML techniques from a supervisor’s perspective8.
From a prudential standpoint, there are different angles or areas involved in the microsupervision of predictive models used by credit institutions, mainly referring to the models’ statistical requirements, assessment of the technological risk profile and market conduct issues. While regulatory heterogeneity in this regard adds value and allows for fully fledged coverage of the potential risks derived from using predictive models, it is also an obstacle to isolating the factors that determine whether or not a new quantitative tool is compatible with the regulatory and supervisory framework. There are papers in the literature that try to explain which factors matter to the supervisors when evaluating ML models or AI (see for instance Dupont et al 2020 for a comprehensive summary).9 However, we are yet to address the challenge of how to rank and weight each of these factors, assessing the overall impact for the supervisor, which at the moment suffers from being considered an obstacle to further innovation (IIF 2019b, Bank of England 2019, European Banking Authority 2020).10 In order to do this, we could harness the validation of IRB systems to identify and classify all the risk factors that might be considered from the supervisors. Although the IRB approach is restricted to the calculation of minimum capital requirements, it has an impact beyond this use, as the risk components estimated using IRB models must be aligned with those used internally for any other purpose.11
When using the foundation IRB approach, as a general rule institutions will only have to estimate the probability of default (PD), while the remaining risk components, such as loss given default (LGD), will be pre-determined by the regulation.12 Once the statistical model’s design has been approved, and the estimation is aligned with the supervisor’s requirements, the result will be entered into an economic model for computing regulatory capital. This part of the validation is primarily quantitative. In tandem, IRB systems also involve issues like data privacy and quality, internal reporting, governance and how to solve problems while operating normally. The importance of these issues will depend on the purpose of the model (e.g. credit scoring, pricing, or provisioning, apart from the main use i.e. regulatory capital calculation). This part of the validation is mostly qualitative, and is more dependent on the supervisor’s expertise and skills.
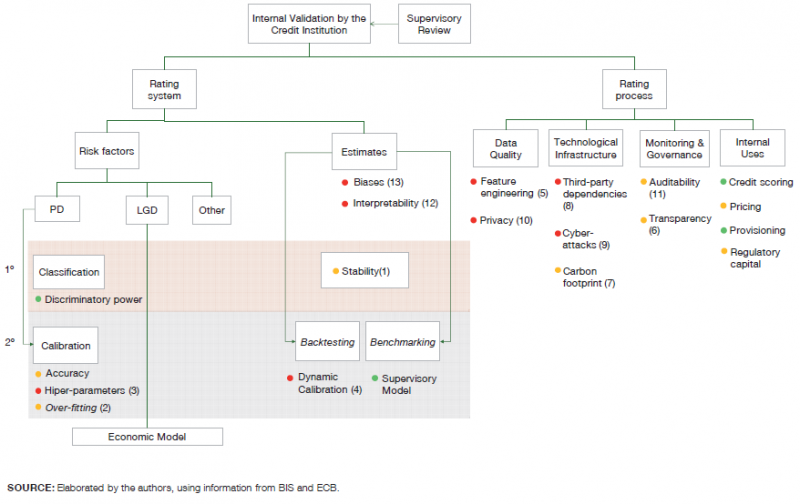
We study the compatibility of the use of ML with the IRB validation scheme. This way we can identify the potential benefits and risks embedded in these models for the supervisory perspective. In Figure 2 we use a traffic light system to understand the degree of compatibility. Green denotes those aspects for which the use of ML is a good fit or offers even an improvement with respect to traditional statistical techniques. Amber indicates the aspects where there is still uncertainty, and red those for which there may be a limitation in the use of ML, and therefore the need for further adaptation. These assessments are further explained in our paper Alonso and Carbó (2020).13
Figure 2. Components of the validation of IRB systems and their compatibility with ML
In sum, we have used the IRB system to list the factors that should be accounted for to understand the risk-adjusted performance of ML models. In Table 1 we group these factors into three categories: (i) statistics, (ii) technology, and (iii) market conduct.
Table 1. Summary of benefits and models’ risk factors, based on each possible use of the ML model
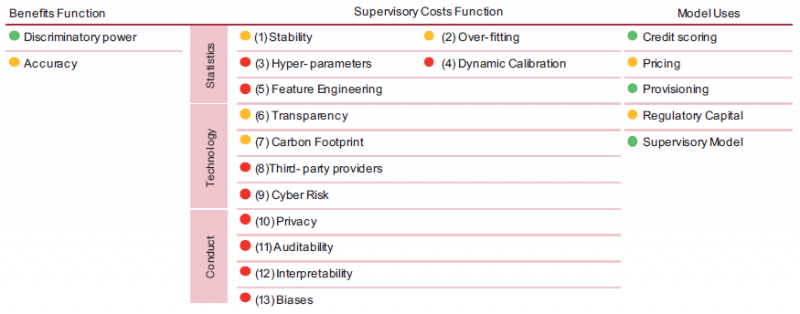
Finally, we must reinforce the fact that the risk-adjustment will depend on the model’s use. For instance, accuracy and stability of predictions may be a very important input to pass the supervisory test on regulatory capital, yet classification power without over-fitting will be a priority for creating a credit scoring rule. Similarly, the control of biases will be less important in the computation of regulatory capital, but a very sensitive issue in credit scoring.
We also assign traffic lights depending on the perceived improvement that ML may entail as per the literature review in each of these uses. We group them in four possible categories: credit scoring, computation of prices for credit operations (pricing), calculation of provisions, and calculation of minimum capital requirements (regulatory capital).14
As an illustrative example, in order to compare more clearly between ML models, we propose to run an exercise to check the discriminatory power of different ML models using the same database. Specifically, we use a database available for free at Kaggle.com, called “Give me some credit“.15 It contains data on 120,000 granted loans.
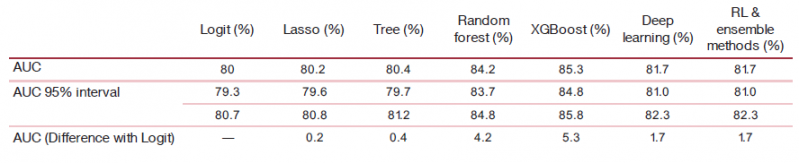
We measure the discriminatory power through the AUC-ROC, and the models that we will use are the ones that appear most frequently in the academic literature on credit risk: penalized logistic regression via Lasso, decision tree, random forest, XGBoost, and deep neural network.16 We compare the results of these models in terms of AUC-ROC with those obtained with a logistic regression (Logit).
The results can be found in Table 2. Although this particular ranking among ML models may change when using other databases, our exercise provides a quantification of the prediction gains that will assist us in our challenge to adjust the statistical performance by the perceived models’ risk.
Table 2. Results of the estimated AUC-ROC using the Give Me Some Credit dataset.
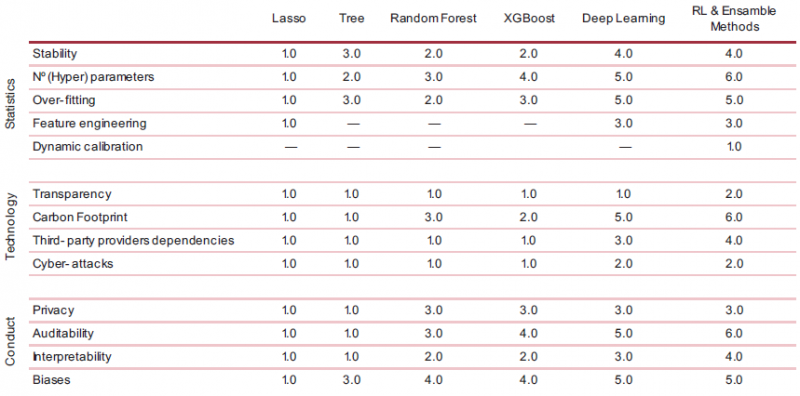
In Table 1 we identified 13 factors that influence the compatibility of ML techniques with the validation of statistical models based on the IRB approach. Now we propose a methodology to measure the supervisory risk of each of the six aforementioned ML models, which will depend on these 13 factors, based on the regulatory requirements for each purpose of the model. To quantify this adjustment, we suggest to fill in a scorecard in two phases. First, for each of the 13 identified factors, we order the ML models according to their relative risk. In our case, by using six different models, we establish an ordinal numbering ranging from 1 to 6, where 6 is the highest level of risk perceived by the supervisor in the case of approving the model. This first phase will require a structural assessment of each ML technique,17 regardless of the model’s use, in order to rank the models based on technical issues intrinsic to each model. In Table 3 we present a proposal for valuing the six ML models across all 13 factors, strictly based on expert judgement.18
Table 3. Scorecard Phase 1: “The algorithmic black-box”
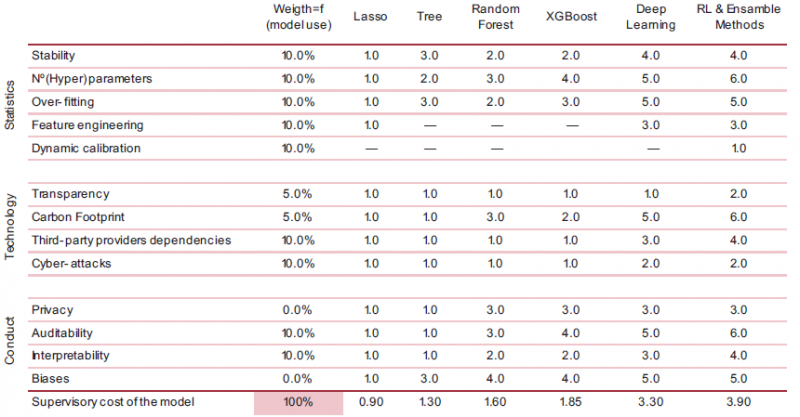
Once we have ranked the ML models for each factor, the second phase of the scorecard begins, where the supervisor weights the importance of each factor according to the regulatory requirements depending on the use given to the model.19 Therefore, the factors will be weighted between 0% and 100% depending on the use of the model to be assessed, as well as the supervisor’s own risk tolerance. The composition of both quantifications will thus allow us to obtain a global metric of the supervisory risk for each ML model, as shown in Table 4. We can define the supervisory risk R of model i for use j, as follows:
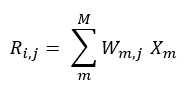
Where X represent each of the M factors (13 factors in total) and Wm,j represents the weight for factor m in use j.
Table 4. Scorecard Phase 2: The supervisor’s assessment
The construction of the supervisory risk is a multidisciplinary task, which aims to quantify supervisors’ assessment in order to comply with the regulation. While expert knowledge of statistics and technology is required in the first phase to open the algorithmic black-box, an in-depth understanding of financial supervision will be key in the second phase to break down the supervisor’s preferences or needs. Our scorecard offers a methodology to build this supervisory risk function, allowing the supervisor to provide the credit institutions with an assessment of the ML models in a standardized format. This way the dialogue with the industry can be enriched and transparency increased.20
In Graph 2 we compare the risks and returns by displaying, for each of the four possible ML model uses, the supervisory risk (horizontal axis) and the performance in terms of AUC with respect to Logit (vertical axis) of each of the six ML models: lasso, tree, random forest, XGBoost, deep learning, reinforcement learning and other methods.
Graph 2. Dilemma prediction vs risk, by model use.
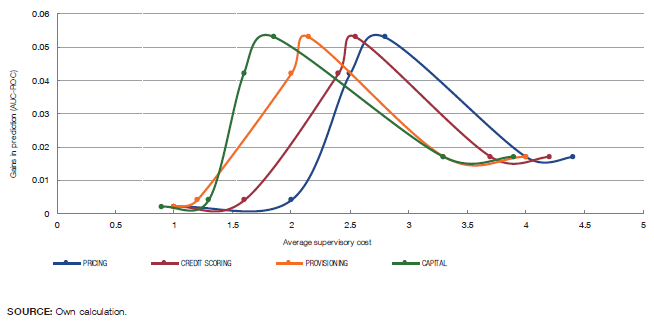
We find that Random forest and XGBoost achieve the best balance between risks and benefits. Specifically, the perceived risk for the XGBoost model applied for regulatory capital has a score of 1.85, while for pricing the XGBoost’s score is 2.80, considerably extending the distance compared to Logit. This is because pricing is a scenario where greater flexibility is required, but more restrictions exist around interpretability and biases when setting the price of new loans. Similarly, for regulatory capital the distance between a deep neural network and XGBoost in terms of cost is greater due to the weight given to the statistical requirements that would favor simpler models which might be more stable. In general, distances observed in our exercise between the risk of the models and their benefits coincide with the level of implementation observed in the industry (see IIF 2019a). The uses of more advanced models such as deep neural networks are a better match for fields such as the credit scoring and pricing where there is a lower relative requirements in statistical terms, despite higher ones in terms of market conduct. In this regard, the most advanced models would be perceived in these fields as more expensive, but given their higher performance in terms of predictive gains, they would be more attractive to institutions.
To understand the challenges that financial institutions and supervisors must face when implementing ML models in credit risk management, we propose to capitalize on the IRB system validation process to develop a framework that might assist on the identification of the risk factors embedded in these models. While using the IRB approach is limited to regulatory capital, it has an impact on other potential uses, and it is also well defined and underpinned by three pillars: statistical, technological and market conduct aspects related to the institutions. Consequently, IRB could serve as a general environment to manage the use of ML techniques in credit risk. The results of this exercise point in the same direction as the literature. We find that the improvements in terms of discriminatory power do not necessarily increase as algorithm complexity increases. Moreover, risk-adjusted performance differs depending on the use of the model. In short, the evolution of ML in the credit sector must take into account the risks embedded in the models (e.g: interpretability, latency, biases, etc). In this regard, financial authorities, such as the Basel Committee, are working on understanding these dilemmas in order to establish a framework for the appropriate use of this technology in the provision of financial services.
Institute of International Finance (2019a). “Machine learning in credit risk.”
See Bank of England (2019a). “Machine learning in UK financial services”.
See European Banking Authority (2017c). “Report on innovative uses of consumer data by financial institutions.” and European Banking Authority (2018). “Report on the Prudential Risks and Opportunities arising for Institutions from Fintech”. See also Eccles et al (2020). “The impact of machine learning and big data on credit markets”, September.
See Fernández, Ana (2019). “Inteligencia artificial en los servicios financieros”. Boletín Ecónomic0 2/ 2019. Banco de España.
In all the papers analysed the target variable to predict is the probability of default (PD) of loans (mortgages, retail exposures, corporate loans, or a mixture thereof). In order to assess robustly the results obtained from different models and samples, we have compared classification power using the Area Under the Curve – Receiver Operating Characteristic (AUC-ROC) metric, out-of-sample.
See all the references in Alonso and Carbó (2020) “Machine Learning in Credit Risk: the Dilemma between Prediction and Supervisory Cost”. Banco de España. Working Papers Series, 2032.
For comparison reasons we solely aimed to illustrate the changes in the “structural” algorithmic complexity, in terms of ability to adapt to non-linear, highly dimensional problems. Therefore, changes to this rank could be considered depending on the set of parameters and hyper-parameters considered in each model.
For a more detailed analysis of the benefits of ML, see Alonso and Carbó (2020) “Understanding the performance of machine learning models to predict credit default: a novel approach for supervisory evaluation”. Banco de España. Forthcoming. Working Papers Series.
Dupont et al (2020). “Governance of Artificial Intelligence in Finance”. Banque de France. Fintech Innovation Hub, ACPR, June.
See Institute of International Finance (2019b). “Machine Learning: recommendations for policymakers”.
Article CRE36.60 of the Basel general framework requires that models under the IRB approach be used in the management of the institution’s business, requiring alignment between IRB systems and the risk factors used internally in any other field, such as credit scoring, internal risk management or corporate governance.
All the remaining risk factors (i.e. LGD, maturity adjustments and credit conversion factors) are defined in the regulation, depending on the type of underlying credit exposure.
C.f. footnote 7.
To this end, we disregard the potential use of ML techniques to build a master model by the supervisor to assist with the benchmarking task.
The ML models have been estimated with Python and open access libraries such as Sklearn and Keras.
For a deeper insight into the functioning of these predictive models, please see World Bank (2019) “Credit Scoring Approaches Guidelines”.
It can be carried out by a professional analyst or technician with a quantitative profile, such as an ML engineer, data scientist, or advanced analytics expert.
As we mentioned above, we can order the 13 factors identified above through the IRB scheme into three “supervisory” blocks, such as (i) statistics, (ii) technology and (iii) market conduct.
For example, biases will matter more if the purpose of the model is to grant credit, but less if the purpose is the computation of provisions.
There have been previous attempts to identify the factors that influence the supervisory process of ML models, such as Dupont et al (2020). While they list the most relevant factors (such as stability, technological cost, calibration, etc.), they do not provide rules to understand them under the supervisory framework, or a way of quantifying them in terms the cost to evaluate the models.