The topic of ethical implications of the exploding applications of big data, machine learning and genuine AI has quickly captured the attention of industry practitioners, public observers like journalists, politicians and definitely conference organisers over the past year. It is a vast topic in its own right, deserving all the multidisciplinary attention it gets. In this short commentary, I will limit myself to reviewing some salient features of bias in the context of models used in the financial industry, and, more importantly for the practitioner, suggest some process and governance measures that boards and senior management of financial services companies can take to identify, monitor and mitigate this risk exposure.
Getting our vocabulary right: Distinction between Big Data, Machine Learning, AI, Intelligent AutomationThere are a couple of distinctions between concepts that are worth re-iterating, as currently the ethical dilemmas linked to self driving cars, or autonomous weapons are often extrapolated to more mundane applications. That does not mean however that vigilance is not warranted in these relatively simpler applications. The last two years, we have started talking almost exclusively about AI. This is often the wrong word. A lot of what we talk about is not complex mathematically nor AI. It is just what three or four years ago, we would have called Big Data. It is the fact that new types of information are becoming available or are already available in unseen quantities. Examples include such things as data from trajectory control on the highway, real time tracking in commercial shipping activity, social network information, … Yes, there is some AI used to read the license plate or to translate the satellite images in usable information, but once that is done there is just new monitoring, new types of data that can be used. A big part of the value for Financial Risk Management purposes sits here. Access to new information that gives new insights in the behaviour of individual economic agents, or aggregates and networks of them. Next, there is predictive analytics or machine learning. There are huge collections of books with “new” models, more complex mathematical models to exploit this big data. New does not mean that they were invented recently. In fact, they are mostly between 20 and 40 years old, but the availability of reliable implementations in some open source environments, combined with computing infrastructure and computing power, make that modelers can more readily try them out than 10 years ago. It is worth distinguishing the added value of new data and of new algorithms. A simple model (like a logistic regression, the workhorse of credit default modelling) combined with the available big data probably gets you a big part of the upside, before trying more complex mathematical approaches like gradient boosted trees. Artificial Intelligence includes predictive analytics but is in the popular mind more associated with chatbots, image and text recognition, measurement analysis, automated signal modelling, self driving cars, … AI is characterised by a combination of a learning algorithm, a high degree of automation and reliance on (big) data, with the purpose of mimicking human cognition or behaviour. When these applications of AI are combined with RPA (Robotics Process Automation), one often talks about Intelligent Automation. This paper will mostly be concerned with the first two categories. |
The societal impact of AI is increasingly a worry and a topic of debate. Let us consider a few examples to set the scene, inspired by the US where there is already more literature about the topic. The investigative journalism website ‘Pro Publica’2 runs a quite interesting series on the impact of algorithms on citizens’ and consumers’ life. One of the studies claims – and this drives it home for financial institutions – they “found that some insurers were charging statistically significantly higher premiums in predominantly minority zip codes, on average, than in similarly risky non-minority zip codes”. On May 23rd 2016 they published an article with as tagline “There’s software used across the country to predict future criminals. And it’s biased against blacks.” This article triggered broad controversy and led to research highlighting that different natural candidates for fairness conditions to calibrate a model to, are mathematically speaking not compatible. More on this below. There is also an increasing body of books on the topic. It is worth singling out two, namely Weapons of Math Destruction by Cathy O’Neill, and The age of surveillance capitalism by Shoshana Zuboff. The former is more descriptive in nature, covering cases similar to those mentioned above, but also in financial lending and the job search market. The latter is a robust academic study, diving deeper into the cultural and moral aspects of how data collected give an ever more precise understanding of who we are.
That the cultural and broader societal context plays a role, is exemplified by contrasting the evolutions in the West with those in China. It takes a totally different approach, amongst others experimenting with the introduction of a social credit score, where in function of measurable aspects of your social behaviour you get a different score. One of the risk related observations, is that if in your circle of friends, somebody defaults, in fact your own credit risk is considered higher. So, it is sort of guilty by association. In a conversation with a credit risk expert-banker quite recently, I was told: “True, that is often a very good indication of risk, but we cannot use it.” One wonders whether the fact that that type of information is available, and if it really proves to be of predictive value, will not lead to shifting practices in Europe too over time.
In April 2019, the High-Level Expert Group on Artificial Intelligence, set up by the European Commission, published “Ethics Guidelines for Trustworthy AI”3. Next to reflecting a huge ongoing discussion in the broad community on the subject matter and how to approach it, it is also a clear and broadly supported attempt to make an ethical approach to AI to be a defining characteristic of the AI industry in Europe, as a third way next to the American and Chinese approach. Basically, the guidelines set out three ingredients of trustworthy AI. Above all, (i) AI must be lawful, i.e. all applicable laws and regulations should be complied with. That means for the financial industry for instance laws on consumer credit, GDPR, MIFID, to name just a few, where a connection with modelling is easily made. Next there is the requirement for (ii) AI to be robust. This includes a technical perspective (e.g. be secure against a cyber-attack, data leakage etc.) and a social perspective (e.g. no unintended changing of behaviour through feedback loops or training effects). Finally, (iii) AI should adhere to ethical principles and values, including fairness and explicability. It is in particular around the notion of fairness that we present some observations below.
Beyond setting out these three high level areas, the guidelines propose a (self) assessment checklist for broad adoption to allow companies to evidence that they adhere to principles of trustworthy AI.
We now present a few findings from the literature, that shed some light on the underlying modelling challenges when addressing the question of bias in reality and in models. The most important salient points are that it is quite difficult to demonstrate statistically beyond reasonable doubt that there is bias in behaviours or models, and, more challenging even, that there are different ways of making adjustments to the models that envisage to counter bias, but that these are mathematically mutually exclusive.
The first paper started from a dataset about red cards in soccer, real world data. Twentynine (29) academic teams all addressed the question: “Is there racist bias in the way referees give red cards on the pitch?”4. In other words, a case study on whether it is possible to conclude in a statistically robust way, whether there is bias in behaviours (or, mutatis mutandis, in model outcome). Moreover, there are no commercial aspects to the setting that could create incentives for the modelers/analysts: all participants were academic (teams), all equally savvy scientists with healthy doses of professional scepticism.
So, you do not expect bias from that perspective to creep into the analysis. About 1/3 of the teams said they found no bias, while 2/3 said there is conclusive evidence for bias in the red card data. The outcome of each individual team is clearly influenced by the model/machine learning approach adopted by the teams. Different models gave different outcomes. Perhaps more strikingly even, is that from a dataset with 20-30 features, all teams used different explanatory variables except for one common factor they all incorporated in their analysis. When they aggregated all the analyses4, in fact, they did conclude that there is some sort of bias there. However, when confronted with this collective result, all the researchers were very careful to say: ‘We may measure bias, but the model does not tell us whether this is due to the referee’s intent or something else.’ Interpreting this result from a purely legal perspective, one could conclude that the risk (for pure algorithm-based decisions) is more to be found in being drawn into a resource consuming court case and out of court settlement, rather than in an actual conviction. Of course, the reputational damage that precedes and accompanies such legal procedures when they are in the public domain, is harmful enough in its own right.
As an aside, the paper offers an example on how to proceed should one have the luxury to have different teams to build models in parallel. We highlight the steps in the appendix A. Actually, this might be an alternative worth considering to the classical model validation set up in banks and insurance undertakings. Rather than have the validators sequentially in time review a fully complete model, why not have them build simultaneously an alternative challenger model, and allow both teams on an ongoing basis to learn from each other’s experience as they go along?
The second paper6, offers an example of how feedback loops triggered by the model-based decisions, but that are themselves not part of the mathematical model design considerations, can create unintended consequences. Consider the usage of a scorecard to grant consumer credit to a population of blue and green dwarfs. Historically, the blue dwarfs are financially stronger than the green ones. It would not be uncommon for the bank to calibrate the threshold on the scorecard in such a way that it optimizes its profit on the entire population. Profit is of course only made on those clients that actually get a loan, and depends on whether the model correctly predicted their creditworthiness (TruePositives – TP) or not (FalsePositives – FP)7:
Profit = TruePositives ⁎ Margin – FalsePositives ⁎ Loss
However, from a society perspective, the FP present an extra problem. In many legal settings it would be morally unacceptable to provide credit to those that cannot afford it. When you provide credit to a green dwarf, it could use the credit to stabilize its situation or even improve it by investing e.g. in equipment, allowing it to pay back on time and improve its overall creditworthiness track record. The green dwarf evolves ever so slightly into a blue one. Alternatively, it can spend the money on consumables, default on the loan, and sink deeper into the debt trap (i.e. become darker green). A second “social profit” could hence be considered, subtracting from the improvement in creditworthiness of the TP, the deterioration of the (future) credit score of the FP. The optimal for this “social profit” will likely not coincide with the optimum of the economic profit curve. The authors of the paper call a calibration of the model that maximizes the social profit, an “altruistic calibration”, as it likely does not coincide with the financial profit maximizing calibration. In my interpretation of the EU Ethics Guidelines, it is this sort of potential unintended consequences that it wants institutions to be aware of.
The consideration of the extra dimension of the social profit also gives the first window on the difficulty of defining what technically characterizes fair lending practice. Among the things the bank could do to be able to evidence that its practices are fair, one can for example think of:
Notice that the remedies often entail the need to segment the population. In practice this often hits upon two difficulties. In this example, the dwarfs have an easily discernible color, blue or green. In reality, creating segments on the basis of such things as similar risk profiles or behavioural features is hideously difficult. Next to that, even if a clear cut label is available (think in real life of gender, religion, ethnicity, …), one may not be allowed to use such feature in the model, or even keep it on file.
The third paper8 is actually a blog and gives a commentary on some recent research on the mathematical characteristics of unbiased models. It starts from the case referred to in the introduction, where Pro Publica showed the presence of bias in decisions supported by models in the American judicial system. More analysis of this example in a broader context, can be found in a study from the European Parliamentary Research Service9. The key takeaway is that while one can imagine different definitions of fairness and impose them during the model calibration, they are not necessarily mutually consistent, i.e. one has to make a choice and go for it.
We will list here some of these potential definitions of absence of bias. We detail them further in the appendix and demonstrate why they are not consistent under all circumstances. But first we must define the notation. Consider 3 random variables, that for the sake of the analysis we consider to be binary variables:
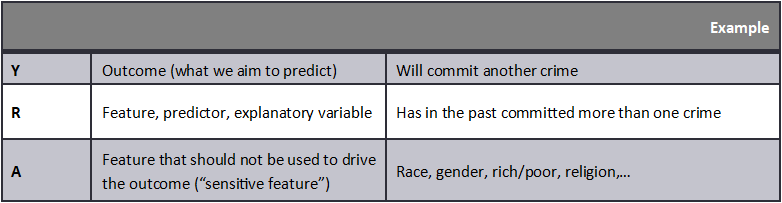
With this notation set, one can consider different ways to translate the general notion of absence of bias on the basis of A, in a mathematical expression.
In particular, the company challenged by Pro Publica, evidenced that its model was “well calibrated”, while the challenges themselves amounted to saying that the model did not have “equalized odds”. This triggered a flurry of research activity, uncovering a.o. that these two are not necessarily compatible.
So, where does all the above leave us when it comes to taking the necessary precautions to protect the organization against the bias risk? Overall, it seems not likely that questions of bias through modeling will quickly be tested in court, given the complexity of the underlying mathematical questions and hence the challenge to bridge the gap from the modeling to the legal domain. Moreover, as the case of the red cards illustrates, it is difficult to conclusively show using one modeling approach only, whether there is bias or not, let alone intent. Rather, the risk (for financial institutions) lies with hits on the reputation of the institution, where allegations in the public domain are equally difficult to refute given the intrinsic complexity of the arguments. It is therefore important to have a process in place to identify and monitor potential biases, and to be ready to communicate in readily understandable terms to a broad public in case of challenge.
A relatively simple precautionary measure starts with risk identification. In what businesses/products does the institution use algorithms to make or support decisions that impact individuals (profiling)? (model inventory)
For each of these algorithm/application pairs, what are the actual bias risks (legal or other) that the institution should avoid? Are there any incentives that are being created for the clients subject to the algorithm’s outcome, that could influence their behaviour (e.g. take more credit than they can afford, invest/trade more aggressively than they would otherwise, buy cover through insurance they don’t actually need, …)? (risk identification). Notice that these feedback loops fall under the category conduct risk that is so much in focus in the financial industry the last few years.
For each of these, what would be relevant statistics to track, that allow to detect any unwanted biases or behaviours? One approach is to compute the different probabilities discussed above, and check to what extent demographic parity, equalized odds and well calibrated actually hold. The extent of the deviation of these conditions, can be an indicator for the risk of being perceived as biased, and can hence help identify when corrective action is needed. (risk monitoring)
Notice that this might often entail defining segments of clients, which is difficult in its own right. Unlike the dwarfs, the different client categories may not be easily identified based on their colour. Moreover, in fact, it may require using the features (gender, religion, sexual orientation, …) that you do not want to use or may legally not be allowed to keep on record in the first place (forbidden variables). One way to address this challenge is to use synthetic data sets, rather than real world ones. Mystery shopping in the algorithmic, digitalized financial institution!
The results of the monitoring should be reported to the senior management and the board, such that these governance bodies can assess whether the bias risk remains within the limits of risk appetite.
The above steps are in fact just the application of the standard components of model risk management to this specific type of model related risk.
Maybe detecting bias in algorithms is in fact the wrong question. Machine Learning applications can be classified in two groups roughly. On the one hand, there is the automation at volume of standard tasks human operators are good at, such as recognizing objects in pictures or reading documents. On the other hand, there is a variety of activities, often judgement calls, human experts have historically been doing, but where they are not necessarily flawless in either, including assessing credit risk or the likelihood that a job applicant will fit the firm. This expert or human judgement is equally subject to bias.In fact, the bias that appears in models is often due to the bias present in datasets reflecting the historical track record of such experts. And while the risk of bias may have been equally present in the past with those human operators, it was definitely not standard practice to measure and monitor the behaviour of the expert assessors in this context.
So, the really innovative approach probably will involve something along the following lines. Algorithms are not positioned to replace human operators (although that is the goal in STP digital lending programs) but are rather positioned as peers to the human operators, creating a feedback loop that in itself over time protects against bias. Consider a setting where loan applications below a certain amount are fully automated, while above a certain amount (big tickets), both the human expert and the algorithm have a say. One could imagine the following control environment:
− Modify historical datasets10 that reflect past expert judgements to eliminate bias from the past. I.e. create synthetic data sets that have all the characteristics, except the one you want to correct for. Train a second version of the scoring algorithm on this dataset.
− For big tickets, used this “de-biased” version of the algorithm to challenge the expert judgement decisions. This can potentially prevent bias by the experts and will also trigger continued control of the algorithm itself.
− For the fully automated segment of the applications, take a sample of applications on a regular basis, and have them independently re-scored by the expert analyst. Do a root cause analysis to understand discrepancies.
One often hears the idea articulated that combining the algorithm-based judgement with the expert judgement likely leads to better discriminatory power overall. Of course, this will be more effective if the algorithm provides “explainable results”, i.e. if human operators can understand why the model came to a specific conclusion. This is the reason why model transparency is another hot topic currently. The override in the credit rating process may historically already have created the beginnings of such a dynamic, but it seems the time is ripe to make it more structured and ubiquitous. However, this would of course eliminate some of the operational benefit from smart automation, so striking the right balance is, as always, key.
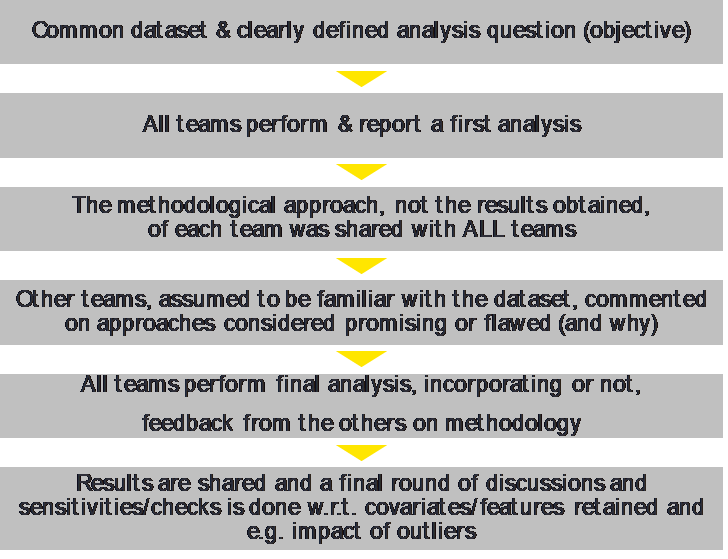
The paper on red cards in soccer, proceeded as follows in guiding the different research teams through the analysis. Along the way, they also observed the dynamic this created among the modelling teams and commented on that.
In this appendix we first define the different fairness criteria more precisely in mathematical terms. Subsequently, we show that “well calibrated” and “equalized odds” calibration do not necessarily hold simultaneously, and we derive the correction factors.
P(Y = 1|A = 0) = P(Y = 1|A = 1) = P(Y = 1)
For example, the probability of getting your loan request approved (Y = 1), is the same for men (A = 0) or women (A = 1), irrespective of the value of R, the risk indicator.
P(R = 1|A = 0; Y = 1) = P (R = 1|A = 1; Y = 1) = P (R = 1|Y = 1)
Notice that this implies independence of A & R on that population with Y=1:
P(R = 1 & A = x|Y = 1) = P(R = 1|A = x; Y = 1). P(A = x|Y = 1) = P(R = 1|Y = 1). P(A = x|Y = 1)
P(Y = 1|A = 0; R = 1) = P(Y = 1|A = 1;R = 1) = P(Y = 1|R = 1)
Notice that this is a condition similar to demographic parity, but on the subset for which the feature is present R = 1.
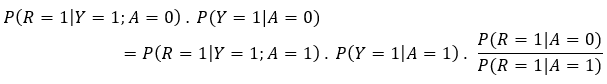
Assume “Well Calibrated” holds and apply Bayes’ rule several times. Before doing so, multiply both sides with the appropriate conditional probabilities:
P(Y = 1|A = 0; R = 1) = P(Y = 1|A = 1; R = 1),
![]()
Bayes’ theorem allows then to obtain joint probabilities for Y & R:
![]()
Now go through the same steps but in the reverse,
to finally end up with the corrective factors to the “Equalized Odds” equation:
![]()
Notice that these corrective factors reflect the relative occurrence of the outcome (Y) and the predictor (R) in the two segments. These probabilities in the calibration sample can be different for objective reasons, but also because in the historical data set that is used, bias is present.
This article by Frank De Jonghe was first published in The Revue Bancaire et Financière 2019/5.
https://www.propublica.org/series/machine-bias. Last visited July 13th, 2019.
https://ec.europa.eu/digital-single-market/en/news/ethics-guidelines-trustworthy-ai. Last visited July 16th, 2019.
“Many analysts, one dataset: Making transparent how variations in analytical choices affect results”; Silberzahn, Uhlmann, Nosek et (many) all (2015). A summary of the key messages by Silberzahn, Uhlmann can be found in Nature, October 2015, VOL 526, p189.
Bear in mind that such aggregation is a delicate exercise in its own right, as the results obtained in different modeling approaches need to be translated to a common measure of bias and same level of statistical significance to state the conclusion.
“Delayed Impact of Fair Machine Learning”; L.T. Liu, S. Dean, E. Rolf, M. Simchowitz and M. Hardt (Berkeley Artificial Intelligence Research – BAIR). https://bair.berkeley.edu/blog/2018/05/17/delayed-impact/. Last visited July 26th, 2019.
Notice that I used here a convention different from a classical credit scoring setting. A positive here means that the institution grants the loan, because it expects to be paid back in full. So we model reimbursement, not default.
“Handling Discriminatory Biases in Data for Machine Learning”; a blogpost on towardsdatascience.com by Matthew Stewart (and papers it is based on). https://towardsdatascience.com/machine-learning-and-discrimination-2ed1a8b01038. Last visited July 28th 2019.
“A governance framework for algorithmic accountability and transparency”, EPRS PE 624.262 April 2019, p17. http://www.europarl.europa.eu/RegData/etudes/STUD/2019/624262/EPRS_STU(2019)624262_EN.pdf. Last visited July 29th 2019.
As a risk manager, I’m quite uneasy about the idea of modifying historical datasets, as it feels like giving up the only certainty one has.