We estimate indicators of aggregate demand and supply conditions in the United States and in the euro area based on factor models for inflation and real activity. We identify demand and supply factors by imposing theoretically motivated sign restrictions on factor loadings. The estimates provide a narrative of the evolution of the stance of demand and supply over time. The analysis indicates that the inflation surge since mid-2021 was driven by a combination of strong demand and tight supply.
Over the past year, inflation has in many countries surged to levels not seen since the 1970s. To what extent the surge has been driven by demand or supply is a key question for the calibration of monetary and fiscal policy. In the former case, policies should be relentlessly tightened, while in the latter case there would be tricky policy trade-offs.
Disentangling demand and supply factors driving inflation has often been a major challenge for monetary policy. This is also the case currently, as there are different views on the relative role of demand and supply in the inflation surge since 2021. In Eickmeier and Hofmann (2023), we take a novel approach to estimate aggregate demand and supply factors based on a factor model.
We use a factor model for inflation and real activity to identify demand and supply factors. We estimate factors based on a principal component analysis and then rotate the factors to identify supply and demand using sign restrictions imposed on factor loadings.
The sign restrictions are based on a standard supply and demand framework, where changes in supply move inflation and output in opposite directions, while changes in demand move both variables in the same direction. Supply expansions would boost output and dampen inflation, while demand expansions would boost both inflation and output. Hence, we assume that real activity measures load positively and inflation measures load negatively on the supply factor, while both real activity and inflation measures are assumed to load positively on the demand factor.
The analysis for the United States uses a database comprising 140 quarterly inflation and real activity series going back as far as 1970. The estimated factors, shown in Figure 1, provide a narrative of the evolution of the stance of demand and supply over the past five decades. In the following we focus on a number of key episodes, including the recent inflation surge.
Figure 1: Demand and supply conditions in the United States
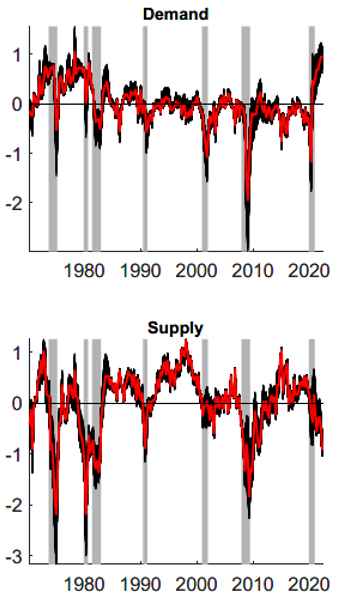
Notes: In percentage points. Red: Median Target estimates, black: estimates from all models. Grey bars: NBER recession dates. See Eickmeier and Hofmann (2023) for details.
We find that the Great Inflation of the 1970s was characterised by persistently strong demand and episodically tight supply conditions related to the oil price shocks. Excess demand was eliminated in the wake of the Volcker disinflation in the early 1980s while supply conditions eased only later, after the 1981–82 recession when oil prices receded sharply.
The Great Recession in the wake of the Great Financial Crisis of 2007–2009 was associated with a strong
contraction in both demand and supply. The post-crisis years were then characterised by subdued demand and supply conditions, with demand initially rebounding faster than supply. This would explain why the recession was not associated with a stronger decline in inflation, referred to as the missing disinflation. From 2013 up to the outbreak of the Covid-19 pandemic in 2020, supply conditions strengthened, while demand conditions were mostly subdued. This suggests that a combination of strong supply and weak demand drove persistent low inflation over these years.
The Covid-19 recession in 2020 was associated with a steep fall in demand but also with tighter supply conditions. In 2021, demand conditions started to rebound sharply in the wake of catch-up demand effects as well as extraordinary monetary and fiscal policy easing. By contrast, supply conditions further tightened as supply bottleneck persisted and energy prices surged in the wake of the Russia-Ukraine war. In 2022Q2, the last observation of our sample period, estimated demand conditions reached the highest level on record, even higher than the levels seen in the 1970s, while supply conditions remained tight.
A historical decomposition quantifying the respective contribution of demand and supply factors to inflation outcomes suggests that the inflation surge since 2021 was driven by both demand and supply, reflecting the strong upsurge in demand and the tightening of supply conditions (Figure 2). Quantitatively, demand seems to have played a somewhat larger role than supply.
Figure 2: Historical decomposition of U.S. CPI inflation
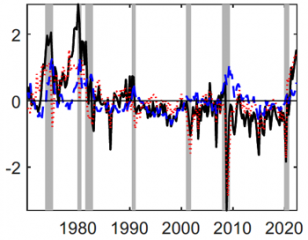
Notes: Quarter-on-quarter, in %. Black: demeaned time series. Red: contributions of the Medan Target demand factor. Blue: contributions of the Median Target supply factor. Grey bars: NBER recession dates. See Eickmeier and Hofmann (2023) for details.
These results hold up in a large number of robustness checks. In particular, we perform a real-time analysis, i.e. we re-estimate the factors over samples with different endpoints. It turns out that the factors barely change as more data are added to the analysis. This suggests that the factors are good indicators in real time so that they could be used in regular policy analysis.
We estimate euro-area demand and supply factors using a quarterly database covering the period 1999Q1 – 2022Q2. The euro-area database comprises data on various measures of inflation and economic activity for the four major euro-area countries (France, Germany, Italy, Spain) as well as for the euro area as a whole.
Figure 3: Demand and supply conditions in the euro area
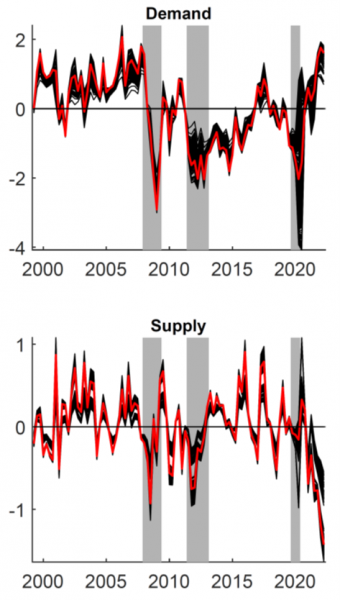
Notes: In percentage points. Red: Median Target estimates, black: estimates from all models. Grey bars: CEPR recession dates. See Eickmeier and Hofmann (2023) for details.
The results give a similar picture of the evolution of demand and supply conditions over the past two decades as in the United States. In particular, for the inflation surge since 2021, our estimates suggest that also in the euro-area countries strong demand coincided with tight supply. However, in comparison to the estimates for the United States, there seems to be a greater role of tight supply. The last estimates for 2022Q2 indicate that euro area demand conditions were at similar levels as in the mid-2000s, while supply conditions were at the tightest level measured over the sample period.
Eickmeier, Sandra and Boris Hofmann (2023), “What drives inflation? Disentangling demand and supply factors”, CEPR Discussion Paper 18378.