Sources: ETF balance sheets, EDINET.
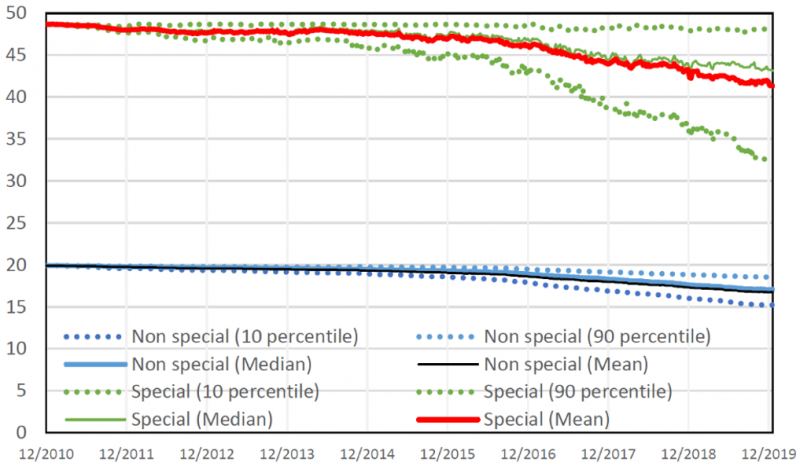
Note: Based on the estimation results in Katagiri, Shino and Takahashi (2023), the blue and black solid lines indicate the median and mean of the marginal effects of an ETF purchase on weekly stock returns for non-special stocks, respectively, while the dotted blue lines indicate their 10th and 90th percentiles. Similarly, the green and red solid lines indicate the median and mean of the marginal effects of the purchase on stock returns for special stocks, respectively, while the dotted green lines indicate their 10th and 90th percentiles. It shows that the average marginal effects for special stocks have declined over time, while those for non-special stocks have remained almost unchanged. Sources: Estimation results in Katagiri, Shino and Takahashi (2023).