We propose a new measure of underlying inflation based on a regime-switching framework estimated on disaggregated sub-components of the euro area HICP (Harmonized Index of Consumer Prices). Given its inherent nonlinearity, our measure is able to shed some light on features of underlying inflation that have not been covered by existing measures. In particular, our measure is able to infer abrupt changes, and turning points, in underlying inflation. It can also be used to generate inferences on asymmetric risks associated with future inflation developments.
Underlying inflation is essentially an empirical concept –albeit some relations to structural macroeconomic models can be traced out–, which can be broadly defined as the persistent component in overall inflation. Typically, a number of alternative indicators of underlying inflation are simultaneously used in a given institution. The most traditional is the exclusion-base indicator “inflation excluding food and energy”, often labelled “core inflation”.1 In the case of the euro area, on which our empirical application focuses, Ehrmann et al. (2018) summarize the underlying inflation measures typically used at the ECB, emphasizing two recently developed model-based approaches. First, the so-called “super core” measure that is based on a subset of items of HICP inflation excluding energy and food that are deemed sensitive to slack. Second, the “Persistent and Common Component of Inflation” (PCCI) indicator, proposed by Bańbura and Bobeica (2020), that relies on factor models.
Model-based indicators of underlying inflation have been typically built upon the assumption of linearity in the dynamics of prices. In particular unobserved component models generally assume that the dynamics of underlying inflation follows a random walk, so that underlying inflation can only exhibit smooth changes over time. The recent abrupt surge in energy and raw material prices, and the subsequent rapid pass-through to other items in the consumption basket, however, challenge that assumption. In addition, several works emphasize the importance of accounting for nonlinearities and state-dependence when modelling inflation (e.g. Ascari and Haber (2022), Klenow and Kryvtsov (2008), Cavallo, Lippi and Miyahara (2023)).
Against this backdrop, Le Bihan, Leiva-León and Pacce (2023) rely on a multivariate regime-switching framework to estimate the persistent component of inflation at the disaggregated level.2 Unlike previous related approaches in the literature, each persistent component of interest is assumed to exhibit shifts between high- and low-inflation regimes of unique magnitudes.3 Figure 1 displays the estimated persistent component of euro area inflation at the disaggregated level, pointing to a substantial amount of heterogeneity both over time and across categories. The estimates show that the proposed framework is flexible enough to adapt to the wide variety of inflationary dynamics embedded in the different types of goods and services.
Figure 1: Persistent Component of HICP Special Aggregates
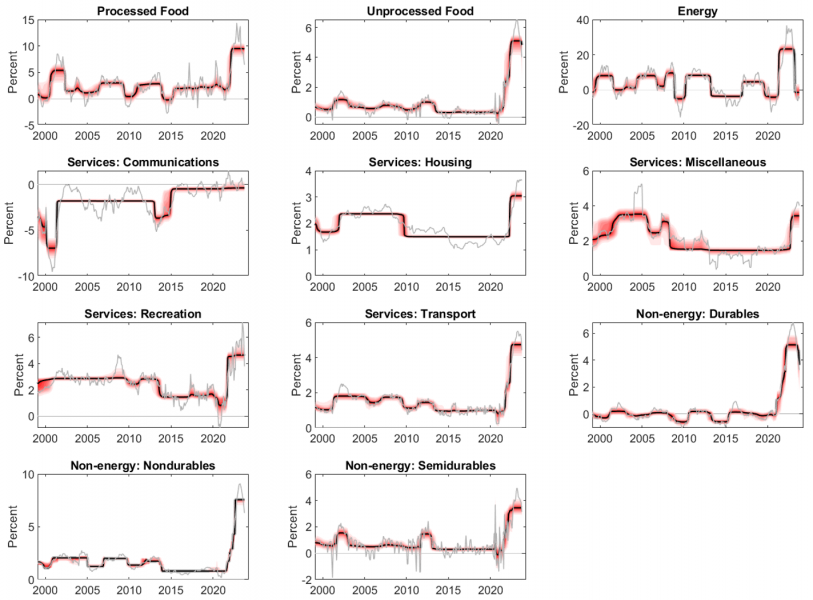
Note. The figure plots the persistent component of inflation associated with the different special aggregates of HICP. The persistent components are obtained with the proposed regime-switching model. The red area refers to the posterior density and the black lines its median. Each chart also plots the year-on-year growth rate of the corresponding sub-component price index for reference purposes (solid gray lines). The sample covers 1999:01-2023:09.
Given the flexible nonlinearity embedded in the proposed model, the estimated persistent component of some sub-aggregates of the HICP promptly reacts to recent unprecedented developments induced inter alia by the war in Ukraine. In particular, items “Non-energy: Durables”, “Non-energy: Nondurables” goods and “Unprocessed Food” exhibited dynamics consistent with a structural break in early 2022.
Consistent with underlying inflation being defined as the persistent component in overall inflation, by using the weights to construct the HICP, we summarize the persistent components associated with the various sub-aggregates into a single measure that constitutes our proposed nonlinear measure of underlying inflation. The resulting indicator is labeled “ICARIS”, that stands for Indicator of Core by Aggregating Regimes of Inflation Sub-components.
Chart A of Figure 2 plots our measure of core inflation for the period 1999:01-2023:09. The ICARIS is characterized by a strong persistence. This is an appealing feature as this underlying inflation measure is not influenced by erratic movements often displayed in the inflation rates of special aggregates. Despite its persistence, the ICARIS is able to rapidly adjust to new inflation environments. For example, this is the case when the euro area transitioned to a sustained period of low inflation over the course of 2013. When focusing on the post-pandemic period, the ICARIS suggests an abrupt and unprecedented jump in euro area underlying inflation, starting in early 2021, reaching its peak in December 2022 and rapidly falling until March 2023. Since then, underlying inflation has remained almost constant until the end of the sample, September 2023, displaying values close to 4.3%. This suggests, as also confirmed by examination of other indicators, that underlying inflation has passed a peak, even though it is still at level well above the ECB objective.4
A key advantage of the ICARIS is that it accounts for all sub-components of HICP, unlike exclusion measures of underlying inflation that omit information from energy and food categories – even though these two sub-components could play a relevant role in driving underlying inflationary pressures.5 This is particularly the case in the recent context. Chart B of Figure 2 plots the historical contribution of each HICP sub-component to the ICARIS, showing the prominent role of energy prices in driving underlying inflation between early 2021 and March 2023. It also shows that although energy prices are currently not contributing significantly to underlying inflation, the other sub-components of HICP ―in particular, food inflation― are still subject to persistently high inflationary pressures, as can be seen in Figure 1 at the end of the sample.
The recent dynamics exhibited by the ICARIS illustrate the nonlinear nature that underlying inflation might be subject to. The prompt signals provided by the ICARIS may also help policy makers and pundits when assessing the outlook of inflation and its underlying drivers.
Figure 2: Nonlinear Underlying Inflation
Chart A. Indicator of Core by Aggregating Regimes of Inflation Sub-components (ICARIS)
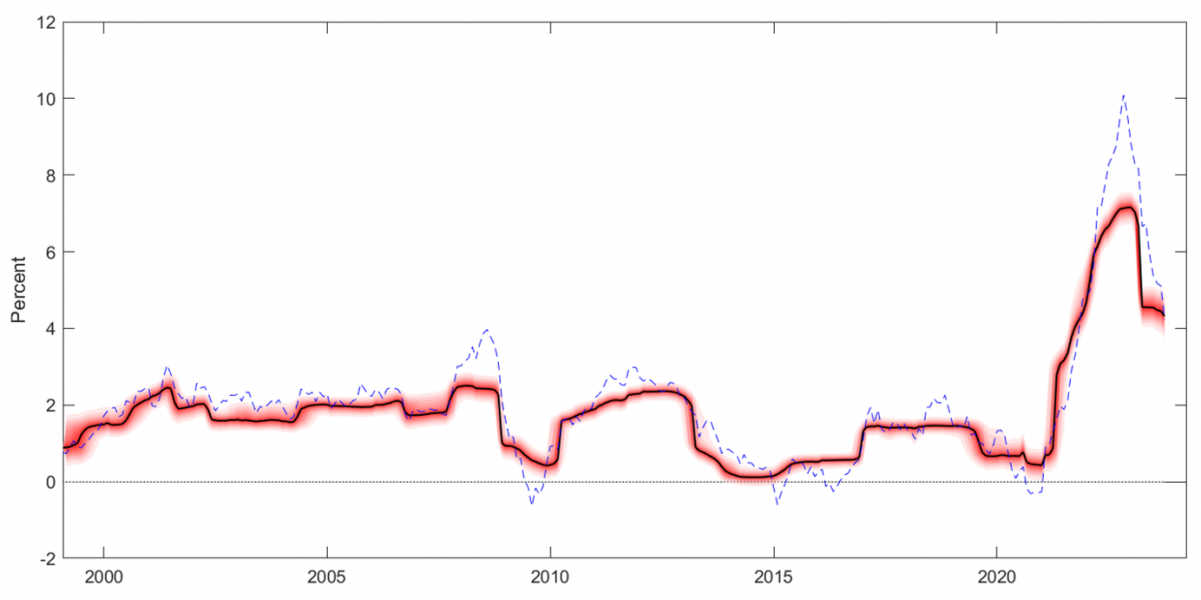
Chart B. Historical Decomposition
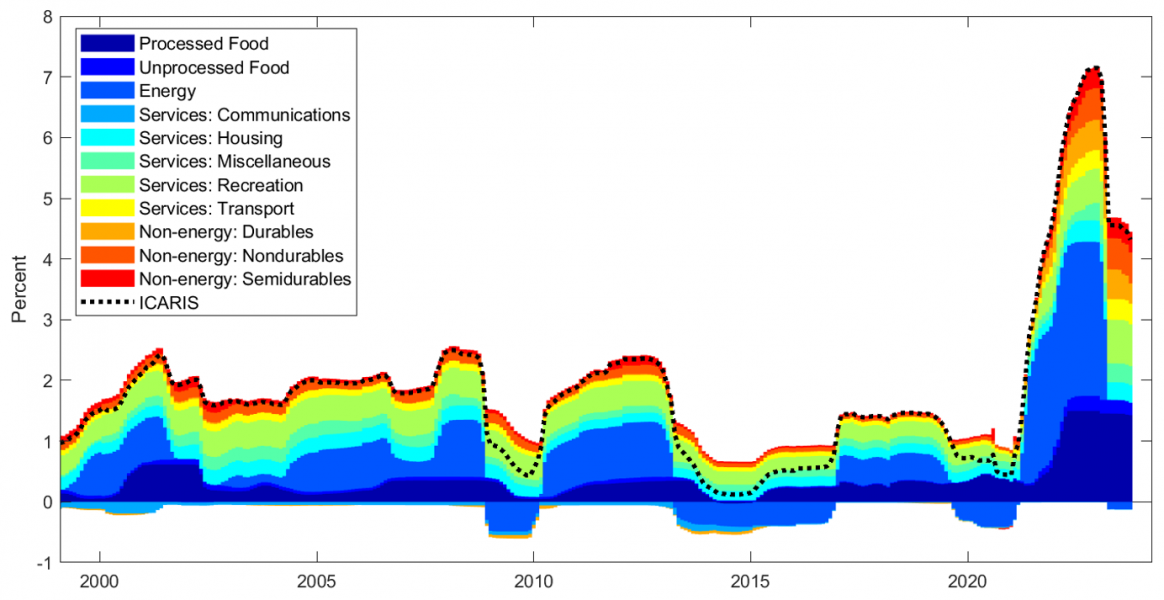
Note. Chart A plots the proposed measure of underlying inflation. The red area refers to its posterior density and the black line to its median. The ICARIS is obtained as a weighted average across the persistent components of inflation associated with the special aggregates of HICP. The HICP euro area inflation is also plotted with the dashed blue line, for reference purposes. Chart B shows the historical contribution of each special aggregate to the computation of the ICARIS. The sample covers 1999:01-2023:09.
By construction, non-model-based approaches such as exclusion-based measures (e.g. the trimmed means) do not come by themselves with an indication of the current short or medium term trend. Typical trend-cycle decompositions, while they are based on models able to generate forecasts, generally rely on a random walk process for trend inflation. Therefore, they are not particularly informative in that respect, as trend inflation is by construction expected to stay constant at any horizon. By contrast, the ICARIS can be also used to measure asymmetric tail risks associated with future underlying inflation. Such asymmetry results from the induced non-linearity in our model. This is a feature that could be of high relevance for policy in projection exercises, or from the point of view of a “risk management” perspective, particularly, during periods of high uncertainty.
Chart A of Figure 3 plots the posterior density of ICARIS for September 2023 that exhibits a skewness of -0.27, suggesting mild downside “risks” associated with current underlying inflation. Instead, Chart B of Figure 3 shows the densities of the projected ICARIS 3, 6 and 12 months ahead, taking October 2023 as the beginning of the projection. The sequence of densities suggests that the expected path of underlying inflation for the coming months is associated with a slight downward trend, however, risks significantly point to the upside. This message can be inferred from the movement towards the left of the densities over the projection horizon along with their positive associated skewness.6
Figure 3: Posterior Densities of ICARIS
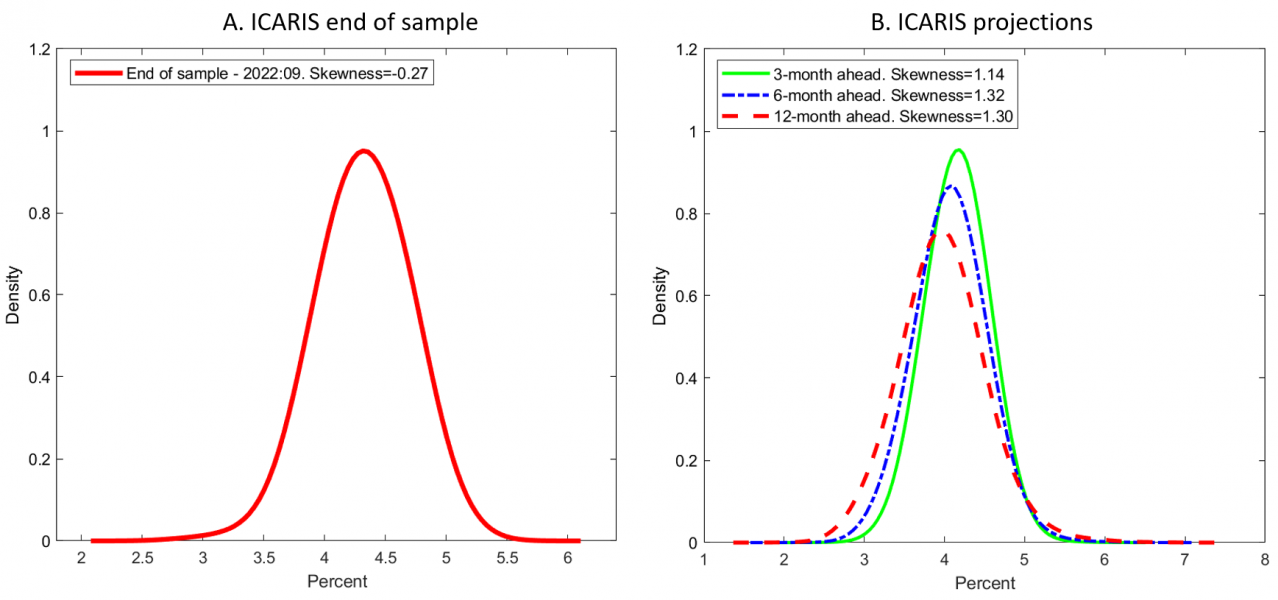
Note. Chart A plots the posterior density of ICARIS for 2023:09. Chart B plots the projected density of ICARIS, 3, 6 and 12 months ahead.
Ascari, G. and T. Haber (2022). “Non-Linearities, State-Dependent Prices and the Transmission Mechanism of Monetary Policy,” The Economic Journal, 132(641), 37–57.
Bańbura, M., and E. Bobeica (2020). “PCCI – a data-rich measure of underlying inflation in the euro area,” Statistics Paper Series 38, European Central Bank.
Cavallo, A, Lippi F, and Miyahara F. (2023) “Large Shocks Travel Fast, NBER Working Paper 31659”
Ehrmann, M., G. Ferruci, M. Lenza, and D. O’Brien (2018). “Measures of underlying inflation for the euro area.” Economic Bulletin Articles, 4.
Klenow, P. and O. Kryvtsov (2008). “State-dependent or time-dependent pricing: does it matter for recent U.S. inflation?” The Quarterly Journal of Economics, 123(3), 863–904.
Le Bihan, H., D. Leiva-León and M. Pacce (2023). “Underlying Inflation and Asymmetric Risks,” European Central Bank Working Paper Nº 2848.
Leiva-León, D., G. Pérez-Quirós and E. Rots (2023). “Real-Time Weakness of the Global Economy,” Journal of Applied Econometrics, Forthcoming.
Schnabel, I. (2022). “A new age of energy inflation: climateflation, fossilflation and greenflation”. Speech at The ECB and its Watchers XXII Conference, at a panel on “Monetary Policy and Climate Change.”
An alternative approach, the “trimmed mean”, is based on removing at each date the items for which the inflation rate of the different classes (or sub-classes) lies in the tails of the cross classes (or sub-classes) distribution.
Monthly HICP inflation data are broken down by “type of product” into 11 specific categories, which are related to some “special aggregates” indices, or sub-components, of inflation published by EUROSTAT, and typically used by the ECB for analytical purposes.
The proposed approach ―built upon the work by Leiva-León, Pérez-Quirós and Rots (2023)― also allows information on real activity ―proxied by the euro area Industrial Production Index― to inform about the transitions between inflation regimes.
The inflation excluding food and energy, or core inflation, reached 4.5% in September.
As stated by Schnabel (2022), “An inflation index that ignores a persistent increase in the relative price of energy is a misleading indicator of underlying inflation trends.”
As a general rule of thumb, if the skewness of a given distribution is between -0.5 and 0.5, it could be considered as approximately symmetric. Instead, if the skewness is higher (lower) than 0.5 (-0.5), the distribution can be considered asymmetric.