
Despite the steep monetary policy tightening of the Federal Reserve, the US labour market remains remarkably resilient and unemployment still hovers close to record lows. This note evaluates whether the speed and strength of the transmission of the current tightening cycle to the US labour market differs from the past. Our empirical evidence suggests that US monetary policy is currently not less effective than in past cycles in steering unemployment. Much of the impact is likely still to come and has been offset partially by other factors so far.
After raising interest rates by over 500 basis points in eighteen months, the Federal Open Market Committee (FOMC) decided at the September and October meetings to maintain the current fed funds target range. A key source of uncertainty is the pace and strength of policy transmission through the economy. Pausing rates provides time to evaluate incoming data and determine the extent to which the effects of monetary tightening have been realized.1 Transmission to the labour market is of particular interest as jobs growth remains surprisingly robust and nominal wage growth elevated. Studies suggests that the peak impact of a monetary policy tightening shock on unemployment takes over a year (see Bauer and Swanson 2023 and references therein). Consistent with this lag, D’Amico and King (2023) find that more than half of the impact of the current tightening cycle on the labour market remains in the pipeline.
Besides lags, transmission in the current cycle could be blurred by exceptional economic conditions. The current cycle started amid historically high inflation, unprecedented labour market tightness (see Figure 1), strong corporate and household balance sheets, large fiscal spending and global supply bottlenecks. These exceptional circumstances may affect the transmission of US monetary policy compared to previous cycles, either by offsetting its impact or changing transmission itself. For example, Cohen (2023) argues that post-pandemic labour shortages have limited the effect of monetary policy on labour markets. Bräuning et. al. (2023) suggest that strong firms balance sheet have dampened the impact of tighter credit conditions on firms’ operations.
Figure 1: Vacancies and wages have recently declined but remain above pre-pandemic levels
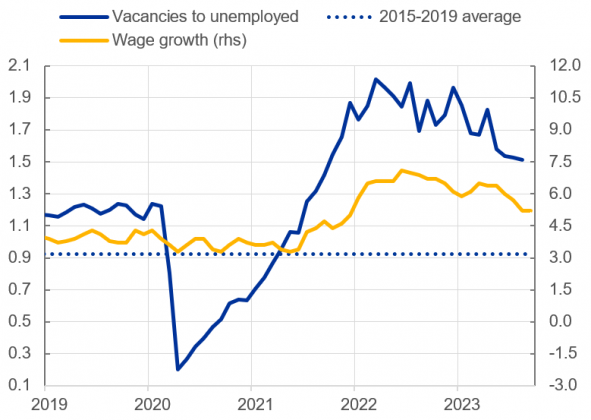
Sources: Federal Reserve Bank of Atlanta, Bureau of Labor Statistics and authors’ calculations.
Notes: Wage growth is the Wage Tracker of the Atlanta Federal Reserve Bank. The dotted line reflects the average vacancies to unemployed ratio between 2015 and 2019.
Latest observation: August (vacancies to unemployed) and September (wage growth) 2023.
This note provides empirical evidence on why the US unemployment rate has been seemingly so unresponsive to the Fed’s tightening so far. We compare the current tightening cycle with past cycles and investigate whether there have been offsetting factors. We focus on the labour market for two reasons. First, an easing of labour market conditions is considered a key transmission mechanism of monetary policy to prices via the Phillips curve.2 Second, much attention has been paid by the Fed to US labour markets as job growth remains robust while unemployment has increased only marginally so far.3 The median forecast for unemployment at the end of 2023 in the Fed’s Summary of Economic Projections has been steadily lowered from 4.6% in March, to 4.5% in June and 4.1% in the September projections, illustrating the unexpected resilience of the labour market.
Two empirical models are used to assess whether the transmission of US monetary policy to the labour market is different this time around. The first model is a structural VAR that allows for changes in the relationships between economic variables over time. This enables us to estimate whether the unemployment rate now responds differently to unexpected changes in monetary policy compared to the past.4
Estimates from this model point to no clear evidence that the effect of US monetary policy on the unemployment rate is weaker than in previous tightening cycles (see Figure 2). The effectiveness of US monetary policy in steering unemployment has varied somewhat over the past forty years but has become neither slower nor more muted recently. To the contrary: our estimates suggest that monetary policy shocks in 2022 transmit to unemployment slightly stronger and faster than in most earlier cycles. One caveat is that the estimates are surrounded by high uncertainty: hence, the differences between cycles are generally not statistically significant.
Figure 2: Impulse response functions of unemployment to a monetary policy shock across tightening cycles
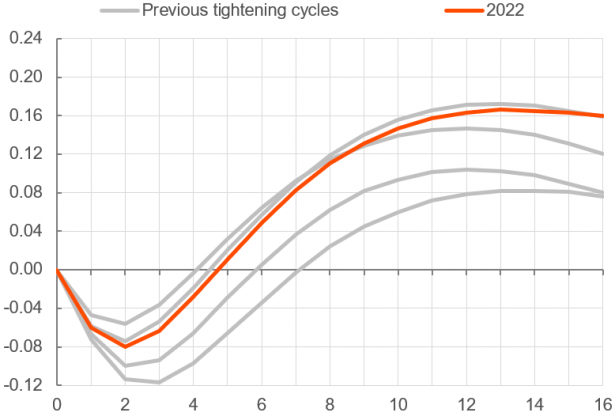
Sources: Authors’ calculations.
Notes: The lines show the impulse response of unemployment to a 1% shock in short-term interest rates using the TVP-VAR model with stochastic volatility in Primiceri (2005). The model uses data on the shadow rate, inflation, unemployment and financial conditions. Responses for past tightening cycles (1986, 1994, 2004, 2015) are shown.
Estimation period: 1983-2023.
If the transmission of monetary policy to the labour market remains effective, how come unemployment only rose slowly and to a limited extent so far? Other factors could have potentially offset the impact of monetary policy on the unemployment rate, thereby blurring its impact. To investigate the role of other factors, the second model that we estimate is a structural VAR model in which the economic relationships are stable over time. This allows us to include more economic variables and to separate the contribution of monetary policy to US unemployment from other key driving factors.5
The estimates from this model confirm that monetary policy has started to affect unemployment already, but other shocks have so far offset its effects (see Figure 3). Adverse shocks to labour supply – which capture declines in labour force participation rates and hours worked – have helped to keep unemployment close to pre-pandemic levels. Also, favourable demand shocks have supported employment according to the model, as US economic growth has remained more resilient than most forecasters initially expected. In other words, the tightening of monetary policy has started to transmit but its effects have been so far hidden by the exceptional tightness in the labour market.
Figure 3: Historical decomposition of the unemployment rate (deviation from pre-pandemic level)
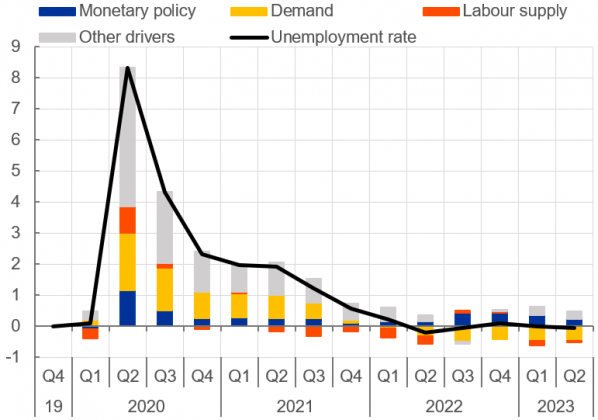
Sources: Author’s calculations.
Notes: BVAR combining sign and zero restrictions to disentangle demand and supply drivers. “Other drivers” contains shocks to global supply, energy prices and a residual.
Latest observation: 2023 Q2.
Overall, the results from both models are consistent with the evidence that monetary policy transmission takes time but does happen. Both models suggest that the typical lag for monetary policy to affect unemployment visibly is around 1 year, with the maximum effect taking place after around 2 years. These lags are generally consistent with recent other studies (Bauer and Swanson, 2023). Given that the FOMC first raised interest rates just over 18 months ago, this suggests – similar to findings in D’Amico and King (2023) – that the transmission of US monetary policy to the unemployment rate is still in initial stages. Moreover, the impact of monetary policy thus far has been offset by the exceptional tightness of the US labour market. To the extent that tightness continues to fade gradually, the effect of policy tightening on unemployment could become more visible in the coming months.
Arias, J.E., Rubio-Ramírez, J.F., and D.F. Waggoner (2018): “Inference based on structural vector autoregressions identified with sign and zero restrictions: Theory and applications.” Econometrica, 86(2), pp. 685-720.
Bauer, M.D. and E.T. Swanson (2023) “A Reassessment of Monetary Policy Surprises and High-Frequency Identification”. NBER Macroeconomics Annual.
Bergholt, D, F Furlanetto, and E Vaccaro-Grange (2023), “Did monetary policy kill the Phillips curve? Some simple arithmetics”, Working paper series, 2/2023, Norges Bank.
Bräuning, F., Fillat, J.L. and G. Joaquim (2023): “Firms’ Cash Holdings and Monetary Policy Transmission”. Federal Reserve Bank of Boston Current Policy Perspectives, October 12, 2023.
Cohen, E. (2023): “Post Pandemic Labor Shortages Have Limited the Effect of Monetary Policy on the Labor Market”. Kansas City Fed Economic Bulletin, September 22, 2023.
D’Amico, S. and T. King (2023): “Past and Future Effects of the Recent Monetary Policy Tightening”. Chicago Fed Letter, no. 483, September 2023.
McLeay, Michael and Tenreyro, Silvana, (2020), Optimal Inflation and the Identification of the Phillips Curve, NBER Macroeconomics Annual, 34, issue 1, p. 199 – 255.
Minutes of the Federal Open Market Committee June 13–14, 2023. Board of Governors of the Federal Reserve System. https://www.federalreserve.gov/monetarypolicy/files/fomcminutes20230322.pdf.
Primiceri, G.E. (2005): “Time Varying Structural Vector Autoregressions and Monetary Policy”, The Review of Economic Studies, Volume 72, Issue 3, July 2005, Pages 821–852.
See the minutes of June’s FOMC meeting.
On the other hand, other labor market indicators such as vacancies and job switching wage premium have already started to ease more visibly.
Specifically, we estimate a time-varying Bayesian VAR model with stochastic volatility over the period 1983Q1-2023Q2. Allowing for continuously changing economic relationships comes at the cost of high estimation uncertainty. As a consequence, we limit the numbers of variables in the model and include the PCE inflation rate, the unemployment rate, a short-term interest rate (replaced by the shadow rate when at the zero lower bound) and a broader financial conditions index. The model builds on the methodology proposed by Primiceri (2005) and monetary policy shocks are identified recursively.
Specifically, the information set contains the GDP growth rate, PCE inflation rate, unemployment rate, the Global Supply Pressure Index from the New York Fed, oil prices and the short-term risk-free (shadow) rate. The model is estimated over the period 1997Q1-2023Q2 and identified via a combination of zero and sign restrictions following the Bayesian algorithm proposed by Arias et. al. (2018).
