This policy brief is based on D. Dunlop-Barrett, “Toward Paris-Aligned Sovereign Investment Portfolios: Utilizing Implied Temperature Rise as a Measure of Alignment”. Views are those of the author and not necessarily those of De Nederlandsche Bank.
Abstract
Investors are increasingly adopting Paris-aligned strategies to manage climate-related risks and opportunities. Yet while sovereign bonds account for roughly half of global debt markets, credible methodologies to assess their alignment remain underdeveloped. This paper firstly advocates for Implied Temperature Rise (ITR) as a forward-looking, intuitive metric to assess sovereign Paris-alignment and embedded transition risks. It then introduces a new ITR methodology that avoids reliance on benchmark emission pathways, uses cumulative and consumption-based emissions as well as the latest global temperature data. This approach reduces volatility, enhances comparability, and improves accuracy. A worked example using a hypothetical sovereign portfolio is provided to demonstrate the methodology in practice.
The 2015 Paris Agreement created a clear global objective: limit temperature increases to well below 2°C, ideally 1.5°C. While investors are increasingly aligning corporate portfolios with this goal, sovereign debt – representing over USD 70 trillion – has lagged behind. This poses a challenge: sovereigns are central to climate outcomes, through climate policy, infrastructure, and fiscal decisions (such as carbon tax). Those sovereigns that fail to transition away from high emitting industries may face elevated credit spreads, downgraded ratings, and restricted market access.
Yet guidance and tools to measure Paris-alignment in sovereign portfolios remain underdeveloped. Investors often default to carbon footprint, or avoid assessment of alignment altogether due to the lack of credible methodologies. The Institutional Investors Group on Climate Change (IIGCC) and others have called for more transparent, science-based tools that consider sovereign-specific dynamics. In response, this paper advocates for ITR as a tool to assess Paris-alignment, and provides a new and transparent methodology for calculating an ITR for a sovereign portfolio.
ITR estimates the global temperature increase implied if the emissions trajectories of portfolio constituents were replicated across the global economy. An ITR is a forward-looking metric that incorporates current and projected emissions based on government policies and expected technological progress. Unlike static measures like carbon footprints, it captures the anticipated impact of credible transition plans. This offers a more accurate view of sovereign climate risks and highlights opportunities that backward-looking metrics may miss. Furthermore, the output is a temperature which can be directly linked to the 1.5°C and 2°C targets set out in the Paris agreement – making communication and understandability simple. Of course, while ITR can be a powerful metric, it is advisable to always use a combination on metrics to enhance informational value.
Table 1. Comparison of Sovereign climate metrics
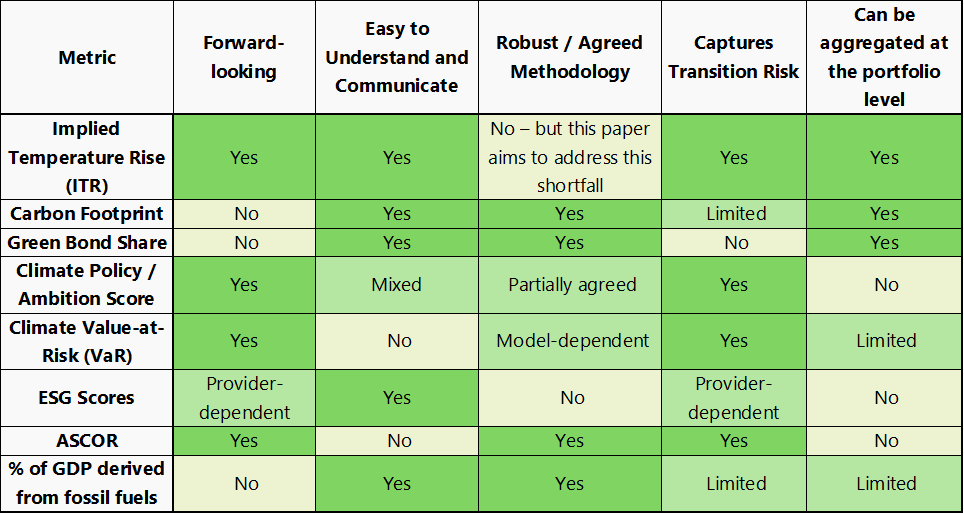
Source: Subjective assessment by the author
Despite these benefits of the ITR, investors have remained understandably cautious on utilizing ITR as a metric to steer portfolio decisions. Common complaints with the ITR metric include the following:
As such, we specifically focus on addressing these concerns in this paper and our methodology.
We propose an ITR methodology designed specifically for sovereign portfolios, addressing key limitations of existing approaches. It is:
The methodology applies the Transient Climate Response to Cumulative Emissions (TCRE), using a central estimate of 0.45°C per 1,000 GtCO₂, consistent with IPCC guidance. Final ITR values are rounded to the nearest 0.1°C to avoid overstating precision.
In all of the ITR methodologies we reviewed, emission pathways were always compared against a benchmark “Paris-aligned” pathway. This is outlined in figure 1, whereby first a benchmark emission pathway is generated (generally aligning with 1.5°C) and the expected emissions of the sovereign (or corporate, as per the chart) are compared to this benchmark, usually via a percentage under/overshoot. The primary difference of our methodology, compared with existing methodologies, is that we do not utilize a benchmark emission pathway at all.
The primary motivation for our methodology to move away from a benchmark pathway was due to the series of complications that it introduced. The key concerns included:
Our methodology sidesteps these issues by focusing only on the cumulative emission pathway and avoids overshoot calculations entirely. Another advantage to our approach is that it gives greater flexibility in modelling the impact of different emission pathway scenarios, such as delayed transitions.
Figure 1. Most current methodologies utilize a benchmark emission pathway (step 1, 3 and 4)
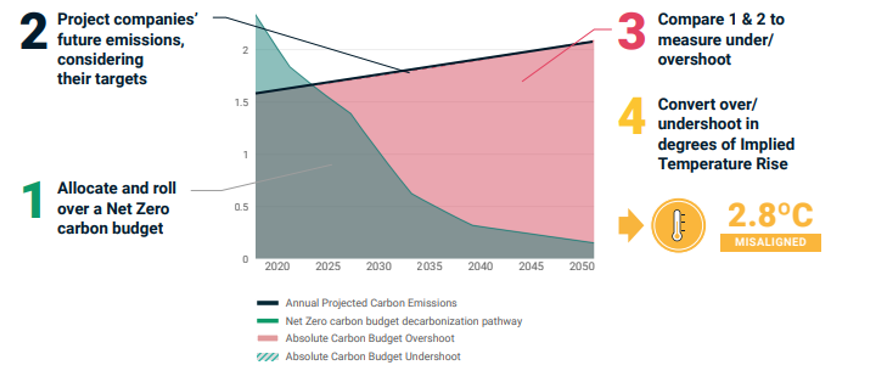
Source: MSCI, Implied Temperature Rise
This section outlines the key steps in the methodology, with a worked example with illustrative numbers provided in the appendix. It also sets out the underlying rationale and relevant decisions underpinning the step.
1. Project cumulative production-based emissions to 2050
Description – Extend each country’s “current-policies” production emission pathway from the latest data point (e.g., 2030) to 2050, then sum annual emissions (LULUCF excluded for consistency).
Rationale – Using the full 2050 trajectory captures total climate impact; point-year estimates miss diverging pathways and would understate long-run warming.
2. Convert to consumption-based emissions
Description – Add net-imported minus exported CO₂ to every projected year to obtain a consumption pathway (e.g., +0.54 Gt CO₂ per year for the United States).
Rationale – Corrects for outsourced production, reflects scope-3-type emissions.
3. Scale to a global-equivalent total
Description – Divide each country’s cumulative consumption emissions by its share of world population to ask: “What if everyone emitted like this sovereign?”
Rationale – Produces an absolute global tonnage that can be linked to temperature without relying on subjective benchmark pathways. Using population to scale consumption emissions is in line with PCAF recommendations.
4. Weight by portfolio holdings
Description – Repeat Steps 1-3 for every issuer, then take the portfolio-weight‐adjusted average of global-equivalent emissions.
Rationale – Aligns the calculation with the investor’s actual exposure, turning disparate country data into a single portfolio figure.
5. Add leakage for aviation and shipping
Description – Add projected cumulative emissions until 2050 from international aviation and maritime transport (~50 Gt in the example).
Rationale – Ensures emissions that fall outside national accounts are captured; omitting them would bias the portfolio ITR downward.
6. Convert tonnes to an ITR uplift using TCRE
Description – Multiply total cumulative tonnes by the Transient Climate Response to Cumulative Emissions (0.45 °C per 1000 Gt CO₂).
Rationale – Applies the IPCC-endorsed linear link between cumulative CO₂ and temperature, translating emissions into warming.
7. Add the uplift to the latest observed baseline temperature
Description – Add the uplift to the average warming over the last 3 years (≈ 1.27 °C) and round the result to the nearest 0.1 °C.
Rationale – Incorporates up-to-date climate data (rather than a fixed 1.5 °C benchmark) and avoids spurious precision; the example portfolio yields ≈ 2.4 °C.
With the rationale, structure, and application of this new ITR approach established, the remaining question is how it can evolve to support a broader, more practical alignment of sovereign portfolios with climate goals. Further methodological improvements and investor adoption are integral steps towards embedding climate alignment into mainstream sovereign debt investing.
This policy brief advocates for the use of Implied Temperature Rise (ITR) as a transparent, forward-looking metric to assess Paris-alignment in sovereign bond portfolios. ITR is simple to communicate and captures the embedded emissions and government policies of sovereign issuers. The methodology introduced in this paper addresses key limitations of existing approaches by:
Looking ahead, further refinements can strengthen the approach. Expanding the methodology to include sub-sovereign, supranational, agency, and corporate bonds would increase its applicability across fixed income portfolios. Additionally, incorporating avoided emissions from sovereign green bonds could better reflect their contribution to climate goals, as their use of proceeds is more targeted than general government spending. Addressing these areas would support a more holistic and accurate assessment of portfolio alignment with the Paris Agreement.
Barahhou, I., Ferreira, P., & Maalej, Y. (2023, June). A framework to align sovereign bond portfolios with net zero trajectories.
BIS. (2024). BIS Data Portal. Retrieved from Summary of debt securities outstanding: https://data.bis.org/topics/DSS/tables-and-dashboards/BIS,SEC_C1,1.0
Caldecott, B., Howarth, N., & McSharry, P. (2013). Stranded assets in agriculture: protecting value from environment-related risks. In Stranded assets in agriculture: protecting value from environment-related risks. Smith School of Enterprise and the Environment.
Caldeira, S. J. (2010). Consumption-based accounting of CO2 emissions. Proceedings of the National Academy of Sciences, 5687-5692.
Collander, S., Gan, B., Nikitopoulos, C. S., Richards, K.-A., & Ryan, L. (2022). Climate Transition Risk in Sovereign Bond Markets.
Damon Matthews, H. T. (2021). An integrated approach to quantifying uncertainties in the remaining carbon budget. Communication Earth and Environment.
Emin, G., Lancesseur, N., Emeric, N., & Clements, L. (2021, April). How to measure the temperature of sovereign assets. Retrieved from https://www.lseg.com/content/dam/ftse-russell/en_us/documents/research/how-to-measure-temperature-sovereign-assets.pdf
Friedlingstein, P. O. (2023, December). Global Carbon Budget 2023. Earth Syst. Sci. Data, 15, pp. 5301–5369.
Friedlingstein, P. O. (2024, November). Global Carbon Budget 2024. Earth System Science Data.
IIGCC. (2024). Sovereign Bonds and Country Pathways.
IPCC. (2023). Climate Change 2023 Synthesis Report. Geneva.
Klusak, Patrycja and Klusak, Patrycja and Agarwala, Matthew and Burke, Matt and Kraemer, Moritz and Mohaddes, Kamiar, Rising Temperatures, Falling Ratings: The Effect of Climate Change on Sovereign Creditworthiness (March 25, 2021). Management Science, Forthcoming , CAMA Working Paper 34/2021.
Leduc, M. M. (2016). Regional estimates of the transient climate response to cumulative CO2 emissions. Nature Climate Change 6, 474-498.
Monnin, P., Feyertag, J., Robins, N., & Wollenweber, A. (2024). Aligning sovereign bond markets with the net zero transition: the role of central banks. London: Grantham Research Institute on Climate Change and the Environment, London School of Economics and Political Science.
MSCI. (2021, September). MSCI. Retrieved from Implied Temperature Rise Methodology: https://www.msci.com/documents/1296102/27422075/Implied-Temperature-Rise-Methodology-Summary.pdf
NGFS. (2024, May). Considering climate-related risks and transition impact in the sovereign investments of central banks.
PCAF. (2022). The Global GHG Accounting and Reporting Standard Part A: Financed Emissions. Second Edition. .
Ritchie, H. (2019). Who has contributed most to global CO2 emissions? Retrieved from Our World in Data: https://ourworldindata.org/contributed-most-global-co2
Steinacher, M. a. (2016). Transient Earth system responses to cumulative carbon dioxide emissions: linearities, uncertainties, and probabilities in an observation-constrained model ensemble. Biogeosciences, 1071-1103.
Todorova, Z., & Garcia Martinez, C. (2024). Sovereign emissions: Nature vs nurture. Barclays Thematic Macro Research.
United Nations. (2015). Paris Agreement.
World Bank Group. 2021. World Bank Group Climate Change Action Plan 2021–2025: Supporting Green, Resilient, and Inclusive Development. © World Bank, Washington, DC. http://hdl.handle.net/10986/35799
Z R J Nicholls, R. G. (2020). Implications of non-linearities between cumulative CO2 emissions. Environmental Research Letters.
While 2024 temperatures did surpass the 1.5°C threshold, breaching in a single year does not mean the Paris target is officially breached.