The analysis and monitoring of business cycles have always been of key importance for policymakers and economic agents in general. In particular, the use and development of business cycle clocks has proved to be of great interest in national and international organisations. Resorting to circular statistics, a novel approach to depict the current momentum of the business cycle is proposed. The usefulness of such an approach is illustrated for the main euro area countries using large datasets covering the last three decades. It is shown that the circular business cycle clock approach enables a timely and reliable tracking of business cycle developments, including both peaks and troughs.
Business cycle analysis has a long tradition, which dates back to the seminal work by Burns and Mitchell along with other researchers at the National Bureau of Economic Research in the United States. The importance of business cycles led to the development of tools to enhance its monitoring. In this respect, several national and international institutions have put great effort into the development of the so-called business cycle clocks, which serve as basis for many economic analyses and regular publications. The literature on business cycle clocks goes back to the 90’s and has been restricted to the use of a single or a small number of series. Recently, Lourenço and Rua (2022) have proposed a novel approach for business cycle clocks. Such an approach makes use of circular statistics, which turns out to be natural in this context, while allowing handling large datasets that are now commonly available.
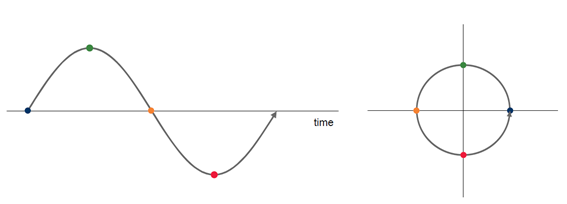
The main idea underlying the business cycle clock is to represent the cyclical stance of economic activity through a four-quadrant visualisation, based on the cyclical component of selected series. Such cyclical component is obtained as the deviation from its long-term trend and the resulting level is plotted against the change from the previous period (Chart 1). In this way, it is possible to evaluate if the indicator is above or below its long-term trend while assessing if it is improving or worsening in the short-run. The business cycle clock has a counterclockwise reading along the usual business cycle stages, where the peaks are identified at the top centre of the diagram and the troughs at the bottom centre.
Chart 1: Stylised business cycle and corresponding clock
Previous work on business cycle clocks has been restricted to the display of a single or a limited number of variables. Given the increasingly availability of macroeconomic data, econometric techniques have been put forward to cope with data rich environments. In this respect, Lourenço and Rua (2022) suggest the use of circular statistics to convey in a business cycle clock format the information regarding the business cycle stage provided by dozens or hundreds of series. As each individual series may potentially point to a different direction in terms of the business cycle momentum, it is also important to summarise those signals in a single direction. Hence, the proposed circular business cycle clock, besides the circular histogram which provides information on the dispersion of the signals (with the histogram bins plotted as straight bars), also displays the mean direction (plotted as an arrow) along with its corresponding confidence interval (Charts 2 and 3).
Chart 2: Trough following the Great Recession
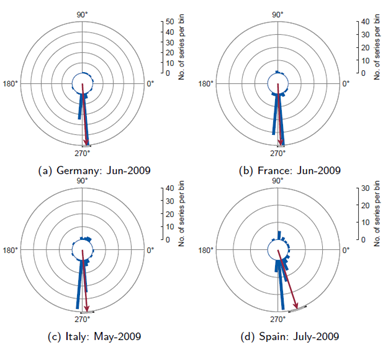
Chart 3: Trough during the COVID-19 pandemics
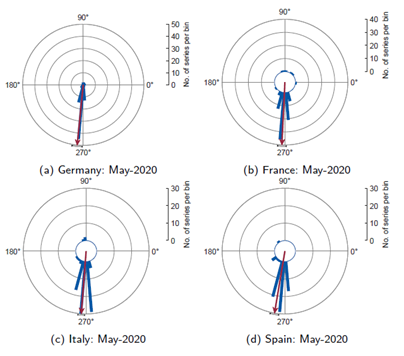
As an illustration, the resulting circular business cycle clock for the main euro area countries drawing on large datasets are presented for the troughs during the Great Recession in 2009 and more recently with the COVID-19 pandemics in 2020. The months for which the business cycle clock are displayed for each country correspond to the OECD business cycle monthly reference chronology. As one can see, the circular business cycle clock can be quite informative about turning points. In fact, it has been shown to perform better than other alternatives and to be reliable in a pseudo real-time context.
Tracking and monitoring the current momentum of the business cycle has always been of key interest for policymaking and private economic decisions. In a context of increasingly data availability, taking on board more information leads to econometric and statistical challenges. The proposed circular business cycle clock allows keeping the appealing features of the clock representation while allowing for the representation of potentially innumerous indicators. Such information can be succinctly communicated trough the circular histogram and mean direction along with its confidence interval. Hence, the circular business cycle clock can contribute to track every period the current business cycle momentum.
Reference
Lourenço, N. and Rua, A. (2022): “Business cycle clocks: Time to get circular”, Banco de Portugal Working Paper No 01/2022.
The opinions expressed in this article are those of the authors and do not necessarily coincide with those of the Banco de Portugal or the Eurosystem. Any errors and omissions are the sole responsibility of the authors.