The views expressed in the paper are those of the authors and do not involve the responsibility of the Bank of Italy.
We analyse the impact of the shock to energy prices induced by the war in Ukraine on the financial performance of the major European firms listed in the Eurostoxx 600 index. We find that equity returns (CDS spreads) decreased (increased) more substantially for firms characterized by high energy intensity and carbon emission intensity. We then present a method, based on a VAR model, to produce forecasts of firms’ CDS spreads conditional on a 3-month stress period of high electricity prices and we document a non-negligible increase in the number of firms with a CDS-implied non-investment rating.
Since mid-2021, global energy prices have been steadily increasing due to pent-up demand from the post-pandemic recovery, leading to a tight energy market. In Europe, the situation was exacerbated by the Russia-Western standoff that culminated with the Russia’s invasion of Ukraine, which added unprecedented pressure to the European energy market: between February 23 (the day before the start of the conflict) and August 26 (the day of peak prices in 2022), European gas wholesale prices increased by 282%. As the war escalated, price tensions spread from the spot market to the whole term structure of futures energy prices, indicating that energy costs would have been high for an extended period.
Europe’s heavy reliance on energy imports from Russia has made local energy prices particularly vulnerable to the war in Ukraine, as Russia accounted for around 29% of crude oil and 43% of natural gas imports into the European Union in 2020. However, reliance on Russian energy varies widely across member states, with countries in central and Eastern Europe, Germany, and Italy displaying the greatest dependence.
In our recent work (Ferriani and Gazzani 2022), we contribute to the policy and academic debate on the implications of the Russia’s invasion by assessing the impact of higher energy prices on the financial performance of European non-financial firms.
Our study (Ferriani and Gazzani, 2022) examines the impact of the energy shock on the corporate asset prices of non- financial firms listed in the Eurostoxx 600. We exclude utilities and energy firms from the sample since they sell energy to households and other firms and may directly pass-through the increased energy costs to their customers. Our sample consists of more than 360 firms, with an average market capitalization of 8.5 trillion Euro, accounting for 33.5% of GDP of the combined geographical coverage of the Eurostoxx (EU27+ UK, Norway and Switzerland).
We focus on both equity returns and on changes in 5-year CDS spreads since the start of the war in Ukraine to study how the energy shock is transmitted to corporate asset prices, channeled via the extent of energy use in firms’ production functions. To measure firms’ sensitivity to higher energy prices, we consider two proxies: energy intensity, defined as energy expenditure divided by total revenues, and carbon emission intensity, which is calculated as a firm’s Scope 1 emissions scaled by equity market value. This second measure captures not only energy use but also additional costs associated with carbon emissions, providing insight into firms’ exposure to climate transition risk. Energy costs constitute over 8.5% of total revenues for the firms in the sample. The construction, metal and mining, transportation, and paper and forest products industries are the most exposed in terms of energy costs and carbon emission intensity, see Table 1.
Table 1: Top 10 Most exposed industrial sectors in terms of energy and emission intensity
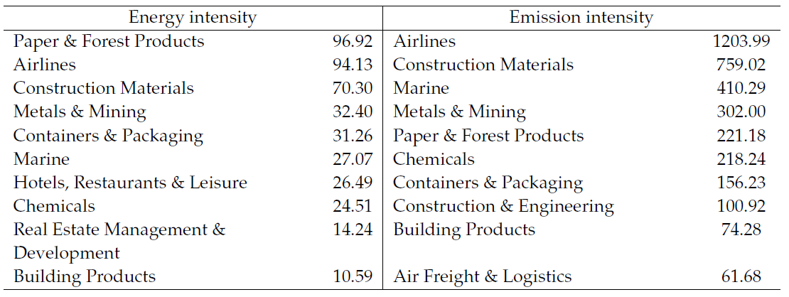
Note: energy costs are evaluated using the average electricity price recorded in the first 7 months of 2022; the huge energy shock recorded in the first part of the year explains why the share of energy costs over total revenues can be extremely large for some industries.
Our results show a statistically significant negative correlation between firms’ financial performance since the start of the conflict and their energy and emissions intensity. As an example, a 1 percentage point increase in energy intensity reduces a company’s equity return by approximately 0.12 to 0.16 percentage points, depending on the model specification. The evidence is consistent when analyzing changes in CDS spreads, but in this case, firms with higher energy use face a significant increase in solvency risk: a 1 p.p. increase in energy intensity augments CDS spreads by 0.12-0.31 p.p., depending on the model. The results are qualitatively similar if we replicate the analysis using emission intensity instead of energy costs. Our findings are graphically summarized in Figure 1 where we plot the distribution of equity returns and CDS spread changes with respect to energy intensity; the graph reveals that companies more exposed to the energy shock have underperformed their counterparts with less energy-intensive production functions.
Figure 1: Sensitivity to the energy shock and firms’ financial performance
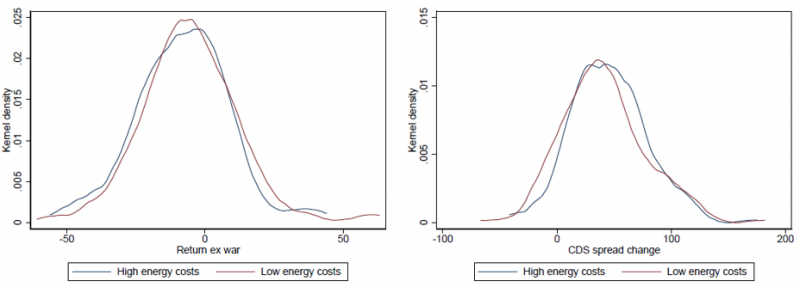
Note: authors’ computation based on Ferriani and Gazzani (2022). Kernel density of equity returns (left plot) and CDS spread variations (right plot) with respect to firms’ energy intensity. High energy-costs firms have an energy intensity larger than the sample median, the opposite holds for low energy-costs firms. Corresponding plots for emission intensity and other robustness exercise are available in the paper.
As a second exercise, we evaluate the potential impact of a prolonged period of elevated energy prices on firms’ financial stability. Our approach is similar in spirit to a stress test exercise, and it is important from a policy perspective, as a better understanding of the interlink between energy inputs and firms’ viability is important to identify sectoral vulnerabilities and to address measures to counteract energy shortages and high energy costs.
We utilize firm-level vector autoregressive (VAR) models to generate forecasts of firms’ CDS spreads based on electricity prices. For each company, we estimate a weekly VAR model that incorporates the aggregate energy price as an exogenous variable, with additional controls including the Eurostoxx and Vstoxx volatility indexes. To simulate the impact of sustained high energy prices, we assume that energy prices remain at the high levels observed in the last week of July for a period of three months, and stress the corporate CDS spreads accordingly.
Our VAR-based CDS spread forecasts indicate that firms’ implied default probabilities (PD) would experience a slight aggregate increase after three months, but importantly, a significant number of firms would lose their investment-grade status. As shown in Figure 2, default risk rose notably since the onset of the war, and our scenario of elevated energy prices would lead to a further increase in insurance costs against rising default risk. Specifically, according to our exercise the average PD rises from 1.87% at the end of July to 2.17% after three months. While the implied distribution of PD shifts to the right, indicating a deterioration of firms’ viability due to the internalized impact of the energy shock, the overall effect is not drastic. However, looking at the firm level detail a much wider heterogeneity would emerge: 74 firms in our sample would record an implied PD larger than 3%, the most affected industries being chemicals, machinery, food & staples retailing, metals & mining, real estate management & development, and automobiles, i.e. mostly industrial sectors with the largest incidence of energy costs over total revenues as displayed in Table 1. As a comparison, the corresponding amount of firms with an implied PD larger than 3% was equal to 13 at the onset of the war and 47 at the end of July 2022.
Figure 2: Probability density functions of CDS-implied PDs
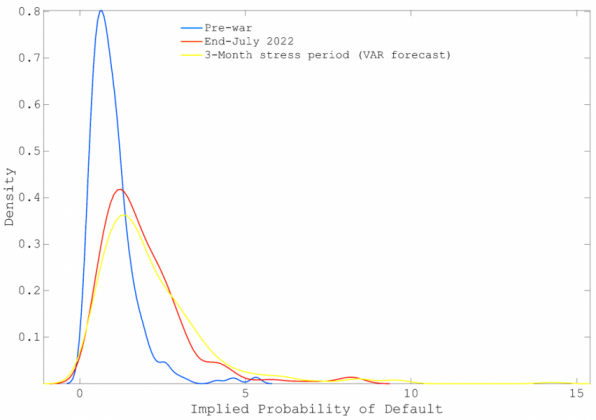
Note: CDS-implied PDs. Density of the implied PDs extracted from corporate CDS spread at the onset of the war, at the end of July, and after a 3-month stress period of sustained electricity prices (VAR exercise).
Our analysis shows that the energy shock resulting from the conflict in Ukraine has materialized on firms’ financial performance. Specifically, we find that firms with higher energy and carbon emission intensity are more vulnerable to the negative effects of the shock, with lower equity returns and higher solvency risk. As for now, policy measures and other initiatives in Europe such as mandatory targets for natural gas storage, import diversification, and substantial LNG imports, have been successful in moderating the impact of higher energy prices. However, European natural gas prices remain high in historical terms and the channel we have identified may strengthen again in the future as China ends its zero-Covid policy and upward price pressures emerge from global competition to secure LNG supplies. Our findings have significant policy implications, emphasizing the need to sustain efforts towards alleviating the detrimental impact of high energy prices on European firms. Persistent differences in energy costs have the potential to impede firms’ profitability, heighten their commercial risks, and ultimately render them less competitive compared to other regions.