The views expressed in this policy brief should not be considered as representative of the official position of the institutions to which the authors are affiliated.
Abstract
Recent geopolitical events have triggered a debate about increasing defence expenditures and their broader economic implications. The economic effect is expected to crucially depend, among others, on the extent to which higher public defence R&D spending can crowd in private R&D spending. We find evidence of a crowding in effect on R&D expenditure financed by the private sector. The crowding in effects have long and variable lags. The extent of the crowding in, however, depends on countries’ innovation performance. A common public defence R&D shock may hence widen the innovation gap between more and less advanced innovators.
The rapidly changing geopolitical landscape brought focus over countries’ actual military spending. While most European countries have increased spending on defence in recent years, several EU Member States found themselves well below the 2% of GDP NATO commitment and the higher goal that NATO Member States recently agreed upon.1 Furthermore, spending on defence-related R&D in EU countries falls substantially short of other OECD countries, particularly the US. This may be relevant from an economic perspective, given the perception that R&D spending is one of the spending categories with the largest impact on economic growth. In fact, previous work shows significant interactions between public R&D and private R&D spending (Tomasone et al., 2024)2.
The economic literature highlighted how the impact of defence spending on the domestic economy is influenced by several factors. Estimates of the short-term impact of defence spending vary by country context, time period, and methodological approaches. The Keynesian view is that a stimulus from higher public spending raises output on impact (e.g., Barro, 1990)3, The economic literature highlighted how the impact of defence spending on the domestic economy is influenced by several factors. Estimates of the short-term impact of defence spending vary by country context, time period, and methodological approaches. The Keynesian view is that a stimulus from higher public spending raises output on impact (e.g., Barro, 1990)4 Findings on defence spending multipliers are mixed. Some papers report relatively high multipliers particularly for the US (e.g., Ando, 2018)5, while others find negligible or negative effects, mainly in Europe (Dunne and Nikolaidou, 2012; Kollias and Paleologou, 2016)6. Recent empirical research suggests public defence R&D spending can have a large spillover effect on civilian industries (Antolin-Diaz and Surico 20257 in the US, Moretti et al. 20258 in OECD countries). We add to these studies by applying local projections, as in Antolin-Diaz and Surico (2025), to the analysis of OECD and EU countries. We also focus on public defence R&D spending directly rather than as an instrumental variable approach in Moretti et al. (2025).
We focus on samples of selected EU countries9 and OECD countries10. Country selection is based solely on the existence of time series spanning at least 30 years, as is necessary to meet the requirements of our empirical analysis. This results in an unbalanced panel, with the maximum time span running from 1981 to 2022.
The broader OECD sample allows us to distinguish two subgroups of countries based on their distance from the innovation frontier. This distinction is relevant as this distance may shape the growth effects of innovation policies. Countries closer to the frontier are better placed to turn additional public R&D spending into innovations, crowding in private R&D and generating productivity gains. By contrast, countries further from the frontier rely more on adopting innovation by others and therefore face weaker dynamic effects from similar shocks11.
To estimate the effect of the distance from the innovation frontier on the multiplier of R&D defence spending, we split the sample into two groups (i) ‘innovation leaders’12 and (ii) ‘moderate innovators’.13 14The classification is based on the 2024 Global Innovation Index (Dutta et al. 2024)15, which ranks countries according to their innovation performance. The index incorporates several indicators capturing the innovation ecosystem, from the quality of the policy environment, education systems, infrastructure, and the capacity for knowledge creation. Public R&D spending should improve private innovation activity more in countries with a higher index.
We capture innovation activity by firms through business R&D expenditure financed by the private sector to estimate potential crowding-in or crowding-out effects of public military R&D spending on private R&D investment. To address endogeneity concerns, we look at patent data, using it as a proxy for the overall level of innovation in the economy. We also look at the effect of public military R&D spending on economic growth by assessing its impact on GDP per capita.
Our main explanatory variable is government budget allocations on Defence R&D expenditure. Control variables comprise the real GDP growth rate, civilian government budget allocations on R&D, total government expenditure, business expenditure on R&D not financed by the private sector, population size and the short-term interest rate.
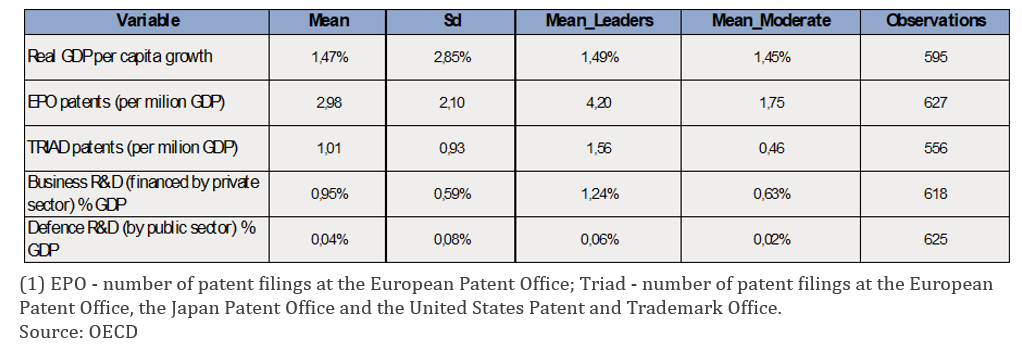
Table 1 shows substantial differences between innovation leaders and moderate innovators and suggests that a comparable shock to public spending in defence R&D may generate heterogeneous effects across groups.
Table 1. Main statistics of the variables used in the model
As most of the effects from innovation are expected to materialise further in time, we use local projections (Jorda, 2005)16 , since local projections deliver more consistent impulse responses at long horizons than VARs. We estimate the dynamic effects of a shock to public military R&D spending over 10 years to show the full transmission process.
We use a standard one-off shock of a discrete increase in public defence spending of 1% of GDP at time t. This is well above current levels of spending, reflecting the prospect of substantial rises in overall defence expenditure and a significant expansion of its research component. While we will likely see gradual build-up of defence budgets, the responses to a one-off shock provide a benchmark for understanding the effects of a sustained increase rather then the spread-out the impact of a gradual increase.
We rely on the assumption of exogeneity between the dependent variables, as the nature of the explanatory variable itself allows us to impose this assumption. Indeed, public defence R&D expenditures represent a small subset of total public military expenditure, a category traditionally viewed in the literature as driven by non-economic considerations (Ramey and Shapiro, 1998; Moretti et al., 2025)17. In fact, Moretti et al. (2025) use public defence R&D spending as an instrument for overall public R&D spending, reducing our endogeneity concerns. Yet, more work may be needed to further address them.
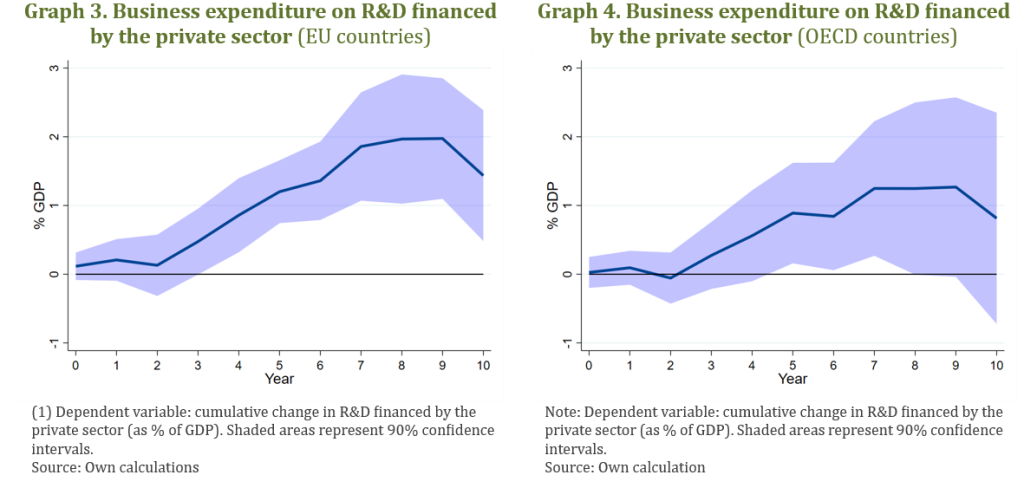
Private R&D investment. We first focus on the response of private R&D investment as a share of GDP. In the EU (Graph 3) and OECD samples (Graph 4), the response of private R&D investment is statistically insignificant in the years immediately following the public spending shock. However, a clear crowding-in effect emerges after a few years, allowing private investment in R&D to grow steadily and reach its peak around the ninth year after the shock. The cumulative increase in private R&D exceeds the initial shock, approaching 2% of GDP among EU countries18. This highlights a strong role of military-related innovation in stimulating broader innovative activity.
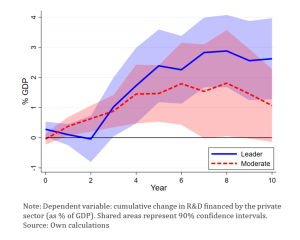
As expected, the magnitude of the crowding-in response is stronger and more durable in innovation leaders (see Graph 5). Accordingly, a common public R&D shock may deepen the innovation gap between more and less innovative countries, consistent with previous findings (see Tomasone et al. 2024)19.
Graph 5. Business expenditure on R&D financed by the private sector (OECD countries)
Patents. Concerning patents filed with the EPO, we observe a gradual increase following the shock, in both samples (see Graphs 6 and 7). This increase becomes statistically significant after three years, reaching a growth of over 0.5%, and approaching 1% after ten years. This six-year lag would be expected if defence R&D first generated patentable knowledge, which then led private firms to invest in commercialising applications.
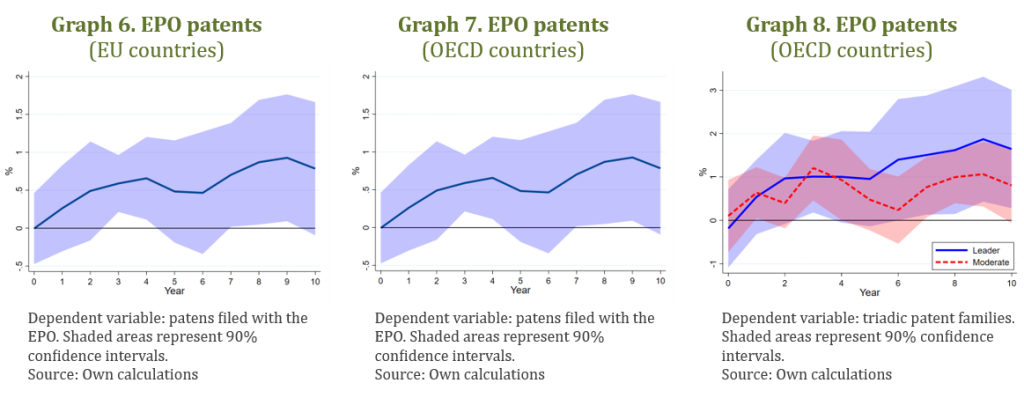
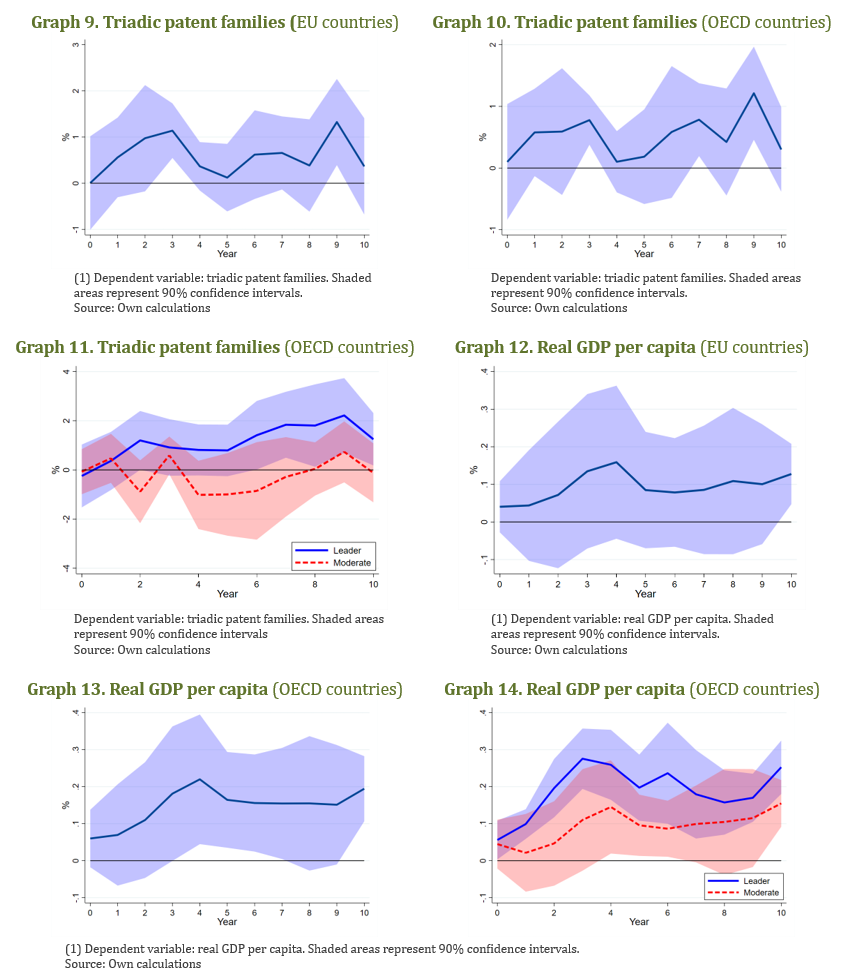
Regarding the triadic patent families, the impulse responses for the same samples (see Graphs 9 and 10) show a less clear dynamic but with similar magnitudes, mostly ranging between 0.5% and 1% across horizons. Graphs 8 and 11 underline the risk of innovation divergence.
Economic activity. The long-term effect of an increase in public defence R&D spending on real GDP per capita is positive and significant (see Graph 12 to Graph 14). The cumulative impulse responses for GDP growth reveal a consistent positive effect for innovation leaders and moderate innovators, but with a net divergence in magnitude and persistence.
This broadly aligns with the endogenous growth literature, as innovation shocks feed into long-run growth through knowledge accumulation. The stronger complementarities between public R&D, private innovation, and productivity growth in leaders account for the larger and more durable effects observed in the data.
The European Commission was asked to accelerate its work to ramp up the EU’s defence readiness in the next five years. Meeting the Union’s defence-readiness objectives requires substantial defence investments. Against this background, we estimate the relation between public defence R&D spending and private investment for a sample of EU and OECD countries. We find evidence of a significant crowding in effect. Yet, this effect depends crucially on the pre-shock level of defence R&D spending, with highly innovative countries displaying a stronger crowding in than less innovative ones, also underlying the relevance of defence R&D spending for economic convergence. Overall, the results highlight the need to design defence spending and its relation to EU initiatives efficiently, factoring in the positive economic effects of higher public R&D defence spending.
https://www.nato.int/en/about-us/official-texts-and-resources/official-texts/2025/06/25/the-hague-summit-declaration.
Tomasone, F., Calò, S., and Krämer, R. (2024), “The innovation channel of fiscal consolidation,” European Stability Mechanism, Blog, 10/09/2024.
Barro, R. J. (1990), ‘Government spending in a simple model of endogeneous growth,’ Journal of Political Economy, 98(5): S103–S125.
Deger, S. and Smith, R. (1983), ’Military expenditure and growth in less developed countries,’ The Journal of Conflict Resolution, 27(2):335–353 and Ilzetzki, E. (2025), “Guns & growth: The economic consequences of defence buildups,” Kiel Report 2, Kiel Institute for the World Economy.
Ando, J. (2018) “Externality of defence expenditure in the United States: A new analytical technique to overcome multicollinearity,” Defence and Peace Economics, 29(7):794–808.
Dunne, J. P. and Nikolaidou, E. (2012), ‘Defence spending and economic growth in the EU15,’ Defence and Peace Economics, 23(6):537–548; and Kollias, C. and Paleologou, S.-M. (2016), “Investment, growth, and defence expenditure in the EU15: Revisiting the nexus using Sipri’s new consistent dataset,” The Economics of Peace and Security Journal, 11(2).
Antolin-Diaz, J. and Surico, P. (2025), ‘The long-run effects of government spending,’ American Economic Review, 115(7):2376–2413.
Moretti, E., Steinwender, C., and Van Reenen, J. (2025), ‘The intellectual spoils of war? Defence R&D, productivity, and international spillovers,’ Review of Economics and Statistics, 107(1):14–27.
Belgium, Denmark, Estonia, Finland, France, Germany, Greece, Italy, Netherlands, Portugal, Romania, Spain.
Australia, Belgium, Canada, Denmark, Estonia, Finland, France, Germany, Greece, Italy, Japan, Korea, Netherlands, Norway, Portugal, Romania, Spain.
Aghion, P. and Howitt, P. (2006), ‘Joseph Schumpeter lecture appropriate growth policy: A unifying framework,’ Journal of the European Economic Association, 4(2-3):269–314.
Canada, Denmark, Estonia, Finland, France, Germany, Japan, Korea and the Netherlands.
Australia, Belgium, Greece, Italy, Norway, Portugal, Romania and Spain.
We use these terms based on Pellens, M., Peters, B., Hud, M., Rammer, C., and Licht, G. (2024). ‘Public R&D investment in economic crises.’ Research Policy, 53(10):105084.
Dutta, S., Lanvin, B., Leon, L. R., and Wunsch-Vincent, S. (2024), ‘Global Innovation Index 2024: Unlocking the promise of social entrepreneurship,’ World Intellectual Property Organization.
Jorda, O. (2005), ‘Estimation and inference of impulse responses by local projections,’ American Economic Review, 95(1):161–182.
Ramey, V. A. and Shapiro, M. D. (1998), ‘Costly capital reallocation and the effects of government spending,’ Carnegie-Rochester Conference Series on Public Policy, 48:145–194; and Moretti et al. op. cit.
The results for OECD countries are somehow less significant than for EU countries, but still significant at 10% in the medium-term (from 5 to 9 years after the shock).
Op. Cit.