menu
close

Author(s):

Aleksandra Kordalska | Gdańsk University of Technology
Magdalena Olczyk | Gdańsk University of Technology

Keywords:

functional specialisation , global value chains , smile curve , factory economy , headquarters economy

JEL Codes:

F15 , F21 , F23 , F63 , L23

This policy paper presents a framework and the results for understanding the phenomenon named functional specialisation (FS), i.e. trade specialisation in global value chains (GVC). Based on activities undertaken within GVCs we picture FS of EU countries. To make our results robust we measure FS in two ways: by the income share of the workers who carry out these activities in GVCs (Timmer et al., 2019), and by activities offshored by firms via FDI (Stöllinger, 2021). Using data for the period 2000-2018, our analysis shows crucial discrepancies between EU15 and CEE countries in their FS patterns. High value-added activities tend to be located in EU15 countries, while pure production is located mainly in CEEs. Our results suggest a positive effect of wages on specialisation in R&D function and a negative impact on FS in fabrication. Labour productivity boosts both specialisation in fabrication and in R&D. This framework provides valuable insights for policymakers by emphasising greater attention to the functional diversification of economies, i.e. the ability of countries to perform a broader range of high value-added functions.

1. How to gain the most in GVCs?

The emergence of global value chains has given rise to an ever more granular international division of labour with new opportunities for specialisation. Differences between countries are not more due to specialisation in different products or industries, but because of specialisation in different tasks in the same industries. The simplest way to present in which tasks/activities a country could specialise is the smile curve (Figure 1). It was first proposed by Shih (1996), the founder of Acer, who discovered that the two ends of the value chain generate higher value-added than the middle part.

In practice identifying tasks a particular country specialises in is a challenge. We can use a standard tool for analysing patterns of specialisation popularised by Balassa (1965), called the Revealed Comparative Advantage (RCA) index. According to Balassa, a country has a comparative advantage for a given product if the share of that product in the country’s exports is larger than the share at the level of the trade area under consideration (world exports or a regional trade area). A country reveals comparative advantages if its RCA value is greater than 1 or comparative disadvantages if its value is smaller than 1. Nowadays thanks to Koopman et al.’s (2014) accounting framework, we can calculate the RCA index in value-added terms. Koopman et al.’s (2014) approach allows us to break down a country’s gross exports into different value-added components, so we can estimate how much each country adds to the value of a product in the process of producing it (known as domestic value-added).

Figure 1: The smile curve
 width=
Source: Based on Ye et al. (2015).

However, we still do not know where (by which tasks on the smile curve) this domestic added value is generated. This knowledge is critical to evaluate correctly the specialisation pattern. Simplifying the matter, if we have 2 countries that export innovative products, but in country 1 employees are engaged in activities located at the beginning or end of the smile curve but n country 2 specialised in fabrication activities. The first country has a much better specialisation, because it guarantees it a greater added value than country 2. Here the concept of functional specialisation comes in handy.

2. New measurement approach through the functional specialisation lens

In the literature, we can find two different approaches to calculating functional specialisation. Timmer et al. (2019) propose a measure of functional specialisation which is based on Balassa’s RCA formula but focuses on value chain activities by considering the occupations of the workers who carry out them. Timmer et al. (2019) make one assumption: particular functions and their contribution to a country’s exports can be identified by measuring the income of the domestic workers who carry out GVC functions. To obtain the RCA index in business function authors: (1) map all occupations with wages based on the Structure of Earnings Survey (see Buckley et al., 2020), then map all occupations onto the four main business functions ((i) management, (ii) R&D; (iii) fabrication, (iv) marketing1) and finally (3) use income shares by business functions at the country-industry to decompose of domestic value into DVA created by the four business functions.

In turn, Stöllinger (2021) provides a different way to measure functional specialisation. He also uses Balassa’s formula but focuses on business activities offshored by firms via FDI. The fDi Markets database contains data on the number of inward greenfield FDI projects, capital investment, job creation due to these new projects, and information on the functions that the newly established FDI subsidiaries perform. Aggregating the inward greenfield FDI projects allows for a calculation of country-level functional profiles. In comparison to Timmer et al. (2019) approach, greenfield FDI data identify more business functions which can be combined to (i) headquarter services, (ii) R&D, (iii) fabrication, (iv) sales and distribution services, and (v) technical support services and training.

In our work, we focus on two radically different value chain functions – the fabrication function and the R&D function.

3. Functional diversification of economies: Who is the leader, who is the outsider

Our analysis reveals crucial discrepancies between EU15 and CEE countries in their functional specialisation profiles (Kordalska et al., 2022). High value-added activities and business functions at the beginning and end of the smile curve tend to be located in EU15 countries (so-called headquarter economies) while pure production activities are located mainly in CEE (so-called factory economies).

The dominance of the fabrication function in CEE countries (Figure 2) situates these countries on the left-hand side of the graph. This specialisation profile of the CEE countries suggests that these countries may have been stuck in a functional specialisation trap whereas EU15 countries, i.e. Germany, the UK, France, the Netherlands or Denmark, reveal strong specialisations in R&D combined with low values in their fabrication function indices.

Figure 2: Functional specialisation in R&D and fabrication by country, 2003-2018 (FDI data)
 width=
Source: own elaboration based on fDi Markets database.

4. Important factors for low/high value-added functions in GVCs

What determines whether a particular country has a comparative advantage in more complex and profitable business functions such as R&D, and which factors determine whether it has an advantage over its competitors in production and assembly activities? The main interest of our analysis (Kordalska & Olczyk, 2023) are determinants of FS related to the labour market (especially wages and skills) because the concept of functional specialisation connects labour market features with a country’s participation in value chain activities that generate differentiated value-added levels.

Our main results suggest that high wages are associated with the specialisation in R&D function and low wages with FS in fabrication. Increasing labour productivity boosts both specialisation in fabrication and in R&D. So, the low wage profile, which the CEE region has is not only a historical legacy but also an obstacle to future development. These countries have a stable role in the international division of labour based on a low value-added function, i.e. assembly and subcontracting activities. The CEE region has established itself as an important location for foreign direct investment, with clusters in the automotive and electronics sectors embedded in a large supplier network that cannot be easily relocated. We strongly recommend implementing a strategy to achieve additional comparative advantages in the R&D function by CEE countries. Galgóczi’s (2017) analysis shows that due to a ‘productivity reserve’ in CEEs, the increase of rising wages in the economies of CEE is possible, which could strengthen specialisation in this function.

Moving up the smile curve is also possible with the aid of growing human capital. The predominance of highly-skilled workers over low-skilled ones supports specialisation in R&D. This is visible in the whole EU, but in particular this is seen in CEEs.

Our results also confirm that GDP per capita positively affects functional specialisation in R&D activities. In a country which has achieved higher income status, institutions can help leverage GVC engagement by fostering skill-building, innovation, and efficient access to capital, supporting the inclusion of more local enterprises and workers in the GVC network; and focusing on structural reforms that increase domestic labour productivity and skills (World Bank, 2017). It is why faster economic convergence between the countries of the Old and the New EU countries is also important for improving the pattern of functional specialisation of the CEE countries.

5. General recommendations

We would like to point out that trade specialisation in GVCs should not only be judged through the prism of the export basket (degree of innovation of exported products, product diversification, etc.). The growth opportunities related to country participation in GVCs are highly dependent on value-added functions within industries. We would like to emphasize that greater attention should be paid to the functional diversification of economies, i.e. the ability of countries to perform a broader range of high-value-added functions. We believe it is so important to identify ‘gaps’ in value chains at the country level, i.e. it is necessary to identify the value-adding functions that domestic actors are currently unable to perform because these functions have been largely outsourced to foreign producers or there is a heavy dependence on foreign supplies of key inputs. Moreover, a necessary activity is to coordinate investments that complement the productive capacity of EU economies in terms of functions in GVCs. This, in turn, requires that action be taken at the EU level for the effective acquisition of key production factors and knowledge assets. In terms of further analysis, it is necessary to collect data and develop measures, which allow identifying more details functions in value chains, which particular EU economies have.

References

Balassa, B. (1965). Trade Liberalisation and ‘Revealed’ Comparative Advantage. Manchester School, 33(2), 99–123.

Buckley, P. J., Strange, R., Timmer, M. P., & de Vries, G. J. (2020). Catching-up in the global factory: Analysis and policy implications. Journal of International Business Policy, 3(2), 79–106.
https://doi.org/10.1057/s42214-020-00047-9.

Galgóczi, B. (2017) Why Central and Eastern Europe Needs a Pay Rise. ETUI Research Paper – Working paper 2017.01, Available at SSRN: https://ssrn.com/abstract=2965393.

Koopman, R., Wang, Z., & Wei, S. (2014). Tracing Value-Added and Double Counting in Gross Exports. American Economic Review, 104(2), 459–494.

Kordalska, A., Olczyk, M., Stöllinger, R., & Zavarská, Z. (2022). Functional Specialisation in EU Value Chains: Methods for Identifying EU Countries’ Roles in International Production Networks. WIIW Research Reports, 461, 1–51.

Kordalska, A., & Olczyk, M. (2023). Determinants of Functional Specialisation in EU Countries. WIIW Working Papers, 228(May), 1–46.

Shih, S., (1996). Me-Too is not my Style: Challenge Difficulties, Break Through Bottle- necks, Create Values, The Acer Foundation, Taipei.

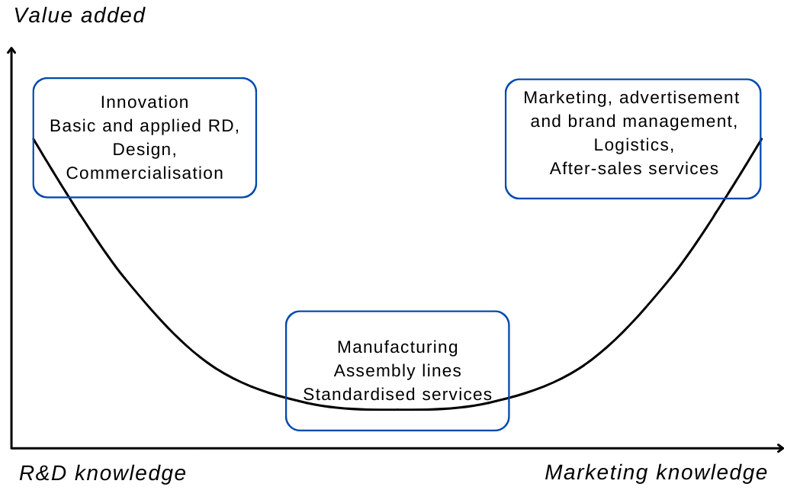
Stöllinger, R. (2021). Testing the Smile Curve: Functional Specialisation and Value Creation in GVCs. Structural Change and Economic Dynamics, 56, 93–116.

Timmer, M., Miroudot, S., & De Vries, G. (2019). Functional specialisation in trade. Journal of Economic Geography, 19(1), 1–30.

World Bank. (2017). Global Value Chain Development Report 2017: Measuring and Analysing the Impact of GVCs on Economic Development. Washington, DC: World Bank.
https://openknowledge.worldbank.org/handle/10986/29593.

Ye, M., Meng, B., & Wei, S. J. (2015). Measuring smile curves in global value chains. Inst. of Developing Economies, Japan External Trade Organization.

About the authors

Aleksandra Kordalska

Aleksandra Kordalska is an assistant professor at the Faculty of Management and Economics, Gdańsk University of Technology. Her scientific interests focus on international trade, in particular on international trade of Central and Eastern European economies. The main research works are related to global value chains, involvement in global value chains in the size and ownership firms’ context, as well as functional specialisation, technological specialisation, and manufacturing servicification.

Magdalena Olczyk

Magdalena Olczyk is a professor at the Gdansk University of Technology, at the Faculty of Management and Economics (Department of Economics). Her scientific interests focus on CEE and the Baltic economies, in particular their international competitiveness, structural changes, energy transition, and functional specialisation. She is the author of more than 90 publications and has participated in 11 international projects.

More on these topics

Tags: