Supply-chain disruptions are at the forefront of economic debates and are often associated with the recent surge in inflation. The increase in inflation has triggered a debate about the efficacy of monetary policy in the presence of supply constraints. In Balleer and Noeller (2023) we provide new direct empirical evidence on how supply constraints propagate monetary policy shocks. We start with a general discussion on the measurement of supply constraints. Specifically, we show that capacity utilization, a widely accepted measure of bottlenecks and slack, is an imperfect measure for input constraints, which are associated with recent supply chain disruptions. We show that the distinction between input and capacity constraints is crucial to understand the propagation of monetary: the probability to increase prices rises sharply for input constrained firms in response to an expansionary monetary policy shock, independent of their level of capacity utilization. A recent theoretical literature argues that it might be optimal not to raise rates when supply is constrained. We inform this debate by providing estimates of firms’ reactions to such policies.
Supply-chain disruptions are at the forefront of economic debates and are often associated with the recent surge in inflation. The increase in inflation has triggered a broad economic debate on how monetary policy should act in the presence of supply constraints. According to textbook new Keynesian theory, the optimal response of monetary policy to constrained production is to raise interest rates such that demand is in line with constrained supply. But Caballero and Simsek (2022), for example, argue that it can be optimal not to raise rates or even increase rates and risk inflation when production is constrained temporarily, since this ensures sufficiently high demand when supply recovers. Fornaro and Wolf (2022) highlight the scarring effects of supply constraints which induce a reduction in investment. Contractionary monetary policy might intensify these scarring effects. In order to assess the optimal policy reaction, we would therefore like to learn more about the nature and persistence of supply constraints and also investigate how supply constraints propagate economic shocks in general and monetary policy shocks in particular. Balleer and Noeller (2023) shed some new light on these questions.
A common way to assess inflationary pressures stemming from the production side of the economy is to look at capacity utilization. The argument behind this is straightforward. If there is slack in the economy, i.e., production units are idle or workers are unemployed, an additional boost in demand can stimulate the economy without inducing a rise in prices, since firms can just utilize their unused machinery to meet the additional demand without an increase in costs. If, in turn, many resources are already in use, the firm cannot easily meet the additional demand, so it could raise prices to reduce demand in the first place.
Figure 1
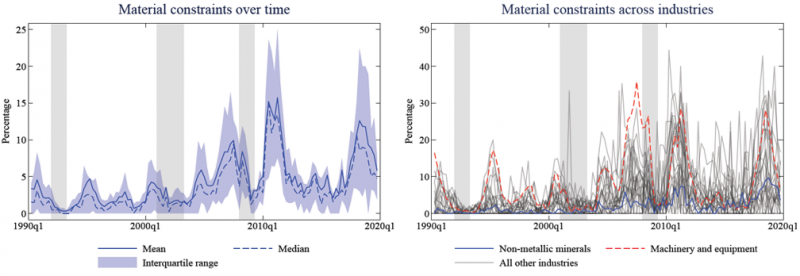
Notes: Figure 1 shows the fraction of firms reporting material constraints in a given industry over time. On the left-hand side we plot the mean (blue line) and median (blue dashed line) shares across industries together with the inter-quartile range (blue shaded region). On the right-hand side we plot the fraction of material constrained firms for all industries in our data (grey lines). The blue and red dashed line depict the industries with the lowest (Non-metallic minerals) and highest (Machinery and equipment) volatility. Grey shaded areas indicate recessionary periods in Germany as dated by the German council of economic experts.
This reasoning is prevalent, both at central banks and in the academic literature (see for example Corrado and Mattey (1997) or Stock and Watson (1999)). Shapiro (1989) cites FOMC members arguing that “[…] the uncertainties in the outlook for inflation were compounded by the prospect that, with production resources at or close to full capacity, even small differences in demand pressures could have a disproportionate effect on the actual rate of inflation next year.” More recently, in its monetary policy report the Bank of England (Bank of England, 2020) argued that “the increase in spare capacity [due to the Covid-19 related shutdowns] is likely to weigh on domestic prices.” A recent academic literature argues that capacity constraints are crucial to explain different business cycle facts jointly (Kuhn and George, 2019) and that capacity utilization is a sufficient statistic for the curvature of the supply curve (Boehm and Pandalai-Nayar, 2022). At the same time, low levels of capacity utilization are a widely accepted measure of slack that leaves room for demand stimulus (Morley and Piger, 2012; Fazzari et al., 2015; Ghassibe and Zanetti, 2022).
The supply-chain view on supply constraints relates less to idle production units or unemployed workers, but more directly to a lack in inputs such as material or intermediate goods that constrain production. To explore direct measures of input constraints, we use firm-level data from the ifo Business Survey (ifo-BCS), a representative survey of German firms in the manufacturing sector.1 In particular, firms are asked at a quarterly frequency if their current production is limited due to input or material shortages. We restrict ourselves to the sample period 1990 to 2019 in our main analysis to exclude the many particularities of the Covid-19 induced recession. Figure 1 shows our measure of input constraints over time and across sectors. At an aggregate level the fraction of firms reporting material shortages is pro-cyclical, but with substantial heterogeneity at the sectoral level. Especially during the 1990s, a large number of industries does not report material constraints at all. Over time material constraints become more common across industries as the lower quartile of the industry distribution increases from zero before 2005 to about two percent thereafter, even before the Covid-19 crisis. Furthermore, sectors differ in their sensitivity to the business cycle. While some sectors exhibit large business cycle swings in their reported material constraints, other sectors fluctuate only little and not all sectors face peaks in their material constraints simultaneously.
Exploring the firm level dimension of the data, we study the persistence of input constraints at an individual level. The distribution of the length of sustained periods of being input constrained is right skewed, with a mean of about five quarters and a median of about two quarters. By means of a Markov transition matrix, we estimate the probability to become input constrained to be just three percent. Once firms become input constrained, they remain constrained with a probability of about fifty percent. Hence, input constraints have not been very persistent.
The ifo-BCS also asks firms to state their current capacity utilization rate.2 We document that the level of capacity utilization alone is not informative about a firms’ input constraints. This is illustrated in the left-hand side graph of Figure 2 which compares the histogram for all firms (blue) with the histogram of input constrained firms (red). There is no difference between the two groups. Hence, input constraints can bind at low levels of utilization. The reason is that firms need material or intermediate inputs to operate their machinery at full capacity. If there is enough material, firms can easily adjust their utilization to meet demand. By contrast, if material is not available, firms cannot fully utilize their machinery. Hence, even if demand is not excessively high, firms can be constrained by their inputs, albeit operating at low utilization rates. Following this reasoning, low utilization rates are not an unambiguous sign of economic slack. Conversely, high utilization rates only indicate capacity constraints but not necessarily input constraints. In the paper we back this result based on several regressions controlling for different fixed effects and other covariates. We confirm the results including the recent Covid crisis in our sample. The distinction between input and capacity constraints at the firm level translates into weak correlation between capacity utilization and input constraints at the aggregate level as is shown in the right-hand side graph of Figure 2.
Figure 2
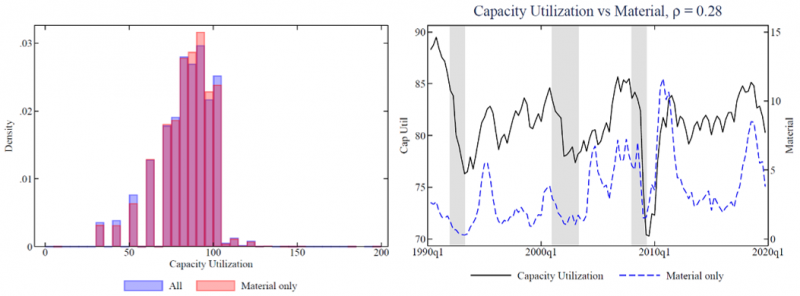
Notes: Figure 2 shows to what extent capacity utilization is a suitable measure of material constraints. On the left-hand side we show histograms of capacity utilization rates for all firms in our sample from 1990 to 2019. The blue histogram shows the utilization rates for all firms whereas the red histogram shows the capacity utilization rates of firms that report material constraints (but no excess demand). On the right-hand side we plot both the average capacity utilization rate from all firms (black line, left scale) and the share of firms that report material constraints, but no excess demand, (blue dashed line, right scale) over time. The correlation between the two series is 0.28. Grey shaded areas indicate recessionary periods in Germany as dated by the German council of economic experts.
How do supply constraints propagate monetary policy shocks and does the distinction between input constraints and capacity constraints matter for the answer? The ifo-BCS asks firms about their qualitative price and production decisions, i.e., whether their producer price and production increased, decreased, or was left unchanged in the previous month. We run Jorda (2005)-type local projections in a panel framework in which (cumulative) pricing and production decisions are regressed on high-frequency identified monetary policy shocks provided by Jarocinski and Karadi (2020) which are interacted with a measure of supply constraints.
Figure 3 shows impulse responses of firms’ cumulative price changes (left column) and cumulative production changes (right column) to expansionary monetary policy shocks. Red lines represent responses for material-constrained firms, blue lines represent responses of unconstrained firms. Shaded areas represent one and two standard deviation confidence bands. In the first row we compare firms that operate at low capacity utilization rates, in the second row we compare firms that operate at high utilization rates. The left column documents a substantial difference in the dynamics of cumulative price changes for input constrained firms compared to unconstrained firms. On net, constrained firms immediately increase their prices in response to the expansionary monetary policy shock. This effect is constant for the first eight quarters after the shock hits. By contrast, unconstrained firms hardly change their prices on net in the first two quarters after the shock hits and then start to increase their prices more frequently with a peak response at eight periods.
Figure 3
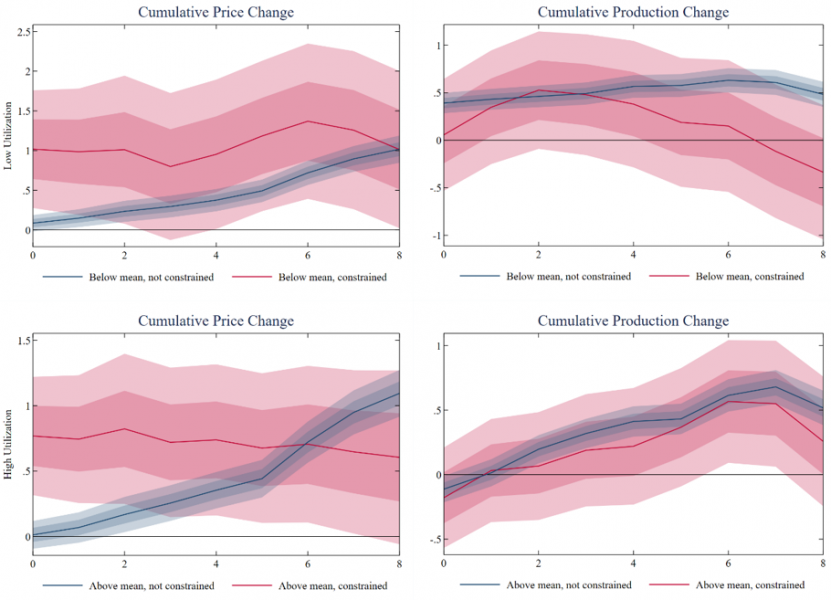
Notes: Figure 3 plots impulse response functions of material constrained (red lines) and non-material constrained (blue lines) firms. Impulse-responses are smoothed by means of a moving average. Shaded areas represent one and two standard deviation confidence bands, standard errors are clustered at the firm level. In column 1 we plot price responses, in column 2 we plot production responses. In the first row we compare the impulse response functions for firms that operate at low utilization rates, in the second row we compare the impulse response functions for firms which operate at high utilization rates. All responses are estimated within one set of local projections, in which we interact the monetary policy shock with dummy variables that indicate if a firm operates at high or low utilization rates and reports, at the same time, material constraints or not. The monetary policy shock is the high-frequency identified pure monetary policy shock provided by Jarocinski and Karadi (2020). The sample runs from 1999 to 2019.
The responses of constrained and unconstrained firms show comparable dynamics with respect to production decisions (right column of Figure 3). The cumulative production change of unconstrained firms is significantly positive over the first eight periods following the shock. The output response of material-constrained firms is statistically indistinguishable from zero. As the results show, monetary policy faces a much more adverse inflation-output tradeoff in the presence of input constraints compared to a situation without constraints.
The distinction between input constraints and capacity constraints is crucial for the propagation of monetary policy shocks. We observe different reactions of firms between material and non-material constrained firms irrespective of their level of capacity utilization. We compare the responses of firms with or without input constraints that operate at high or low utilization rates. Our baseline finding of a larger cumulative price increase for input-constrained compared to input-unconstrained firms after an expansionary monetary policy shock holds irrespective of the level of capacity utilization. From this we conclude that input constraints are the crucial supply constraint that matters for the propagation of monetary policy shocks, especially with respect to prices.
We argue that supply constraints can refer to either constrained inputs or constrained capacity. Input constraints and capacity constraints do not measure the same aspect of supply constraints. Input constraints refer closely to supply chain disruptions, while capacity constraints describe situations of unexpected excess demand. We show that input-constraints in firms matter strongly for the price setting of firms. Input constraints have been transitory before the Covid-19 induced recession which may support the recommendation to be careful with contractionary monetary policy in this situation (see, e.g., Caballero and Simsek (2022)).
We then estimate the costs of not rising interest rates which matter for the assessment of optimal monetary policy as performed by Caballero and Simsek (2022) or Fornaro and Wolf (2022). Policy makers should pay attention to input constraints as they propagate inflation much more strongly in response to expansionary monetary policy shocks, while output rises even less compared to a situation without constraints. Similarly, inflation would decrease strongly if contractionary action was taken by the central bank when supply constraints bind.
Moreover, our results imply that monetary policy makers should be cautious in interpreting low utilization rates as idle resources as we show that expansionary monetary policy shocks can lead to higher price reactions of firms if inputs-constraints bind while utilization rates are low.
Balleer, A. and Noeller, M., 2023, “Monetary policy in the presence of supply constraints: Evidence from German firm-level data”, CESifo Working Paper No. 10261.
Bank of England, 2020, Monetary Policy Report August 2020.
Boehm, C. E. and Pandalai-Nayar, N., 2022, “Convex Supply Curves”, American Economic Review, 112 (12), 3941-69.
Caballero, R. J. and Simsek, A., 2022, “A note on temporary supply shocks with aggregate demand inertia”, NBER Working Paper No. 29815.
Corrado, C. and Mattey, J., 1997, “Capacity Utilization”, Journal of Economic Perspectives, 11 (1), 151-167.
Fazzari, S. M., Morley, J. and Panovska, I., 2015, “State-dependent effects of fiscal policy”, Studies in Nonlinear Dynamics & Econometrics, 19 (3), 285-315.
Fornaro, L. and Wolf, M., 2022, “The scars of supply shocks: Implications for monetary policy”.
Ghassibe, M. and Zanetti, F., 2022, “State dependence of fiscal multipliers: The source of fluctuations matters”, Journal of Monetary Economics, 132, 1-23.
Jaorcinski, M. and Karadi, P., 2020, “Deconstructing monetary policy surprises – the role of information shocks”, American Economic Journal: Macroeconomics, 12 (2), 1-43.
Jorda, O., 2005, “Estimation and Inference of Impulse Responses by Local Projections”, American Economic Review, 95 (1), 161-182.
Kuhn, F. and George, C., 2019, “Business cycle implications of capacity constraints under demand shocks”, Review of Economic Dynamics, 32, 94-121.
Morley, J. and Piger, J., 2012, “The asymmetric business cycle”, Review of Economics and Statistics, 94 (1), 208-221.
Shapiro, M. D., 1989, “Assessing the Federal Reserve’s measures of capacity and utilization”, Brookings Papers on Economic Activity, 1989 (1), 181-241.
Stock, J.H. and Watson, M. W., 1999, “Forecasting inflation”, Journal of Monetary Economics, 44 (2), 293-335
The ifo Business Survey forms the basis of the ifo Business Climate index, a much-followed leading indicator for the German economy, see the most recent release here.
This is the information underlying the “Joint harmonised EU programme of business and consumer surveys” which provides capacity utilization rates for European countries.