menu
close

Author(s):

Jan Kakes | De Nederlandsche Bank
Jan Willem van den End | De Nederlandsche Bank

Keywords:

Monetary policy , Quantitative easing , Sovereign risk , Sovereign spreads

JEL Codes:

E52 , E58 , G23

We present a novel metric for financial fragmentation in the euro area, based on the higher moments of the distribution of sovereign spreads relative to macro-financial fundamentals. The metric shows that the observed moments of the spread distribution occasionally overshot their fundamentals-based benchmarks until 2018, which suggests that markets were sometimes fragmented. The observed moments have hardly exceeded fundamentally justified levels in recent years, however, including the period with rising interest rates. The latter may be attributed to backstop facilities of the European Central Bank (ECB), such as the Transmission Protection Instrument (TPI).

Introduction

The Eurosystem’s role to address financial fragmentation has gained new impetus with the introduction of its Transmission Protection Instrument (TPI) in July 2022. This backstop tool has been designed to counteract a deterioration in financing conditions that is not warranted by country-specific fundamentals, to safeguard the monetary transmission mechanism. Activation of TPI by the ECB will be based on a range of market and transmission indicators, of which sovereign spreads are a key element.

Unwarranted spread widening, which would signal fragmentation, should be distinguished from justified or fair spread widening, which reflects cross-country differences in macro-economic fundamentals. Such fair market pricing is more likely in orderly market conditions, while unwarranted spread widening is often associated with market dysfunction or excessive speculation. Conceptually, fragmentation is similar to (the absence of) financial integration or the law of one price. In the empirical literature, fragmentation is typically measured by spread differentials that cannot be explained by economic fundamentals. To control for these fundamentals, previous studies compare countries with the same credit rating or, alternatively, explain interest rate spreads by macro-financial variables such as GDP growth and debt ratios.1 Any remaining spread difference would then be attributed to non-fundamental fragmentation.

We add to the literature by modelling the distribution of EMU countries’ sovereign spreads across time as a function of the distribution of macro-economic variables. This results in an area-wide assessment of fragmentation, which supplements country-by-country spread deviations.

Distribution of sovereign spreads over time

We characterize the distribution of sovereign spreads by its higher-order moments: standard deviation, skewness and kurtosis (or tailedness). The higher moments of the spread distribution are explained by similar moments of variables that reflect countries’ macro-economic and financial fundamentals; the unexplained part is interpreted as (unwarranted) fragmentation. Our specifications allow for time variation in this relationship, while controlling for market sentiment. This is conducted by a novel application of fixed and time-varying parameter regressions (see Kakes and Van den End, 2023). Drivers of such unwarranted fragmentation – speculation, or market dysfunction – are likely to affect several countries simultaneously due to common characteristics or spillovers.

A higher standard deviation means that financial conditions are more dispersed across EMU member states. A right-skewed distribution implies that a cluster of countries is faced with higher spreads than other countries, so monetary policy may have asymmetric effects. A high kurtosis implies that sovereign spreads are at extreme (low or high) levels, displaying fat-tailedness which can be associated with stressed market conditions and elevated risk aversion. The higher moments of the spread distribution can thus indicate financial fragmentation and uneven monetary transmission across the euro area.

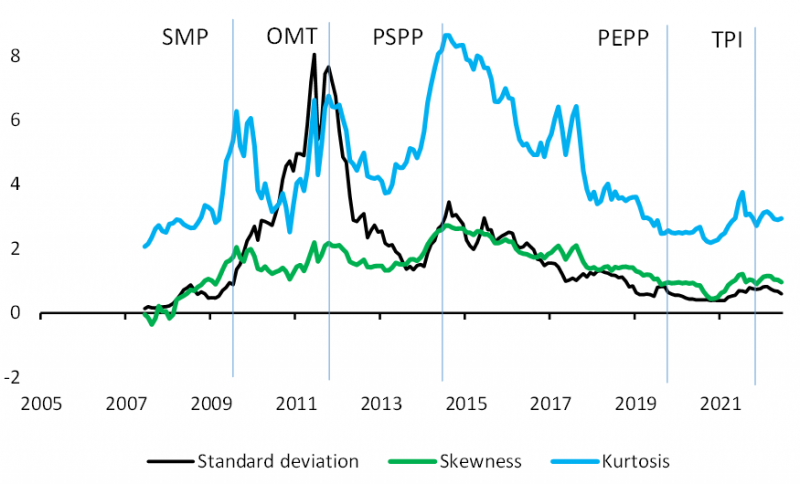
Figure 1 shows how the moments of the spread distribution have evolved since 2007.2 Spread dispersion, measured by the standard deviation, peaked in the 2012 sovereign debt crisis. Skewness showed an upward trend until 2015 and subsequently declined. Kurtosis peaked in 2010, 2012 and 2015 and has been significantly higher than 3 (the level for a normal distribution) most of the time. At these points in time the ECB announced or activated asset purchase programmes, such as the Securities Markets Programme (SMP), Outright Monetary Transactions (OMT) and Public Sector Purchase Programme (PSPP). This suggests a relationship between asset purchases and the sovereign spread distribution. Figure 1 shows that the peaks of the three moments of the spread distribution occasionally coincide, but also differ across time. This means that the standard deviation, skewness and kurtosis reflect their own specific information about sovereign credit risk, particularly until 2015. Since then, the three moments share a common downward trend.

Figure 1: Higher moments of sovereign spread distribution and ECB programmes
 width=
Note: the vertical lines show the announcement dates of the ECB’s asset purchase programmes: Securities Markets Programme (SMP), Outright Monetary Transactions (OMT), Public Sector Purchase Programme (PSPP), Pandemic Emergency Purchase Programme (PEPP) and Transmission Protection Instrument (TPI).

To identify non-fundamental spread movements, we perform a two-stage regression approach. In the first step, we regress the higher moments of the spread distribution – i.e. the standard deviation, skewness and kurtosis – on similar moments of macro-economic variables and on market sentiment variables. The response of the spread moments to moments in the explanatory macro-economic variables is assumed to be fair as they represent countries’ fundamentals. In the second step, we use the estimated regression coefficients of the fundamental variables to calculate a model-based benchmark for the spread moments. Importantly, in the second step we exclude any possible impact of market sentiment, which we interpret as a non-fundamental driver, by setting these coefficients to zero. We also allow for time-variation by estimating the regressions as five-year rolling windows, as previous studies have documented that the impact of macro-fundamentals changes over time.3

Main findings

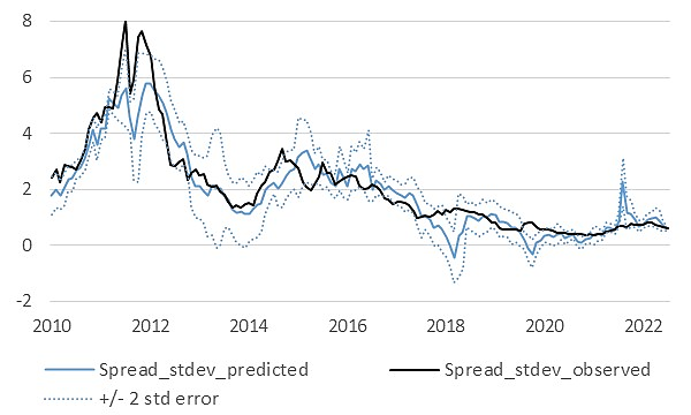
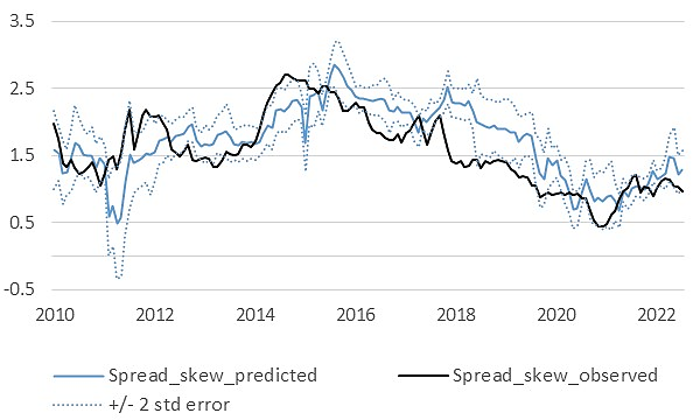
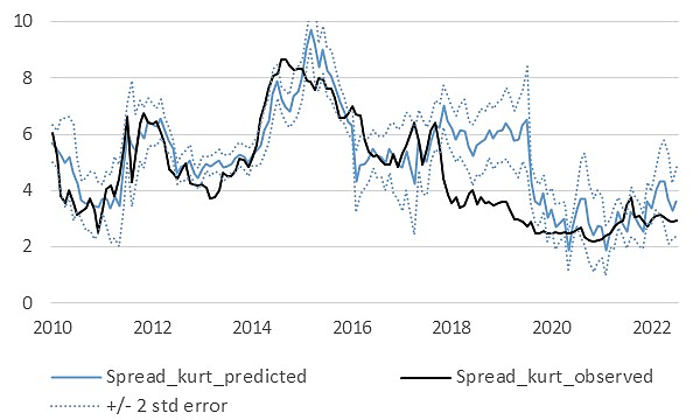
Figure 2 compares the model-based (predicted) spread moments, which reflect fundamentals, with the actually observed moments. If the actual spread moments exceeds the confidence interval of the model-based benchmark, this would indicate non-fundamental spread widening or fragmentation.

In 2012, the standard deviation clearly exceeded the model-based range and skewness also rose significantly to the upper confidence bound, while the kurtosis remained inside the range defined by fundamentals. Hence, two of the three moments imply that spread differentials were driven by non-fundamental factors and markets were fragmented in the 2012 sovereign debt crisis. With hindsight, this justifies the announcement of the OMT programme –following Draghi’s “Whatever it takes” speech – which succeeded in reducing sovereign spreads.

In the first half of 2015, the observed moments again exceeded the upper bound of the model-based range for all three higher moments. This reflects the impact of the financial crisis in Greece, culminating in a default on its IMF loan, a deadlock in the negotiations with official creditors and the introduction of capital controls in June 2015.

Since 2018, the observed moments have hardly exceeded the model-based range. This suggests that there has been no obvious fragmentation across EMU countries and that spread differences mostly reflect differences in macro-economic fundamentals. Rather, the observed spread moments have often been below the model-based range, which would point at a lack of differentiation in risk pricing on financial markets. It may reflect that investors assume that the default risk of countries is lower than the fundamentals indicate, possibly because of the presence of (central bank) backstop facilities. Recent research indicates that investors attach value to these backstops for tail risk in sovereign bond markets (Broeders et al., 2023).

Figure 2: Predicted and observed higher moments of sovereign spread distribution
A Standard deviation
 width=

B Skewness
 width=

C Kurtosis
 width=

Note: results of regression models with 5 years (60 months) moving windows.

The COVID-19 pandemic in 2020-2021 did not lead to an increase of observed and predicted increases in the spread moments. This may be attributed to the fact that the pandemic was a common shock hitting all EMU economies in a similar way. As a result, dispersion, skewness and kurtosis of the distribution of macro-fundamentals in general did change much. Like other central banks, the ECB immediately reacted to the COVID crisis with large-scale interventions that were motivated by the worsening economic outlook as well as rising market turbulence. This swift policy response may have prevented fragmentation of sovereign debt markets.

The 2022 energy crisis is reflected by an increase in the predicted dispersion, particularly for the standard deviation, which briefly spiked. This can be attributed to the asymmetric impact of the energy shock, which is also reflected by the uneven distributions of several macro-financial variables of EMU countries (particularly GDP growth, inflation, current account balance and policy uncertainty).

Since the start of the monetary policy hiking cycle in July 2022, the model-implied skewness and kurtosis have increased somewhat, but the observed moments have remained within or even below the confidence bounds. This indicates that the ECB’s policy rate hikes (and the discontinuation of net asset purchases) did not lead to fragmentation, likely helped by the presence of ECB backstop facilities, in particular the PEPP and the TPI. These programmes are available to counteract financial fragmentation through targeted asset purchases.

We repeated the analysis with fixed-parameter models, estimated over the full sample period rather than rolling regressions. In general, this leads to more pronounced deviations of the observed moments relative to the model-based range, but not to different conclusions. We also considered the impact of monetary policy variables on the outcomes. The impact of monetary policy shocks and Target2 balances on the spread moments is very limited, but there is some evidence that the announcement of asset purchase programmes had an impact on the deviation between the observed and model-based moments of spreads. In addition, monetary policy may play an indirect role through its impact on macro-financial variables that are included in our baseline regressions.

Concluding remarks

Our results shows that most of the time, the higher moments of the sovereign spread distribution can be explained by the moments of macro-financial fundamentals. The main exceptions are in 2012 (euro area debt crisis) and 2015 (Greek default), when our model is unable to fully explain the rising dispersion in spreads. With hindsight, these non-fundamental changes in the moments of sovereign spreads in 2012 justified the announcement of the OMT programme by the ECB. The value-added of our metric is that it provides a single, area-wide measure of financial fragmentation, which exploits the cross-country and cross-time information contained in the higher moments of sovereign spreads. It supplements existing approaches that typically focus on spreads of individual countries relative to fundamentals (but could miss the overall picture) and high-frequency developments that could provide a first signal (but are harder to control for fundamentals). Our metric could be part of a suite of indicators, which also cover country-specific and high-frequency indicators of financial fragmentation in sovereign bond markets.

References

Baele, L, A. Ferrando, P. Hördahl, E. Krylova and C. Monnet (2004), Measuring financial integration in the euro area, ECB Occasional Paper, 14.

Broeders, D., L. de Haan and J. W. van den End (2023), How QE changes the nature of sovereign risk, Journal of International Money and Finance, forthcoming.

Ceci, D. and M. Pericoli (2022), Sovereign spreads and economic fundamentals: an econometric analysis, Occasional Paper, 713, Bank of Italy.

De Grauwe, P. and Y. Ji (2022), The fragility of the Eurozone: has it disappeared?, Journal of International Money and Finance, 120, 1-9

De Santis, R., (2018), Unobservable country bond premia and fragmentation, Journal of International Money and Finance, 82, 1-25.

Eijffinger, S. C. W. and M. Pieterse-Bloem (2022), Eurozone Government Bond Spreads: A Tale of Different ECB Policy Regimes, CEPR Discussion Paper, 17533.

Eisenschmidt, J., D. Kedan and R. Tietz (2018), Measuring fragmentation in the euro area unsecured overnight interbank money market: a monetary policy transmission approach, ECB Economic Bulletin, 5/2018.

Garcia-de-Andoain, C., P. Hoffmann and S. Manganelli (2014), Fragmentation in the euro overnight unsecured money market, ECB Working Paper, 1755.

Horny, G., S. Manganelli and B. Mojon (2016), Measuring Financial Fragmentation in the Euro Area Corporate Bond Market, Banque de France Working Paper, 582.

Kakes, J. and J.W. van den End (2023), Identifying financial fragmentation: do sovereign spreads in the EMU reflect differences in fundamentals?, DNB Working Paper No. 778.

Mayordomo, S., M. Abascal, T. Alonso and M. Rodriguez-Moreno (2015), Fragmentation in the European interbank market: Measures, determinants, and policy solutions, Journal of Financial Stability, 16, 1-12.

Zaghini, A. (2016), Fragmentation and heterogeneity in the euro-area corporate bond market: Back to normal?, CFS Working Paper, 530.

  • 1.

    See e.g. Baele et al. (2004), De Santis (2018), Eisenschmidt et al., (2018), Garcia-de-Andoain at al. (2014), Horny et al. (2016), Mayordomo et al. (2015), Zaghini (2016), Ceci and Pericoli (2022).

  • 2.

    Our dataset includes the sovereign spreads and macro-economic variables of 11 EMU countries over the 2005m9-2023m2 sample period.

  • 3.

    See e.g. De Grauwe and Ji (2021), Eijffinger and Pieterse-Bloem (2022).

About the authors

Jan Kakes

Jan Kakes is a senior economist in the Financial Markets division of De Nederlandsche Bank. His current research interests include monetary operations and financial markets. He holds a PhD from the University of Groningen.

Jan Willem van den End

Jan Willem van den End is a senior economist in the Economics and Research division of De Nederlandsche Bank (DNB) and lecturer of Finance, Vrije Universiteit Amsterdam, the Netherlands. He holds a Ph.D. in Economics from the University of Groningen.

More on these topics

Tags: