This Policy Brief is based on European Central Bank Working Paper Series No 2905. The views expressed are those of the authors and do not necessarily reflect those of the ECB.
High gas prices were on everyone’s minds when the European energy crisis caused an unprecedented rise in inflation. Based on a recent working paper, we explore the drivers of gas prices during the recent energy crisis and discuss how different types of gas shocks transmit to inflation in the euro area. We find that a combination of drivers contributed to the gas market rally, with a rebound in demand driving the initial increase after the Covid-19 lockdowns, and supply-side disruptions taking over afterwards – particularly when Russia invaded Ukraine. We show that different types of gas price shocks have different economic implications. Particularly gas supply disruptions may have persistent effects on inflation, as they affect underlying inflation, and these effects might even be amplified when the labour market is tight, as has been the case after the pandemic. Our results carry important lessons for policy makers; contributing to understanding the recent inflation surge and highlighting that central banks cannot always “look through” energy supply shocks.
How do gas price developments feed through inflation in the euro area? Addressing this question is not straightforward as the type of shock driving gas prices is crucial for knowing the answer. For the oil market, the complexity behind its impact on the real economy has been extensively documented (e.g. Killian, 2009; Peersman and Van Robays, 2009; Baumeister and Hamilton, 2019; Caldara et al. 2019; Känzig, 2021). For European gas prices, by contrast, the literature is still in its infancy (Casoli et al., 2022; Alessandri and Gazzani, 2023). We help plugging that gap by identifying key structural shocks in the European gas market and estimating the pass-through of these shocks to inflation, and this in a set-up that allows us to dissect the transmission channels as well as potential non-linearities in the effects (Adolfsen et al. 2024).
We use a two-step approach to identify gas price shocks and estimate inflation pass-through. In a first step, we introduce a novel Bayesian VAR model to identify structural shocks in the European gas market. The model is inspired by the oil market literature (e.g. Kilian and Murphy, 2012; Peersman and Van Robays, 2009), but tailored to the European gas market. That is necessary as the gas market works differently than the oil market, with the most notable difference that the gas market is highly regionalised whereas the oil market is global. Three shocks are identified: First, a gas supply shock where a price increase is caused by lower supply. Second, a positive demand shock to prices driven by higher economic activity. Third, an inventory demand shock where higher demand is driven by a precautionary build-up of gas inventories. And finally, a fourth shock which captures idiosyncratic factors that also shape gas prices such as weather developments. In a second step, we use the identified shocks to analyse inflation transmission using a state-dependent local projections setup (Jordà, 2005; Cloyne et al., 2023).
The gas market rally was caused by a combination of demand and supply factors, with supply-disruptions taking over as the main driver around the Russian invasion of Ukraine (see Figure 1). After the end of the first Covid-19 lockdown, gas price increases were mainly driven by recovering demand (yellow bars). Since the summer of 2021, supply shocks started playing a more prominent role (blue bars) reflecting that Russia started to reduce gas deliveries to Europe. This culminated in the summer of 2022, a few months after Russia had started its attack on Ukraine and when Russia stopped delivering gas to Europe via the Nord Stream 1 pipeline. Inventory demand shocks also contributed (orange bars), albeit to a smaller extent than supply shocks. This was especially the case ahead of the 2022-23 winter, where European countries took precautionary measures in preparation for a winter without Russian gas, and inventories were filled up to comply with the new EU gas storage target. Taken together, supply and inventory demand shocks accounted for more than two-thirds of the record-increase in gas prices in 2022.
Figure 1: Historical decomposition of gas prices in Europe
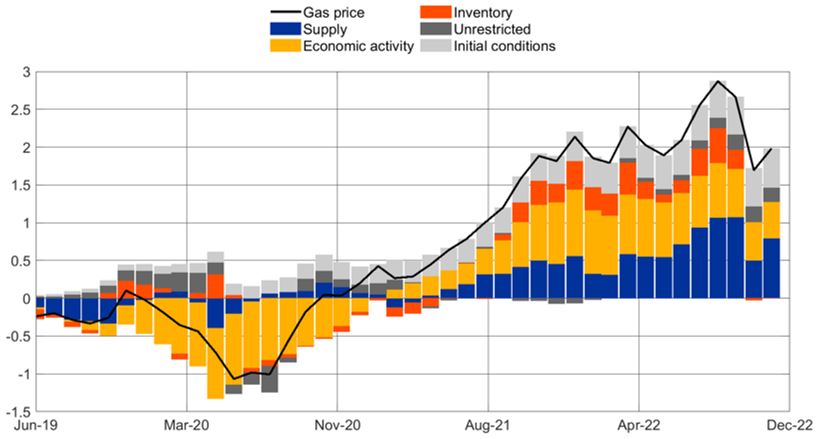
Notes: The chart reports the historical decomposition of accumulated log-differences of the euro area gas price. The decomposition is based on the Bayesian VAR model from Adolfsen et al. (2024).
Gas supply shocks can lead to significant and persistent increases in inflation in the euro area. When a supply shock hits the European gas market, it may lead to persistent increases in gas prices of up to 12 months, which is also the case when gas prices are driven by higher economic activity. However, if inventory demand drives up gas prices, the effect typically dies out within 3 months. The difference in persistence might translate into a different pass-through of these shocks to inflation, with the supply shock having the most persistent impact on inflation while inventory demand shocks do not affect inflation because of their transitory nature (see Figure 2). Zooming in on the inflationary implications of gas supply and economic activity shocks, we observe that it takes time for the shocks to feed through to headline inflation. But at the peak, the effect on inflation is higher than what would be envisaged mechanically by the weight of gas in the consumption basket. At the peak after 14 months, the increase in inflation is 0.85% after a gas supply shock, which is more than twice as high as the mechanical effect of 0.40% that would follow directly from the gas price shock used to generate the inflation response and the weight of gas in the inflation index.
Figure 2: Pass-through of different gas price shocks to inflation
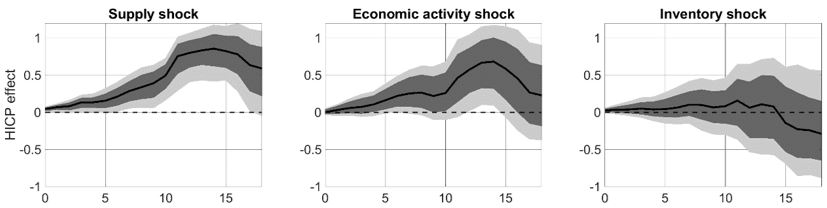
Notes: The figure shows impulse responses in percent to a gas supply shock identified as in Adolfsen et al. (2024) up to 18 months after the shock. Impulse response functions are estimated with local projections. The black solid line is the median response while shaded areas report 68% and 90% confidence intervals based on the posterior distribution of the shocks. “HICP” refers to the Harmonised Index of Consumer Prices for the euro area.
Figure 3: Pass-through of a gas supply shock to inflation components
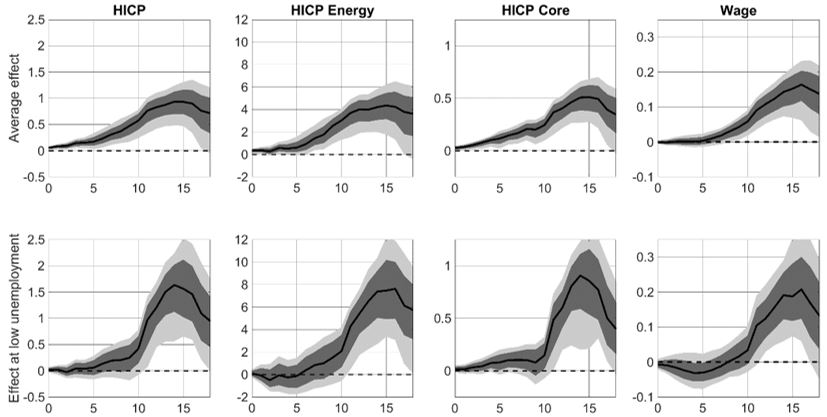
Notes: The figure shows impulse responses in percent to a gas supply shock identified as in Adolfsen et al. (2024) up to 18 months after the shock and conditional on controlling for the unemployment rate. Impulse response functions are estimated with state-dependent local projections. The first row shows the average effect of the shock, while the second row shows the effect when unemployment is one standard deviation below the average. The black solid line is the median response while shaded areas report 68% and 90% confidence intervals based on the posterior distribution of the shocks. “HICP” refers to the Harmonised Index of Consumer Prices for the euro area.
When focusing on shocks to gas supply in Figure 3, we find that the persistent and high inflation response comes from spillovers to underlying inflation. The direct pass-through to the energy component of inflation (Figure 3, upper second-left panel) is delayed and remains incomplete. At the peak, only around one quarter of the increase in wholesale gas prices has been passed on to consumers reflecting a combination of different rigidities in the retail market for gas. Importantly, core inflation also rises in response to the gas supply shock (Figure 3, upper second-right panel). This mainly follows from higher energy input costs that push firms to adjust prices across the economy. Wages also increase as workers require compensation for the increase in consumer prices (Figure 3, upper right panel). The wage increase is delayed and accounts for around 18% of the peak in the inflation rate, implying a real income loss but further upward pressure on underlying inflation.
Non-linearities may amplify the inflation response. The feedthrough of gas supply shocks to inflation may even be larger in periods when the labour market is tight, as experienced in the euro area following the pandemic. In periods with low unemployment, we find that the inflation response to a gas supply shock may be around 1.5 times higher, partly because wages respond more strongly (Figure 3, lower panel).
So, what do we learn from the recent European energy crisis? Our main takeaway is that the inflationary effects of gas supply shocks likely went beyond the direct effects on gas prices, as they transmitted to the wider economy given their persistence and the prevailing tightness in the labour market. The pass-through to underlying inflation calls for central bank awareness; our results suggest that for some types of energy supply shocks, monetary policy action is warranted.
Adolfsen, J.F., Ferrari Minesso, M., Mork, J.E., and Van Robays, I. “Gas price shocks and euro area inflation”. Working Paper Series 2905, European Central Bank, 2024.
Alessandri, P. and Gazzani, A. G. “Natural Gas and the Macroeconomy: Not All Energy Shocks Are Alike”. Banca d’Italia Working Papers 1428, 2023.
Baumeister, C. and Hamilton, J. D. “Structural interpretation of vector autoregressions with incomplete identification: Revisiting the role of oil supply and demand shocks”. American Economic Review, 109(5):1873–1910, 2019.
Caldara, D., Cavallo, M., and Iacoviello, M. “Oil price elasticities and oil price fluctuations”. Journal of Monetary Economics, 103:1–20, 2019.
Casoli, C., Manera, M., and Valenti, D. “Energy shocks in the euro area: disentangling the pass-through from oil and gas prices to inflation”. FEEM Working Paper, (045), 2022.
Cloyne, J., Jordà, Ò., and Taylor, A. M. “State-dependent local projections: Understanding impulse response heterogeneity”. National Bureau of Economic Research Working Paper, (30971), 2023.
Jordà, Ò. “Estimation and Inference of Impulse Responses by Local Projections”. American Economic Review, 95(1):161–182, 2005.
Känzig, D. R. “The macroeconomic effects of oil supply news: Evidence from OPEC announcements”. American Economic Review, 111(4):1092–1125, 2021.
Kilian, L. “Not all oil price shocks are alike: Disentangling demand and supply shocks in the crude oil market”. American Economic Review, 99(3):1053–1069, 2009.
Kilian, L. and Murphy, D. P. “Why agnostic sign restrictions are not enough: understanding the dynamics of oil market var models”. Journal of the European Economic Association, 10(5):1166–1188, 2012.
Peersman, G. and Van Robays, I. “Oil and the euro area economy”. Economic Policy, 24 (60):603–651, 2009.