This policy brief is based on BIS Working Paper, No 1258. The views expressed in this brief do not necessarily reflect those of the BIS or Central Bank of Chile. Any errors are my own.
Abstract
Using a unique match of a representative sample of individual borrowers from the Chilean Household Finance Survey and their banking loan records, I show that surveys differ from the credit registry, both in terms of the number of debts reported and their amount. Delinquency status is accurately reported by survey respondents. A substantial fraction of the discrepancies can be explained by rounding error in survey answers.
Household finance surveys are used across many central banks to measure families’ net worth, indebtedness and default risks (Madeira 2022). Currently, according to the OECD Income Distribution Database (IDD), at least 49 countries across all the five continents implement some household finance survey.1 The Survey of Consumer Finances (SCF) of the US is likely to be the oldest ongoing survey, with its first waves dating to the 1960s. Most of these surveys, including the ones for the US, Chile and the eurozone countries (Crespo et al. 2023), follow a similar structure, allowing to study financial wealth, debt and behavior across households in different countries (Annicchiarico et al 2024).
There was a significant expansion in the use of these surveys by central banks after the Great Financial Crisis (GFC) of 2008, which showed household mortgages, debt and consumption frictions to be significant macro-financial risks. These surveys are especially important in countries where non-bank lenders have a substantial presence and where official sources may not measure all the loan obligations of families. Therefore, there is a need for reliable data on households’ net worth and debt obligations.
This paper analyses how household debt compares between household survey self-reported information and administrative bank records for individual families in Chile (Madeira 2025). The study is close to other studies of measurement error in household finance surveys, such as those for Italy (di Salvatore and Moscatelli 2024) and Ireland (Boyd and McIndoe-Calder 2024). This advances upon previous studies, which focused on differences between surveys and registries at a national level (Brown et al 2015, Bover et al 2024) or for individual customers of a single bank (Karlan and Zinman 2008).
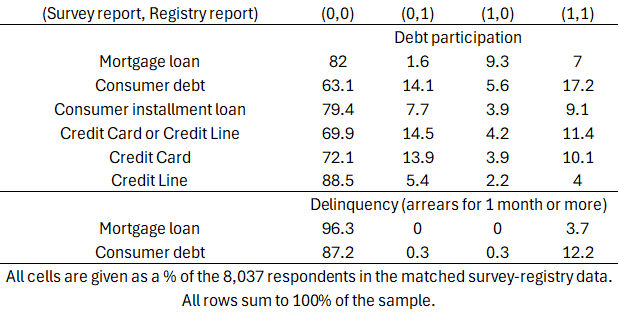
Using a sample with 8,037 matches between survey respondents and their banking loans in the Chilean credit registry, I find that several respondents have debt in the registry which is not reported in the survey, particularly for unsecured consumer debt such as credit cards and lines of credit. There is also a significant fraction of respondents reporting debt in the survey, but which is not in the registry. This could be either because respondents are reporting debts for other household members as their own or because respondents could be reporting debts with non-bank lenders. One good aspect of the household finance survey is that it captures delinquency status quite well, with only a small disparity between arrears information in survey and registry.
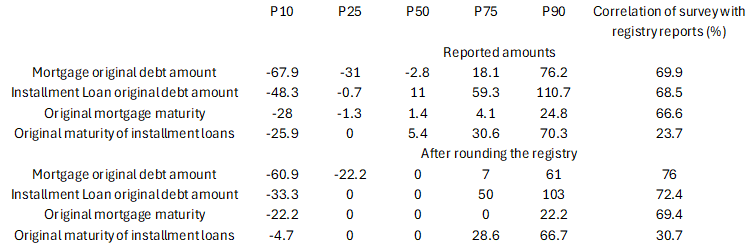
I then study the discrepancy ratio distribution, which is the difference between registry and survey debt reports for each individual divided by the average of the survey and registry values for the same individual. This error ratio definition is naturally defined between -200% and 200%. This discrepancy ratio has the advantage that it includes both differences between loan amounts in the two data sources and also the case in which only one data source has a loan amount while the other data source has no loan. This exercise is done for the matched survey-registry data and also for a version of the matched survey-registry where the registry loans are rounded to a value that is a multiple of 10 to be closer to the survey answers. The reason is that in survey responses the households rarely answer amounts exactly and therefore report numbers such as debts of 100 thousand pesos or 1 million pesos and so on. Rounding of the registry values therefore gives information that is closer to the survey answers of the households.
Table 1. respondents’ debt status in the matched survey-registry data
The results for the distribution of the discrepancy ratio reported in Table 2 show stronger discrepancies for consumer instalment loans than for mortgages, both in terms of loan amount and maturity information. However, a significant part of the discrepancies between the survey and the registry can be explained by situations in which the respondents give a rounded value for their loan (say, a multiple of 10). If one uses a rounded version of the credit registry, then it is possible that between 25% and 50% of the respondents have answers that match the registry quite exactly.
Table 2. percentiles of the discrepancy ratio
(difference between survey and registry divided by the average of both survey and registry) distribution (in %)
I show that surveys differ from the credit registry, both in terms of the number of loans and their amounts, with a substantial degree of heterogeneity. Loan maturities and delinquency are accurately reported by survey respondents. A substantial fraction of the discrepancies can be explained by rounding error in survey answers. Finally, I find that discrepancies are larger when respondents are not the family’s highest-income member.
Household finance surveys are increasingly important in the analysis of borrowers’ behaviors such as delinquency or credit exclusion. Possible solutions to reduce survey misreporting could be to interview more than one household member, especially if there is more than one member that represents a significant share of the household income.
Central banks may also opt for combining survey data with registry reports, which is already done in some countries such as Estonia (Meriküll and Rõõm 2020), Ireland (Boyd and McIndoe-Calder 2024) and Italy (di Salvatore and Moscatelli 2024).
Annicchiarico, Barbara, Rebecca Clipal and Jean Sahuc (2024), “Stylized Facts on Intergenerational Household Finance: A Transatlantic View,” SUERF Policy Brief No 996.
Brown, M., A. Haughwout, D. Lee and W. van der Klaauw (2015), “Do We Know What We Owe? Consumer Debt as Reported by Borrowers and Lenders,” Economic Policy Review, 21(1), 19-44.
Bover, Olympia, Laura Crespo, Sandra García-Uribe, Marina Gomez-García, Paloma Urcelay and Pilar Velilla (2024), “Micro and macro data on household wealth, income and expenditure: comparing the Spanish Survey of Household Finances (EFF) to other statistical sources,” SUERF Policy Brief No 930.
Boyd, Laura and Tara McIndoe-Calder (2024), “Administrative meets survey data: measuring household indebtedness in Ireland,” SUERF Policy Brief No. 915.
Crespo, Laura, Andrej Cupák, Pirmin Fessler, David Loschiavo, Tobias Schmidt, Jirka Slacalek, Jean-Pierre Villetelle (2023), “Household Finance and Consumption Survey (HFCS),” SUERF I NBS I BAFFI Bocconi e-workshop, September 28, 2023.
di Salvatore, Antonietta and Mirko Moscatelli (2024), “Improving survey information on household debt using granular credit databases”, SUERF Policy Brief No 927.
Karlan, D. and J. Zinman (2008), “Lying About Borrowing,” Journal of the European Economic Association, 6(2-3), 510–21.
Madeira, Carlos (2022), “The double impact of deep social unrest and a pandemic: Evidence from Chile,” Canadian Journal of Economics, 55(S1), 135-171.
Madeira, Carlos (2025), “How accurately do consumers report their debts in household surveys?,” BIS Working Papers 1258.
Meriküll, Jaanika and Tairi Rõõm (2020), “Stress Tests of the Household Sector Using Microdata from Survey and Administrative Sources,” International Journal of Central Banking, 16(2), 203-248.
This includes the 23 European countries coordinated by the ECB’s Household Finance and Consumption Network (HFCN) plus other European countries such as Bulgaria, Iceland, Israel, Norway, Poland, Romania, Russia, Sweden, Switzerland, Türkiye, UK; American countries such as USA, Brazil, Canada, Costa Rica, Chile, Colombia, Mexico, Uruguay; Oceanian countries such as Australia, New Zealand; Asian countries such as China, India, Japan and Korea; and African countries such as South Africa.