The views expressed in this policy brief are those of the authors and not necessarily those of the Federal Reserve Bank of Cleveland, the Federal Reserve System, Danmarks Nationalbank or the European System of Central Banks.
This policy brief presents the results of Dietrich et al. (2023). The paper introduces a novel measure of consumer inflation expectations: We elicit and combine inflation forecasts across categories of personal consumption expenditure to form an aggregated measure of inflation expectations. Drawing on nearly 60,000 respondents, our data comprise the early low-inflation environment of the COVID pandemic and the 2021 inflation surge. Conventionally elicited inflation expectations consistently exceed aggregated measures constructed under plausible weighting schemes. Aggregated measures display less disagreement and volatility and are stronger predictors of consumers’ spending plans. The relative informational value of aggregated measures rises with the individual-level gap between conventional and aggregated inflation expectations. Our results chart a new course for designing the measurement of inflation expectations.
Inflation expectations are important for charting the course of monetary policy, and central banks “spend a lot of time watching them” (Powell, 2021). Consumer expectations are of particular interest because they affect households’ consumption-savings decisions and the potential for wage-price spirals. Consumer inflation expectations, however, are notoriously difficult to capture accurately with prevailing survey methods. Many consumers struggle to grasp the concept of inflation; they rely on salient cues when reporting forecasts; and survey responses are vulnerable to a host of cognitive biases (D’Acunto et al., 2021, 2022).
These challenges inherent to the measurement of inflation expectations resonate with the canonical work by Tversky and Kahneman (1974) on heuristics and biases in judgment under uncertainty and the literature on the psychology of human judgment (Fischhoff and Broomell, 2020), and they point to a potential mismatch between human cognition and the demands of conventional elicitation techniques. Conventional techniques aim to elicit aggregate inflation, which is a concept comprising price changes across categories of personal consumption expenditures (PCE). Because the cognitive complexity of decisions is likely to increase in the number of relevant components (Gabaix and Graeber, 2023), one might surmise that it would be harder for an individual to produce an expectation for aggregate inflation than for its category-specific constituent parts.
Our paper, therefore, proposes an alternative approach to measuring inflation expectations, by decomposing aggregate inflation into its more tangible components—price changes for disaggregated categories of goods and services. Accordingly, we develop a survey that elicits inflation forecasts for the full range of PCE categories. This granular elicitation allows us to construct a novel measure of aggregated consumer inflation expectations, by combining category-specific forecasts. We find that aggregated inflation expectations are not only less noisy than the conventional measure of aggregate inflation expectations, but they also predict planned consumer spending better. These properties hold consistently across respondents in the population. Arguably, therefore, aggregated inflation expectations yield a more informative representation of consumers’ effective beliefs about future inflation—that is, the beliefs on which they make future consumption plans—highlighting the appeal of aggregated inflation expectations for policymakers who aim to elicit decision-relevant beliefs across the population.
We collected these expectations from almost 60,000 US consumers in a nationally representative survey, at a daily frequency between July 2020 and August 2022, as part of the Federal Reserve Bank of Cleveland’s daily survey of consumers (Knotek et al., 2020). The survey measures 12-month- ahead inflation expectations in two distinct ways. First, it elicits aggregate inflation expectations following the conventional point-estimate approach from the New York Fed’s Survey of Consumer Expectations (SCE). Second, the survey asks consumers about inflation expectations for each of 11 consumption categories, covering the entire range of PCE. In doing so, we match closely the conventional question format of the SCE for aggregate inflation expectations. While the SCE also elicits inflation expectations for several salient products—such as gasoline, housing, and groceries— to the best of our knowledge, our survey is the first to yield a data set of comprehensive category-specific inflation expectations. In addition, we also ask survey participants about their own personal consumption expenditures and the relative importance of the consumption categories, along with their consumption plans.
Figure 1 displays the daily time series average of survey responses, for aggregate inflation expectations (black line) and category-specific expectations. We document that aggregate expectations exceed any category-specific expectations. Consequently, for a representative agent, there is no possible linear combination of category-specific expectations with non-negative aggregation weights that maps category-specific expectations into aggregate expectations.
Figure 1: Category-specific Inflation Expectations
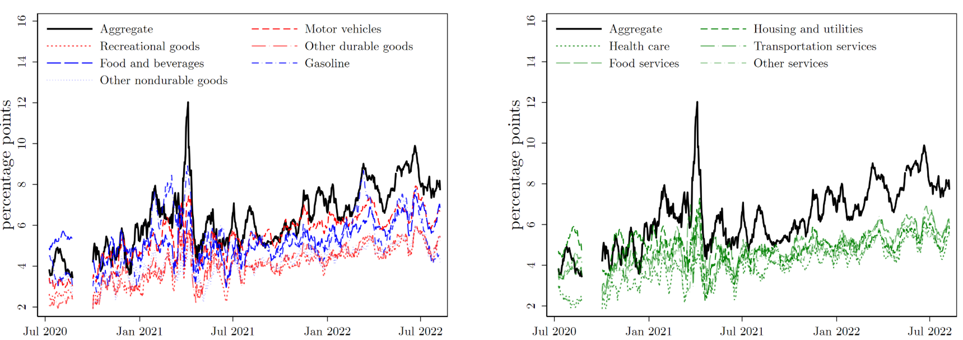
Notes: The figure shows mean aggregate inflation (black line) and category inflation rates; left panels show durable and nondurable goods inflation by category; right panels show services inflation by category; the time series is an 11-day centered moving average. Underlying daily observations are Huber-robust and survey-weighted means. Questions on inflation expectations were not part of the survey during September 2020.
In addition, we find that disagreement among respondents is less pronounced for category-specific inflation expectations, relative to aggregate expectations. A potential explanation for this gap might be that respondents interpret the aggregate inflation question as referring to a macroeconomic variable, whereas they understand the category-specific questions as referring to subjective inflation rates, that is, based on the goods and services that they personally consume (within the specific category).
We proceed by combining the disaggregated category-specific inflation expectations to form aggregated expectations. This measure offers a direct comparison to the conventional aggregate inflation expectations, as both measures now refer to the change in an economy-wide price index. Because we do not know the exact aggregation mechanism used by survey respondents, we evaluate eight different procedures for aggregating category-specific inflation expectations, across two conceptual types: (i) plausibly rational and (ii) behavioral aggregations. The three aggregations within the first type use weights arguably reasonable for a rational agent: self-reported expenditure weights, self-reported importance weights, and the official PCE weights. In contrast, the behavioral aggregations capture weighting schemes that depart from plausibly rational procedures in favor of heuristic mechanisms known in the literature, such as reliance on salient categories (D’Acunto et al., 2021; Dietrich, 2024) or salient price changes (Bruine de Bruin et al., 2011) in forming aggregate inflation expectations: equally weighted categories, core and non-core inflation expectations, a max operator selecting the highest category expectation, and a second-max selecting the second highest. These aggregations thus allow for insensitivity to category weights, the heavy weighting of salient categories, and attention to large and thus salient price changes, respectively.
Figure 2 displays the daily time series of aggregated inflation expectations: While the black line again represents the conventional measure, colored lines represent the different aggregation mechanisms. Similar to the disaggregated, category-specific inflation expectations, aggregated inflation expectations are lower than the aggregate, conventional measure of inflation expectations. The only exceptions are, somewhat by construction, the two max operations.
Figure 2: Aggregated Inflation Expectations
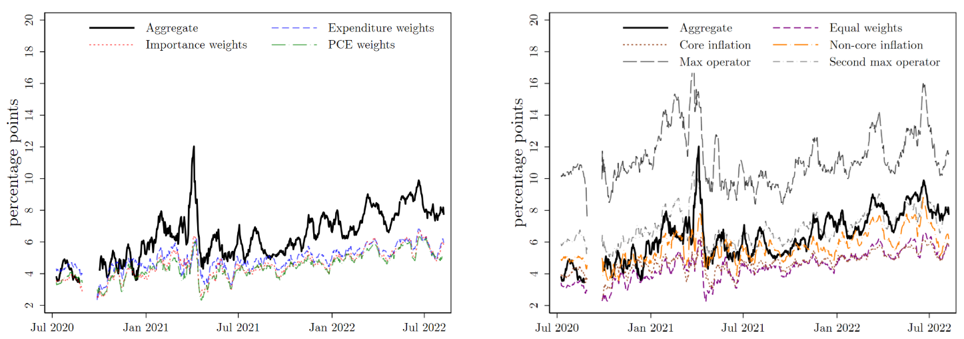
Notes: The figure shows mean aggregate inflation (black line) and aggregated inflation expectations; the time series is an 11-day centered moving average. Underlying daily observations are Huber-robust and survey-weighted means.
Which measure of inflation expectations is more informative for policymakers? To answer this question, we relate different measures of inflation expectations to survey respondents’ spending plans. Theoretically, the link between expected inflation and consumer spending is described by the consumer Euler equation. As the survey elicits planned changes in consumer spending, we can estimate the consumer Euler equation, following Crump et al. (2022). While all measures of inflation expectations tested are significant predictors of consumers’ planned spending, we document considerable differences in the model fit, that is, how well a measure of inflation expectations explains spending plans.
Figure 3: Predictive Power for Consumer Spending Plans
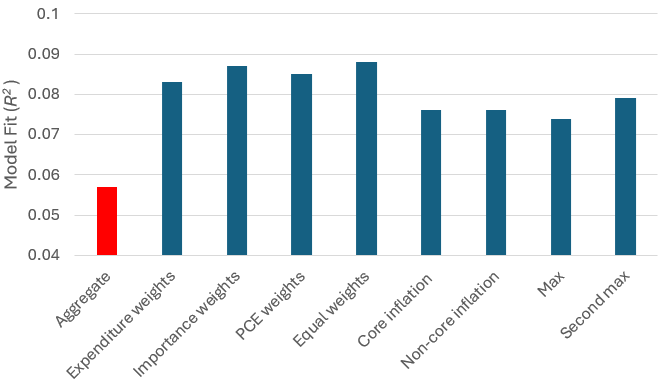
Notes: The figure displays the model fit for an estimated Euler equation, relying on a variety of measures for inflation expectations. Vertical axis: model fit as measured by R2. Horizontal axis: inflation expectations measure from the survey that was used in the Euler equation.
As Figure 3 highlights, our measures of aggregated inflation expectations all emerge as stronger predictors of planned consumer spending. While the red bar shows the R2 for the model with the conventional, aggregate measure of inflation expectations, the blue bars indicate the R2 for each of the aggregated measures. We conclude that category-specific inflation expectations appear more representative of the beliefs used in planning, and thus more informative for monetary policy. Moreover, the relative benefit of using expenditure-weighted, aggregated inflation expectations over the more conventional aggregate inflation expectations to predict spending plans increases with the individual-level gap between the two measures. This highlights the appeal of our measure of aggregated inflation expectations for policymakers who aim to elicit effective beliefs across respondent groups in the population.
Motivated by evidence that consumers struggle to grasp the concept of inflation, we introduce an alternative approach to measuring consumer inflation expectations. Rather than asking consumers outright about aggregate inflation expectations, as conventional measures do, we elicit their expectations for the underlying parts, the full range of personal consumption expenditures, which we then aggregate. Our results indicate that aggregated measures, across all of our aggregation procedures, yield more information about consumer spending plans compared to the conventional measure. We obtained this finding in a daily consumer survey of close to 60,000 respondents over two years, extending from the low-inflation environment of the COVID pandemic to the 2021 inflation surge.
We conclude that consumers’ “effective” inflation expectations—that is, the expectations on which consumers act—appear to be not best represented by explicit, conventionally reported aggregate inflation expectations, but by aggregations of category-specific inflation expectations. This holds true irrespective of socio-demographic characteristics and the uncertainty faced by respondents.
Clearly, alternative procedures for decomposing the aggregate inflation concept are worth exploring, as are alternative aggregation mechanisms and measures of consumer planning and behavior. We regard our paper as a first step in this direction, a proof of concept that lays out foundations for future work aimed at improving the measurement of a key macroeconomic aggregate, a vital input to monetary policy that is notoriously difficult to capture.
Bruine de Bruin, Waendi, Wilbert van der Klaauw, and Giorgio Topa (2011). “Expectations of Inflation: The Biasing Effect of Thoughts about Specific Prices.” Journal of Economic Psychology 32 (5), 834–845.
Crump, Richard K., Stefano Eusepi, Andrea Tambalotti, and Giorgio Topa (2022). “Subjective intertemporal substitution.” Journal of Monetary Economics 126, 118–133.
D’Acunto, Francesco, Daniel Hoang, Maritta Paloviita, and Michael Weber (2022). “IQ, Expectations, and Choice.” Review of Economic Studies. forthcoming.
D’Acunto, Francesco, Ulrike Malmendier, Juan Ospina, and Michael Weber (2021). “Exposure to Grocery Prices and Inflation Expectations.” Journal of Political Economy 129 (5), 1615–1639.
Dietrich, Alexander (2024). “Consumption categories, household attention, and inflation expectations: Implications for optimal monetary policy.” Journal of Monetary Economics. forthcoming.
Dietrich, A., Knotek, E.S., Myrseth, K.O.R., Rich, R.W., Schoenle, R.S., Weber, M., 2023. “Greater Than the Sum of the Parts: Aggregate vs. Aggregated Inflation Expectations.” NBER Working Paper No. 31822.
Fischhoff, B. and S. B. Broomell (2020). “Judgment and Decision Making.” Annual Review of Psychology 71, 331–355.
Gabaix, Xavier and Thomas Graeber (2023). “The Complexity of Economic Decisions.” Working paper.
Knotek, E. S., R. S. Schoenle, A. M. Dietrich, K. Kuester, G. J. Mueller, K. O. R. Myrseth, and M. Weber (2020). “Consumers and COVID-19: A Real-time Survey.” Economic Commentary (2020-08).