This policy brief is based on BIS Working Paper, no 1123, “Global supply chain interdependence and shock amplification – evidence from Covid lockdowns” by the same authors.
Supply disruptions from the Covid-19 pandemic raise questions about the benefits and costs of global value chain (GVC) participation and the possibility that supply chain networks may have shifted during this period. Using firm-level data on supply chain linkages, we document the evolution of GVCs during the pandemic by comparing GVC network diagrams. Furthermore, we study how such linkages affected equity investors’ reaction to pandemic-related disruptions. Our findings suggest that GVCs contracted following the pandemic outbreak and were slow to recover in some sectors. We also find that firms with GVC links to countries undergoing Covid-related lockdowns suffered larger stock price declines than those without such links. In addition, sectoral responses to lockdown announcements varied, underscoring the need to consider sectoral differences in the study of GVC shifts.
The Covid-19 pandemic and its ensuing supply disruptions highlighted the importance of looking beyond aggregate data to granular, inter-company linkages that shape global value chains (GVCs) and the propagation of shocks. While aggregate trade generally rebounded across much of the globe during the second half of 2020, there were striking divergences in performance across industry sectors. For example, the pandemic’s public-health nature and lockdowns boosted global demand for medical and work-from-home supplies while also severely hampering sectors such as automobiles and housing construction. These diverging sectoral impacts highlight the heterogeneities within GVCs and suggest that sectoral differences matter in the response of trade networks to shocks.
Using firm-level data on supply chain linkages, we shed light on how GVCs evolved during the Covid-19 pandemic, whether there were sectoral differences in this evolution, and how GVC networks may have amplified the Covid shock through the lens of equity price responses.
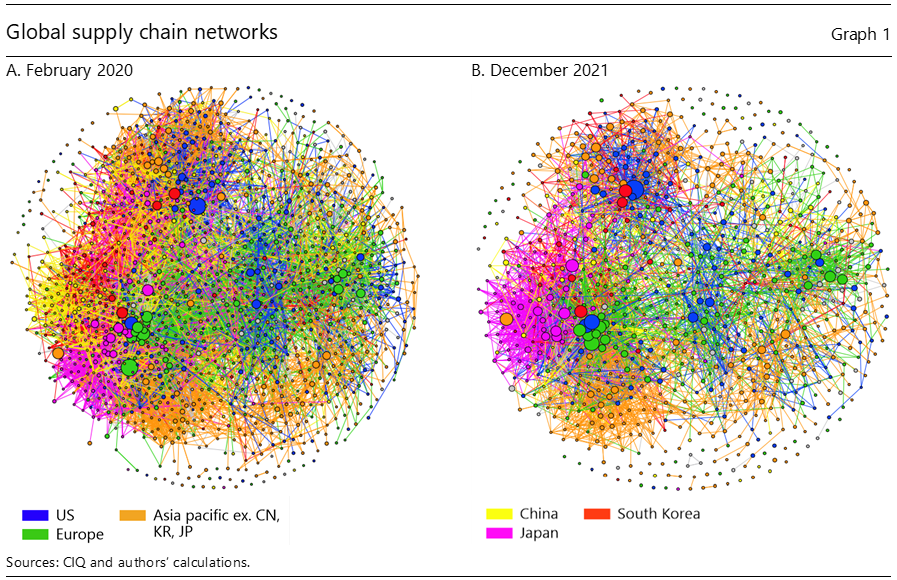
To gauge potential GVC shifts in response to the Covid-19 pandemic, we create network visualisations of global firm-level supply-chain interconnections based on two snapshots representing time periods before and after the outbreak of the pandemic.1 The pre-pandemic snapshot of GVCs is taken in February 2020, before Covid-19 was declared a global pandemic, while the post-pandemic snapshot is taken in December 2021, roughly two years after the outbreak.
In these network diagrams, firms are depicted by nodes, the sizes of which are proportional to a firm’s importance in the overall network. Different colours are used to highlight firms headquartered in different major manufacturing economies and regions. Customer-supplier relationships are represented by the edges/connecting lines between two nodes, with edges taking on the same colour as the corresponding supplier nodes, thus identifying the supplier of the connection. The network maps are structured so that nodes sharing more connections are placed closer together. Denser patches featuring a greater number of edges and/or nodes suggest more integrated networks; the reverse – ie, thinner patches with a smaller number of edges and/or nodes – suggests less integrated networks.
Graph 1 shows snapshots of global GVCs in pre- and post-pandemic, revealing complex and extensive structures with sizeable heterogeneity across sectors. Firms in Asia, the United States and Europe all exert significant influence, with their interconnectedness likely acting as an important propagation channel of Covid-related shocks. Comparing the network map of late 2021 (Graph 1B) to early 2020 (Graph 1A) suggests that GVC networks had yet to fully recover two years into the pandemic. Customer-supplier networks appeared less interconnected at the end of 2021 compared to early 2020, as shown by the less dense patches and the greater presence of empty space in the 2021 network.
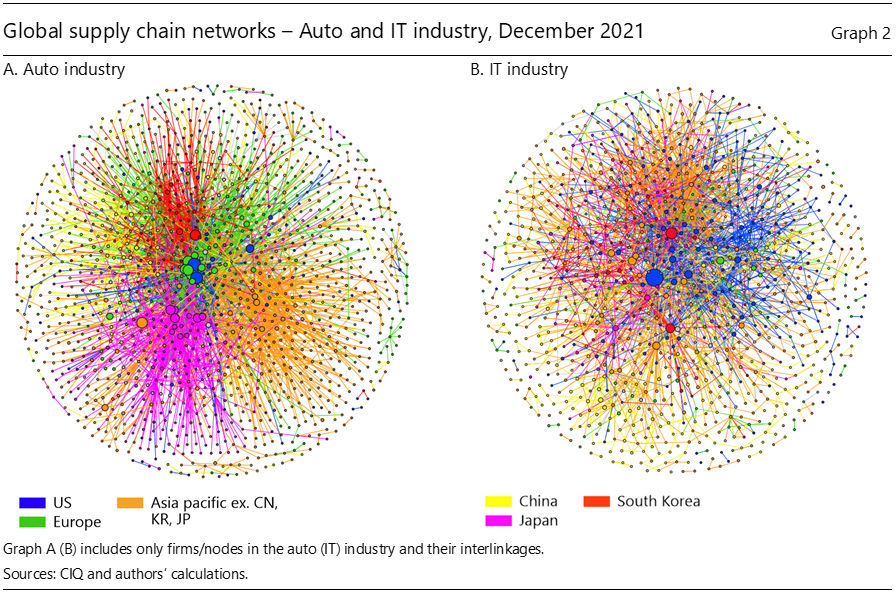
A closer look at the inter-firm connections on a sectoral basis reveals additional insights. Notably, two major manufacturing industries – Automobiles & Components (auto) and Information Technology (IT) – demonstrate highly globalised interconnections with differing network structures. Graphs 2A and 2B show the December 2021 network diagrams of firms in the auto and IT industries, respectively, and their interlinkages. Specifically, auto firms from the same country and region tend to cluster together in bunches, or regional and country “subnetworks”, implying extensive intra-country and intra-regional linkages.2 By contrast, the IT industry displays a highly globally dispersed and decentralised network with a mix of intertwined firms in Asia and the United States. These dispersed interconnections suggest that IT GVC networks may be more vulnerable to global shocks compared to the auto industry, where automakers can leverage the well-established regional supply chain networks in the face of foreign supply chain disruptions (Zhang (2021)). Indeed, a comparison of the auto and IT industry network structures between early 2020 and late 2021 reveals that while the auto industry appears slightly less dense two years after the onset of the Covid-19 pandemic, the “nested” structure of auto GVCs remains intact. By contrast, the IT industry shows a significantly less dense structure in December 2021, consistent with the IT industry potentially being less resilient to global supply chain disruptions.3
To examine whether GVC participation can amplify the effect of shocks, we leverage two strands of research4 and study GVC-linked firms’ equity price response to news of Covid lockdowns in China and Germany. These two economies are not only significant players in the global GVC network,5 but were also relatively early to announce large-scale lockdowns in the first quarter of 2020, allowing for a cleaner identification of the GVC propagation effect of the Covid shock that later became a global phenomenon. The events in focus are the 23rd and 27th of January 2020 for China, when the Wuhan lockdown and the extension of the Lunar New Year holidays were announced, respectively, and the 16th of March 2020 for Germany, when border closures were announced.6
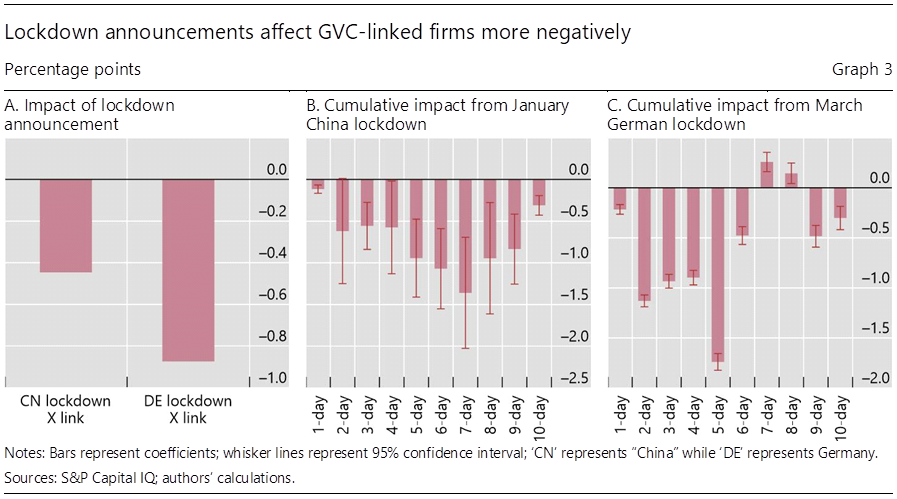
We find that stock market investors interpreted lockdown announcements as worse news for firms with GVC links to the affected country. On average, firms that were either directly or indirectly linked to China lost about 0.4 percentage points more in their equity price returns in response to China’s lockdown announcements than their counterparts without such linkages. For firms with German linkages, the penalty was about 0.8 percentage points (see Graph 3A). The larger impact of the German lockdown on German-linked firms likely reflects greater investor pessimism regarding the virus and the related growth outlook at the time of the German border closure in March 2020. Indeed, the largest market losses were first sustained in March 2020. At the time of the January 2020 lockdown in China, by contrast, the virus was still seen as largely localised and its impact limited.
Extending the event window beyond one day, we find that an initial, relatively muted response on the announcement day became more amplified over subsequent days. Over the course of roughly two weeks, the peak cumulative impact on the equity prices of China- and German-linked firms was seen on day five, with share prices declining by about 0.9 and 1.7 percentage points more than their peers without such linkages (Graphs 3B and 3C, respectively).
Moreover, we find that a firm’s position in the supply chain relative to the economies in lockdown –upstream or downstream – matters.7 While the share prices of both upstream and downstream firms were more negatively affected than their non-linked counterparts, this effect was more pronounced for firms downstream to Germany. To shed light on this, we then take a closer look on a sectoral basis. We find that firms in the communications and healthcare sectors with German linkages outperformed their peers in other sectors after five days, likely reflecting investor optimism over stronger demand for medical and work-from-home-related communications products during lockdowns. Other sectors that are more vulnerable to supply disruptions such as IT, industrials and materials underperformed as expected, likely reflecting disruptions to their inputs. These may have partly explained why firms downstream to Germany fared worse than those upstream to Germany in terms of share prices, and underscore the importance of taking sectoral differences into account when examining the propagation of shocks along GVCs.
The complexity and interconnectedness of GVC networks are often hidden in aggregate data. Using data on customer and supplier linkages from a global sample of firms, we find complex and extensive supply-chain network structures at both the aggregate and industry level as well as shifts in GVC networks during the Covid-19 pandemic. Our empirical analysis also shows that GVC links can amplify the effect of supply disruptions, as suggested by the response of share prices of GVC-linked companies to lockdown announcements in major manufacturing economies. The negative effect of lockdowns on the stock returns of GVC-linked companies is particularly pronounced for firms in cyclical industries that are more vulnerable to supply disruptions, including those in materials, industrials and IT. Taken together, our findings highlight the need for looking beyond the aggregate data in assessing GVC shifts and shock responses.
Boehm, C., Flaaen, A., & Pandalai-Nayar, N. (2014): “Input linkages and the transmission of shocks: Firm-level evidence from the 2011 Tohuku earthquake,” The Review of Economics and Statistics 101(1): 60–75.
Bungsche, H. (2018): “Reginal economic integration and the automobile industry: automobile policies, division of labour, production network formation and market development in the EU and ASEAN”, International Journal Automotive Technology and Management, 18(4).
Carvalho, V. M., Nirei, M., Saito, Y. U., & Tahbaz-Sakehi, A. (2016): “Supply chain disruptions: Evidence from the Great East Japan earthquake,” Research Paper No. 17-5. New York: Columbia Business School.
Chen, S., Tsang, E. & Zhang, L. (2023): “Global supply chain interdependence and shock amplification – evidence from Covid lockdowns”, BIS Working Papers, no 1123.
Frigant, V & Zumpe, M. (2017): ”Regionalisation or globalisation of automotive production networks? Lessons from import patterns of four European countries,” Growth and Change 48: 661-681.
Inoue, H., & Todo, Y. (2017): “Propagation of negative shocks through firm networks: Evidence from simulation on comprehensive supply chain data,” RIETI Discussion Paper Series 17-E-044.
Jalin, B. (2018): “Production networks of the Asian automobile industry: regional or global?”, International Journal Automotive Technology and Management, 18(4).
Grant, E & Yung, J. (2019): “Upstream, downstream & common firm shocks,” Globalisation and Monetary Policy Institute: Working Paper No. 360.
Ramirez, C. (2017): “Firm networks and asset returns,” FEDS Working Paper No. 2017-014. https://doi.org/10.17016/FEDS.2017.014r1.
Zhang, S. Y. (2021): “Using equity market reactions and network analysis to infer global supply chain interdependences in the context of Covid-19”, Journal of Economics and Business, 115.
Our data are global, firm-level customer-supplier linkages from S&P’s Capital IQ (CIQ) database, which provides cross-sectional snapshots of firms’ business linkages based on sources such as company filings, news aggregators and press releases, etc.
This finding is in line with trends documented in the literature (eg Frigant and Zumpe (2017), Jalin (2018) and Bungche (2018)).
February 2020 graphs for the auto and IT industries are not shown for space constraint. Please see the full paper for details.
This includes research studying the transmission of shocks via supply chain linkages at the firm level (eg, Boehm et al (2014), Carvalho et al (2016), Inoue and Todo (2017)) and the corporate finance literature that studies the effects of supply chain linkages on asset pricing (eg, Ramirez (2017), Grant and Yung (2019), and Zhang (2021)).
For a ranking of GVC importance, please see WTO (World Trade Organization) 2021. Global Value Chain Development Report 2021. Geneva. https://www.wto.org/english/res_e/booksp_e/00_gvc_dev_report_2021_e.pdf.
The Federal Reserve announced a number of large-scale interventions on the 17th of March, including the commercial paper funding facility, which boosted equity market sentiment. We controlled for this event in our regression analysis and found that the Fed’s announcement helped to offset some of the losses from lockdown announcements but its impact dissipated within two days.
The breakdown of upstream and downstream exposures is not exclusive. Our results are robust to using the exclusive upstream and downstream measures.