This policy brief is based on ECB Working Paper Series, No 3062. This paper should not be reported as representing the views of the European Central Bank (ECB). The views expressed are those of the authors and do not necessarily reflect those of the ECB.
Abstract
The energy component has been the most important source of headline inflation volatility and forecast errors. Central banks must continuously strive for having the most accurate model for this component, despite well-known challenges in forecasting energy prices. Drawing on the experience from the recent high inflation episode we propose a new model for euro area consumer energy price inflation that: (i) is granular and distinguishes various energy sub-components like fuels, gas or electricity; (ii) adjusts for outliers and time-varying volatility; (iii) makes use of high-frequency indicators and (iv) features data transformation that allow for level-dependent elasticities to commodity price changes. Our novel model forecasts better than various alternatives and captures a stronger pass-through from energy commodity prices to consumer price inflation when the former are high. The model can also be used for scenario analysis.
Energy prices are volatile and notoriously hard to forecast. In the euro area most of the Eurosystem/ECB staff projection errors for headline inflation come from energy prices, and in particular are related to the assumed (future) paths for energy commodity prices (Chahad et al., 2022, 2023). In March 2022, the annual inflation in Harmonised Index of Consumer Prices (HICP) for energy in the euro area peaked at an unprecedented level of 44.3% and accounted for around three quarters of total short‑term inflation forecast errors. Beyond errors in commodity price assumptions, the complex and evolving pass-through of oil and gas prices to consumer energy prices, further complicated by fiscal interventions and market decoupling, made accurate forecasts increasingly challenging. Despite those challenges, central banks must continuously strive for having the most accurate model(s) for (consumer) energy prices, in order to minimise inflation forecast errors and to have reliable tools for scenario analysis.
Given these considerations, we propose a new model suite to obtain forecasts and scenarios for euro area HICP energy inflation (see Bańbura et al., 2025). We adopt a granular, bottom-up approach and we fit a Bayesian VAR (BVAR) model to each of 7 subcomponents of HICP energy: petrol, diesel, liquid fuels, gas, electricity, heat energy and solid fuels. The models also incorporate data on crude and refined oil prices, natural gas prices, producer prices of energy and applicable taxes. Chart A provides an overview of the suite, which we label as the Short-Term Inflation Projection (STIP) model.
The suite incorporates key features important for modelling (consumer) energy prices:
1.) Granular approach
Modelling various HICP energy components individually is important because they vary substantially in terms of properties, including: frequency of available explanatory variables, type of taxation, degree of competition and regulation or main drivers. For instance, consumer car fuel prices are closely linked to developments in refined petroleum and diesel prices, where the pass-through to consumer prices is full and relatively quick. In contrast, the pass-through from wholesale to consumer gas prices is more delayed, reflecting various shares of regulated prices and rules on price adjustment across the euro area. Electricity prices are also subject to a different share and type of regulation in many countries and are often adjusted less frequently.
Chart A. Set-up of the energy inflation forecasting model
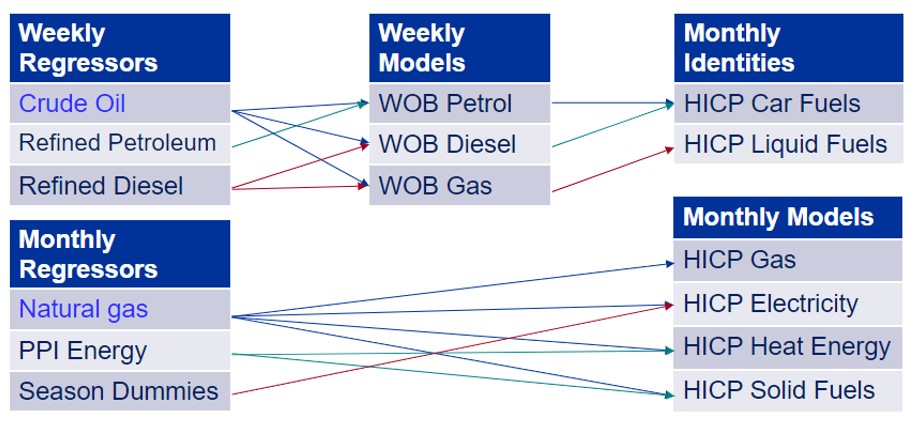
Note: WOB refers to the data from the European Commission’s Weekly Oil Bulletin. These are available more timely and at higher frequency than corresponding HICP series. They also have a longer history. Arrows indicate which drivers are included in which model in the suite. Commodity prices are expressed in euros. WOB series and HICP gas are modelled in pre-tax absolute differences and the taxes are applied ex-post to obtain the forecasts for HICP. A brighter blue colour marks variables for which conditioning information (based on futures prices) is provided in the exercise depicted in Chart C.
2. Higher frequency information
In order to obtain a timelier signal for the monthly inflation, we exploit information in weekly indicators for car and liquid fuels from the European Commission’s Weekly Oil Bulletin (WOB), which produces weekly consumer prices for petroleum products in EU countries. In this part of the model suite we also exploit weekly information on commodity prices and exchange rates.
3. Features to deal with the volatility in energy prices
The BVARs feature stochastic volatility in the residuals and also handle extreme observations via “outlier correction” (see Stock and Watson, 2016). The framework also effectively deals with the so-called ragged edge of the data on account of differences in publication delays between the indicators, an important feature in real-time applications. It also allows for seasonal terms in certain energy components.
4. Consumer price elasticities that depend on levels of commodity prices
An empirical feature of energy consumer prices is that when oil and gas prices are high, the pass-through to consumer prices in percentage terms is stronger. This is due to the composition of the energy prices paid by consumers. For instance, in addition to the input commodity prices, final consumer prices include relatively stable components such as refining and distribution margins and fixed per-unit excise duties, which make up a larger share of the total price when input prices are low, and vice versa. As a result, a certain percentage change in crude oil or wholesale natural gas prices translates into a smaller percentage change in consumer energy prices when input prices are low, and into a larger percentage change when input prices are at high levels and constitute a larger share of the total price (see also Meyler, 2009, for a discussion on this point).
Our linear setting is compatible with such level-dependent elasticities because the model is estimated using variables expressed in absolute rather than in percentage changes, and in pre-tax terms, which implicitly allows the percentage pass-through to vary with the level of commodity prices.
Chart B shows the estimated responses of HICP energy to a 10% permanent increase in either crude oil prices (panel (a)) or wholesale natural gas prices (panel (b)), at the cut-off dates of Eurosystem/ECB staff macroeconomic projections between March 2014 and June 2023. Although more clear for crude oil than for wholesale gas, the elasticities are level dependent with respect to price levels of both commodities. For the case of gas the level dependence seems to be more relevant after 2021, most likely associated to high swings in the wholesale price level during the inflation surge period, when the pass-through of gas commodity price changes on average doubled compared to the pre-pandemic sample.
Chart B. Consumer energy price response to 10% permanent shocks in energy commodity prices
(percentage points for impulse responses, EUR/barrel for oil and EUR/MWh for gas)
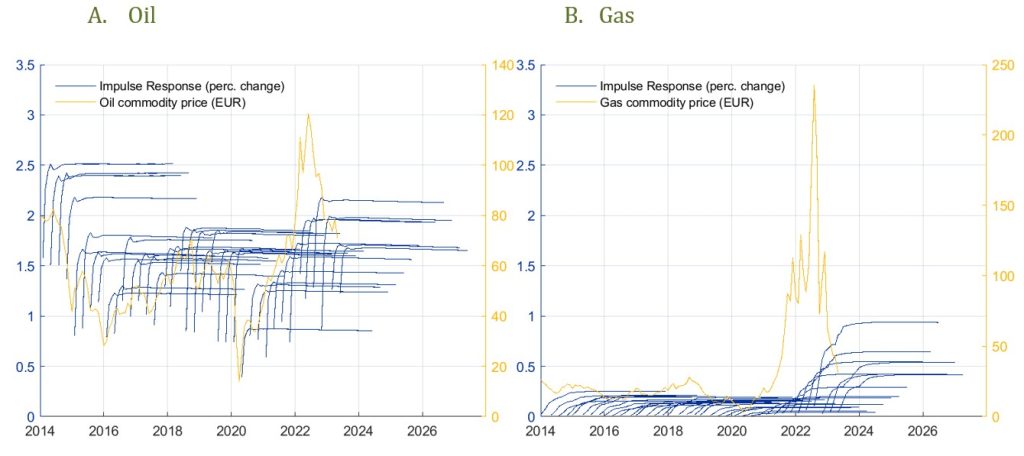
Note: The blue lines (left-side axis) represent the (median) responses of HICP energy to a permanent 10% increase in crude oil (panel (a)) and wholesale natural gas (panel (b)) price. The yellow lines (right-side axis) show the evolution of the corresponding commodity prices. The responses associated to oil shocks are aggregated using the responses of car fuels and liquid fuels, while the responses associated to natural gas shocks are constructed from gas, electricity, heat energy and solid fuels.
We assess our model against (i) Eurosystem staff inflation projections, (ii) a simple bi-variate Bayesian VAR including HICP energy and crude oil prices, and (iii) a univariate Bayesian AR model for HICP energy. Table A summarises the results of the real-time forecast evaluation over 2014-2023.
Our disaggregate model performs better than the simpler (model) benchmarks and beyond the one-month horizon also better than the Eurosystem staff inflation projections. The latter rely on detailed information, models and judgment and as such are a difficult benchmark to beat.
The model can be also used to understand the sources of forecast errors. Chart C depicts a decomposition of one-quarter ahead forecast errors of euro area energy inflation into a component due to errors in the paths on wholesale commodity prices assumed in the Eurosystem/ECB staff projections and the remainder. Errors in these assumptions explain most of the forecast errors in the first part of the evaluation sample, until the recent inflation surge. In the recent period also other factors become important, most likely reflecting changes in pass-through on account of large price swings and fiscal measures mentioned above. Overall, however the forecasting performance is strongly linked to the ability to predict price dynamics for energy commodity prices, which are notoriously hard to forecast.1
Table A. HICP Energy – Root Mean Squared Forecast Errors for different forecast horizons
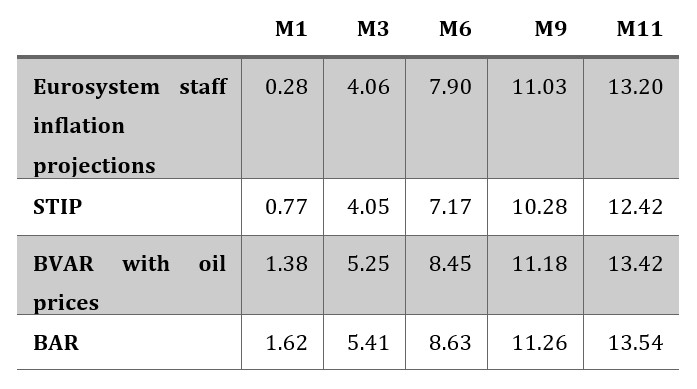
Notes: forecast errors are computed for monthly annual growth rates of HICP energy. Columns correspond to forecasting horizons in months. The model forecasts are computed with real-time data at ECB/Eurosystem staff projections cut-off dates. Evaluation sample includes 38 projections exercises between March 2014 and June 2023. The latest outcome in the evaluation is June 2023.
Chart C. Decomposition of one-quarter ahead forecast errors
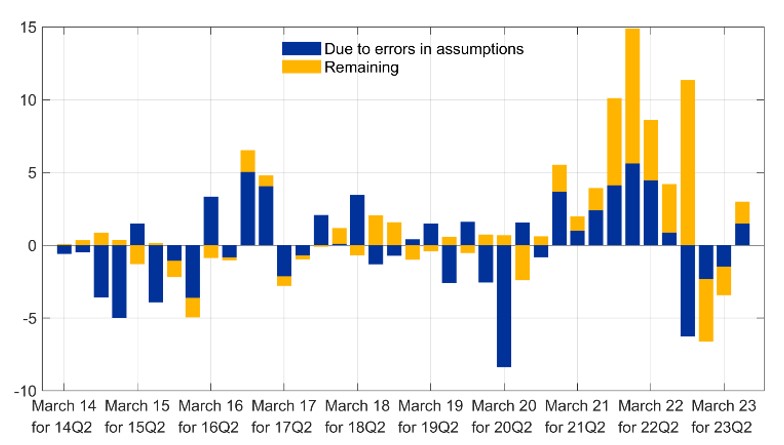
Notes: forecast errors are calculated for annual growth rates of HICP energy at quarterly frequency, as realised outturn minus model forecast. The model forecasts are computed with real-time data at ECB/Eurosystem staff projections cut-off dates. At each point in time, the portion of error due to errors in the assumed paths for crude oil and wholesale gas prices (in blue) is computed based on a counterfactual forecast that takes into account the realised future paths for these variables. The portion of forecast error that persists in this counterfactual exercise is labelled as “Remaining” (in yellow).
As outlined in the ECB’s monetary policy strategy statement, policy makers should take into account “not only the most likely path for inflation and the economy but also risks and uncertainty, including through the appropriate use of scenario and sensitivity analyses”.2 In this respect, it is important for policy makers to grasp the implications of various possible paths of oil, gas prices or carbon prices for consumer prices and such exercises are regularly conducted by central banks.3 Our model allows for gauging the impact of various scenarios for consumer energy prices. For instance, in the context of the increased pace of the green transition, for which implementing carbon prices remains a key vehicle, our model has two features that make it fit for scenario analysis: (i) we use pre-tax consumer energy price data where available (as excise duties and VAT play a sizeable role unlike for other HICP components) and this enables us to assess the role of various paths for carbon taxes to be added to pre-tax data; (ii) the granular modelling strategy allows for a better assessment of the impact of some measures in the Fit-for-55 package, as they affect various components in different ways.
An illustration of how this forecasting model can be used to conduct scenario analysis relates to the impact of the EU Emissions Trading System (ETS2) that will be introduced in 2027 and will cover emissions from transport fuels and building heating. Under ETS2, fuel distributors and building energy suppliers will need to purchase allowances to cover the emissions from the fuels they sell. Emissions allowances will be traded and their price determined by the market. The resulting carbon price will likely be passed on to consumers, translating into a direct inflationary effect. The December 2024 Eurosystem macroeconomic projections (ECB, 2024) included a box on the impact of climate change transition policies on growth and inflation. The box contained also estimates based on this model, on the impact of ETS2 conditional on a range of plausible assumptions relating to the ETS2 price level, the speed and extent of pass-through, and the modalities of the transition to ETS2 in countries with existing national schemes. The conclusion was that the ETS2 impact on HICP inflation is uncertain and could range from 0.0 percentage points to 0.4 percentage points in 2027, with a much smaller impact in 2028.
Bańbura, Marta, Elena Bobeica, Alessandro Giammaria, Mario Porqueddu, and Josha van Spronsen (2025) “A new model to forecast energy inflation in the euro area” ECB Working Paper Series, No. 3062, European Central Bank.
Baumeister, Christiane and Lutz Kilian (2014) “What Central Bankers Need To Know About Forecasting Oil Prices,” International Economic Review, 55 (3), 869–889, 10.1111/iere.12074.
Baumeister, Christiane, Florian Huber, Thomas K. Lee, and Francesco Ravazzolo (2024) “Forecasting Natural Gas Prices in Real Time,” NBER Working Papers 33156, National Bureau of Economic Research, Inc,.
Chahad Mohammed, Anna-Camilla Hofmann-Drahonsky, Baptiste Meunier, Adrian Page and Marcel Tirpak (2022) “What explains recent errors in the inflation projections of Eurosystem and ECB staff?” ECB Economic Bulletin, Issue 3/2022, European Central Bank.
Chahad, Mohammed, Anna-Camilla Hofmann-Drahonsky, Adrian Page, and Marcel Tirpak(2023) “An updated assessment of short-term inflation projections by Eurosystem and ECB Staff ” ECB Economic Bulletin, Issue 1/2023, European Central Bank.
ECB (2024) “Eurosystem staff macroeconomic projections,” Technical report, European Central Bank, December.
Meyler, Aidan (2009) “The pass through of oil prices into euro area consumer liquid fuel prices in an environment of high and volatile oil prices,” Energy Economics, 31 (6), 867–881.
Van Robays, Ine and Cristiana Belu Manescu (2014) “Forecasting the Brent oil price: addressing time-variation in forecast performance,” Working Paper Series 1735, European Central Bank,.
Stock, James H. and Mark W. Watson (2016) “Core Inflation and Trend Inflation,” The Review of Economics and Statistics, 98 (4), 770–784.
Eurosystem staff projections are based on futures prices for oil and gas prices, but other methods can be applied. Baumeister and Kilian (2014) find that VAR models can provide more accurate forecasts for (real) oil prices compared to oil futures prices and no change forecasts. Van Robays and Belu Manescu (2014) propose a four-model forecast combination approach to deal with instability in relative forecast performance. Baumeister et al. (2024) provide a comprehensive analysis of the forecastability of the real price of natural gas in the United States and find considerable improvements when using a six-variable BVAR model that includes the fundamental determinants of the supply and demand for natural gas.
The Eurosystem/ECB staff macroeconomic projections regularly publish sensitivity analyses with respect to alternative energy commodity price paths whereby the alternative paths are derived from the lower and upper percentiles of the option-implied neutral densities for both oil and gas prices.