The views expressed in this brief are those of the author(s) and do not necessarily represent the views of the IMF, its Executive Board, or IMF management.
In response to the rise in inflation, monetary policy has tightened in Europe. Yet, the extent to which the shift in monetary policy leads to tighter financial conditions is an open question. Most financial condition indices in the literature have focused on volatility, term premia, and credit spreads, as they are good near-term predictors of crises. However, these market stress measures do not fully capture the availability and affordability of financing. To address this shortcoming, we have developed a novel Financial Conditions Index (FCI) that is designed to reflect the costs, conditions, and availability of funds to the economy. The proposed FCI accounts for various quantity and price variables and is tied to the growth of financial liabilities. Our FCI shows that financial conditions loosened on the back of the strong policy response to the pandemic but tightened significantly in 2021-22. Financial conditions remain tight to date, although the rate of tightening has eased. The analysis also reveals that, over a three-year horizon, the recent tightening in financial conditions would lower real GDP by 2.2 percent and inflation by 0.7 percentage points while increasing the unemployment rate by about 0.3 percentage points.
The proposed FCI encompasses a broad array of price and quantity indicators. When building an FCI, several variables should be considered. These include indicators of monetary conditions, credit aggregates that capture the capacity of the financial system to provide credit to the economy, as well as equity and bond prices. To facilitate the economic interpretation of financial conditions, these indicators are grouped into five key macroeconomic drivers, reflecting the transmission channels through which they may work and their complex interactions. These include the following:
The methodology uses a target variable to anchor the data. Unlike most traditional data reduction methods, where an FCI is extracted from an atheoretical relationship among the data, the adopted methodology relies on a supervised learning algorithm, the Partial Least Squares (PLS) estimation. The PLS bears some resemblance to Principal Component Analysis (PCA) in that it does not impose a subjective selection of the variables involved. However, the PLS anchors the estimated relationships to a target variable by maximizing the covariance between the target and the PLS factors. The chosen target variable is the year-on-year growth rate of all the financial liabilities for the whole economy as well as each sector at a quarterly frequency. The advantages of the PLS are the following:
The strong policy response to the pandemic led to looser financial conditions. As illustrated in Figure 1, financial conditions eased in 2020, reflecting the exceptional policy support deployed in this period. Uncertainty about the pandemic and its impact on economic activity resulted in a spike in the price of risk. However, the outpouring of monetary and fiscal support led to a more accommodative economic environment until the end of 2020. In this period, the increase in government funding outweighed private sector deleveraging and government debt ratios contributed to easier FCIs through loosening funding constraints.
Figure 1: Contributions to Financial Condition Index in the Euro Area
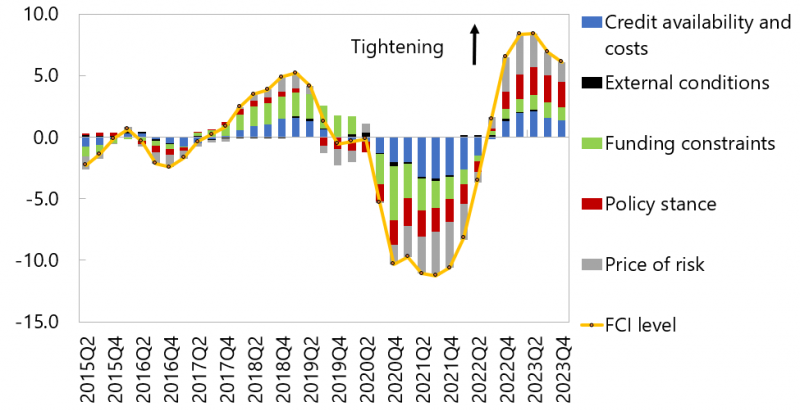
Sources: Author’s calculations.
Notes: FCI is not scaled. 2023Q3 and Q4 are projections.
But in 2021–22, financial conditions tightened significantly. In line with the sharp drop in the growth rate of financial liabilities, financial conditions started tightening significantly in 2021 and continued doing so in early 2022 with the onset of Russia’s war in Ukraine. The rate of tightening moderated somewhat only in late 2022. Initially, in 2021, tighter funding constraints were the main drivers of financial conditions. An analysis of the key drivers shows that that the pandemic-induced rise in public and private debt ratios, after the initial loosening effect, increasingly acted as a funding constraint, while higher commodity prices weighed on financial flows. In contrast, favorable stock market conditions were still providing a mildly loosening contribution to financial conditions during this phase.
After the start of the war in Ukraine, lower availability and higher cost of credit as well as a higher price of risk compounded the effect of tighter funding constraints. In February 2022, after the start of the war, the price of risk jumped, reflecting wider spreads and higher market volatility across a variety of financial asset classes. The policy stance turned decisively tighter, as the ECB and other central banks started hiking rates to keep inflation expectations anchored. And, as monetary policy tightened, so did the availability and the cost of credit, with rising household and corporate lending rates, lower stock prices, higher government bond yields all contributing to more restrictive financial conditions.
The pace of tightening started to slow down only at the end of 2022. Financial conditions tightened significantly in 2022 and the rate of tightening exhibited early signs of moderation only towards 2022Q4. This slowdown took hold as the rise in lending rates as well as government and corporate yields—which had weighed adversely on the credit availability and costs—started decelerating. The tightening trend reversed in 2023, when a retreat in energy prices and easing inflationary pressures supported market expectations that monetary tightening could end soon. After a period of market turmoil on the back of banking crises in the US and Europe, volatility, term premia, and credit spreads have subsided again.
Notably, the analysis also indicates that tighter monetary policy weakens the impact of inflation on the price of risk. While higher policy rates may result in tighter FCs in the near term, results suggest that this effect may be temporary, as the tighter policy stance would eventually reduce the impact of inflation on the price of risk, hence, possibly supporting looser FCs. Further analysis is needed to confirm the significance of this channel across countries.
Results also show that cross-country divergences in FCs have increased. The current tightening cycle is broad-based, having affected both Euro and non-Euro European economies. However, the high dispersion across FCs suggests growing heterogeneity among countries from 2022. For some countries, including Italy and Spain, both the policy stance and the price of risk contribute significantly to changes in FCs.
On the other hand, cross-sector comparisons show that both households and firms are now facing tighter financial conditions, but sectoral dynamics are driven by different factors and timing (Figure 2). Financial liabilities grew only until 2022Q1 for non-financial corporations (NFCs) but continued accelerating until the end of 2022 for households (HH). As a result, financial conditions started tightening for NFCs about 3 quarters earlier than for HHs. As of 2023Q3, financial conditions were still tightening for HHs while showing signs of early easing for NFCs. For HHs, tighter financial conditions were mainly driven by the tighter policy stance as well as lower credit availability and higher costs, in turn driven by higher lending rates. For the corporate sector, the price of risk, led by widening corporate spreads and rising volatility, played a more prominent role.
Figure 2: Household and NFC Financial Condition Indices
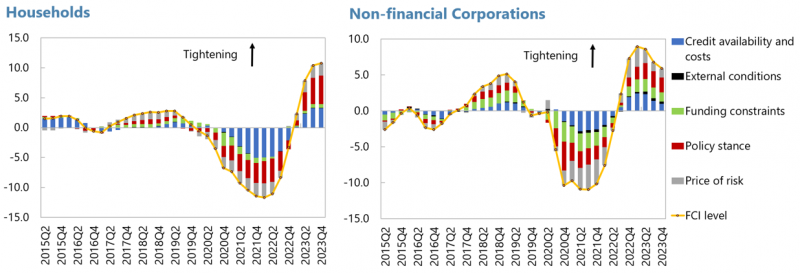
Sources: Author’s calculations.
Notes: FCI is not scaled. 2023Q3 and Q4 are projections.
The relationship between financial conditions and macro variables is affected by complex and at times mutually reinforcing effects. There are two main sources of endogeneity: policy endogeneity effects and market expectation effects
In the sample under consideration, market expectation effects tend to dominate policy endogeneity effects, with loose financial conditions associated on average with stronger growth. In other words, strong growth appears alongside loose financial conditions, potentially more so than implied by the change in the FCI. Therefore, these observations are overrepresented in the sample, compared to an “ideal” experimental setting where financial conditions would be randomly assigned to different states of the world. This bias in the data is corrected through the Inverse Probability Weighting (IPW) method. The sample is divided into tight, neutral, and loose regimes. The probability of each regime occurring is estimated given observed economic and financial conditions and the sample is re-weighed to give less weight to overrepresented observations. Across countries, FCIs show some significant differentiation. For example, FCIs are still firmly in a tight regime in France, Germany, and Italy but have reverted to a more neutral regime in Spain (Figure 3). Regardless of the specific regime, an unbiased estimate of the impact of changing financial conditions on macroeconomic aggregates, i.e., output, unemployment, and inflation can be obtained through this treatment.
Figure 3: Financial Condition Index and Regime Switches
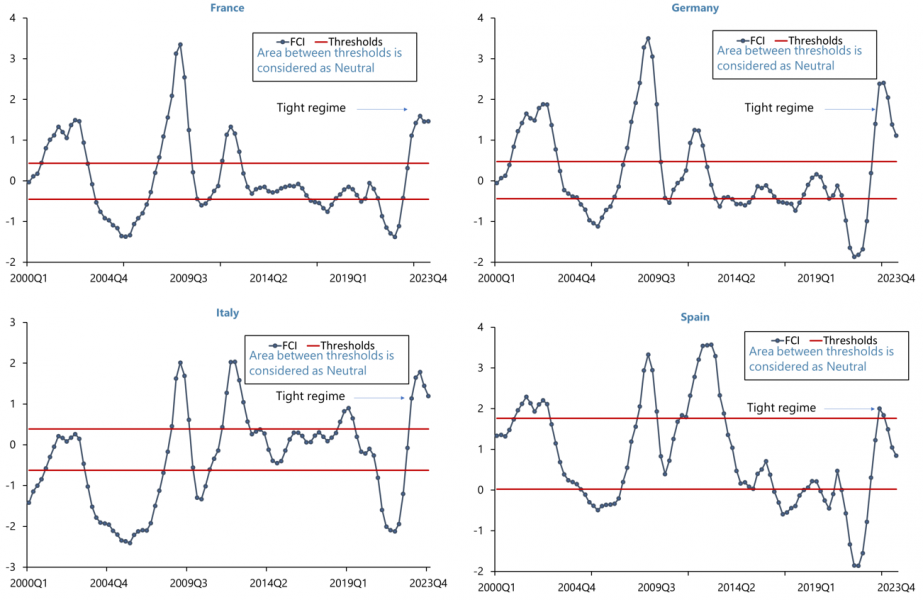
Sources: Author’s calculations.
Notes: FCI is not scaled. 2023Q3 and Q4 are projections.
The ongoing tightening in financial conditions is expected to lower output and inflation, while raising unemployment. Over a three-year horizon, tighter FCs are estimated to lower real GDP by 2.2 percent and inflation by 0.7 percentage points, while increasing the unemployment rate by about 0.3 percentage points.
Figure 4: Macroeconomic Impact of Financial Conditions
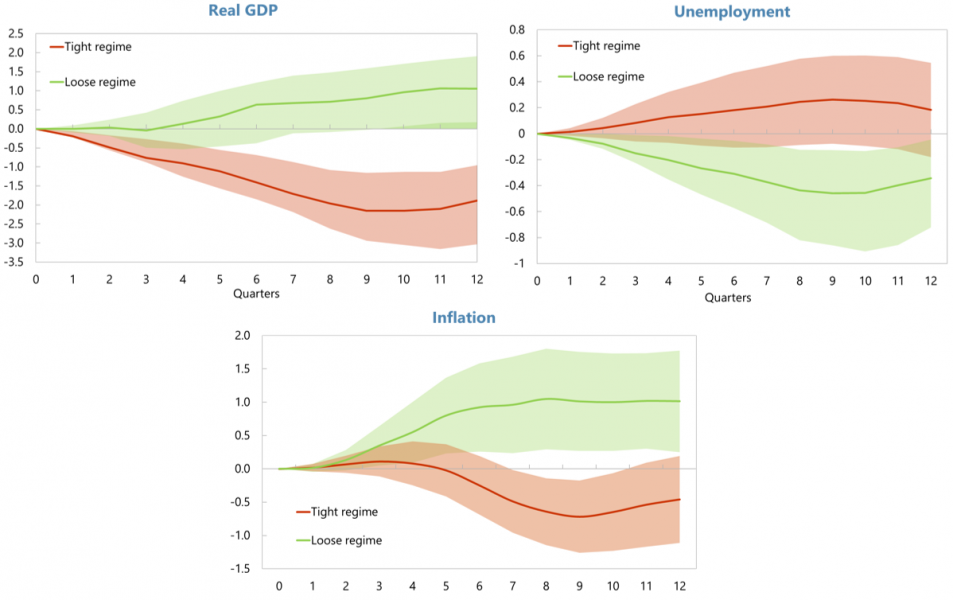
Sources: Author’s calculations.
Notes: FCI is not scaled. 2023Q3 and Q4 are projections. The shaded areas represent 90 percent confidence interval.
Borraccia, Giovanni; Raphael A Espinoza; Vincenzo Guzzo; Romain Lafarguette; Fuda Jiang; Vina Nguyen; Miguel A. Segoviano; and Philippe Wingender, “Financial Conditions in Europe: Dynamics, Drivers, and Macroeconomic Implications”, IMF Working Paper 2023/209.