The manuscript was written while David Finck was a PhD student affiliated with the University of Giessen. The views expressed in this paper are those of the authors and do not necessarily reflect the views of the Deutsche Bundesbank or the Eurosystem.
Interconnected global supply chains expose countries to disruptions of global value chains. This danger manifested itself during the Covid-19 pandemic between 2020 and 2022. We review results from a recent study that takes a macroeconomic perspective on global supply chain shocks. In this study, we estimate a structural vector autoregression model using data from international container trade. In order to align the shock with the established historical narrative, we not only impose restrictions on the sign of some of the responses, but also on the sign of the shock during selected episodes, i.e. (i) the Tōhoku earthquake in March 2011, (ii) the obstruction of the Suez Canal in March 2021 and (iii) the zero-Covid policy imposed by authorities in Shanghai in April 2022. We find that the supply chain shock causes a strong increase in consumer prices and a drop in real economic activity in the euro area.
In most advanced economies, inflation had been low and stable for decades. Since 2021, however, economies all over the world experience a drastic return of inflation. Besides the recovery of economic activity after pandemic-induced lockdowns and the war in Ukraine, which caused a dramatic increase in energy prices, economists focus on a new driver of global inflation: disruptions to global supply chains.
Global supply chains are a pervasive feature of globalization. However, interconnected global supply chains come with a drawback: the tight network of global sourcing makes countries vulnerable to disruptions of global value chains. This danger manifested itself during the Covid-19 pandemic between 2020 and 2022. When authorities imposed lockdowns in order to contain the spread of the pandemic, even small disruptions in production and logistics cascaded into sizable macroeconomic shocks.
In Finck and Tillmann (2022), we provide a comprehensive analysis of the effect of global supply chain disruptions on the euro area business cycle. The study takes a macroeconomic perspective on global supply chain shocks. In order to quantify the adjustment of the business cycle in the euro area to an unexpected supply chain bottleneck, we estimate a structural vector autoregression (VAR) model using data from international container trade. Specifically, the VAR model includes standard euro area variables such as industrial production and consumer prices as well as variables summarizing container shipping, which reflects global supply chains. We include the RWI/ISL index of container throughput for the Northrange, the most important ports in continental Europe, the HARPEX index of container freight rates and the Global Supply Chain Pressure Index provided by Benigno et al. (2022).
The key challenge is identification. We proceed in two steps. First, we follow Arias et al. (2018) and use restrictions on the signs of the impulse responses. An adverse supply chain shock reduces the container throughput in the euro area and increases container freight rates as reflected by the HARPEX index. The opposite signs of the responses of the number of containers being processed and the price of shipping a container clearly characterize the shock as a supply-side disruption. In addition to these restrictions, we assume that the Global Supply Chain Pressure Index increases, though we show in the paper that this restriction is not essential. All macroeconomic variables such as industrial production and consumer prices remain unrestricted.
However, the shock identified by these sign restrictions does not match the historical narrative in three selected episodes. We want the global supply chain shock to be positive, i.e. restrictive, in the following historical cases: (i) the Tōhoku earthquake and the subsequent tsunami in March 2011, which caused a major disruption to supply chains (Boehm et al., 2019; Carvalho et al., 2021), (ii) the obstruction of the Suez Canal in March 2021, when the Ever Given blocked the most important shipping route for trade between Europe and Asia for six days and (iii) the zero-Covid policy imposed by authorities in Shanghai in April 2022 leading to a severe delay in container traffic in the port of Shanghai.1
These episodes lead us to the second step of the analysis. Following Antolin-Diaz and Rubio-Ramírez (2018), we put additional constraints on the model which we derive from the narrative information revealed by these three historical episodes. These narrative restrictions constrain the admissible set of structural parameters by ensuring that the structural shocks and historical decompositions align with the established historical narrative. We require the shock to be positive, i.e. restrictive, in each of the historical episodes listed before. In addition, in March 2011, i.e. at the time of the Tōhoku earthquake, the global supply chain shock should be the dominant source of variation of the Global Supply Chain Pressure Index.
Figure (1) shows the responses of the key variables to a global supply chain shock. We find that a disruption of supply chains has a strong effect on the business cycle in the euro area. The shock causes a drop in euro area industrial production by about 0.8% after two years and an increase in consumer prices by 0.3% after 18 months. Thus, the supply chain disruption resembles a conventional aggregate supply shock with real activity falling and prices rising. As expected, import prices in the euro area are particularly sensitive to supply chain shocks with an increase by one percent.
Figure 1: The responses to a supply chain shock
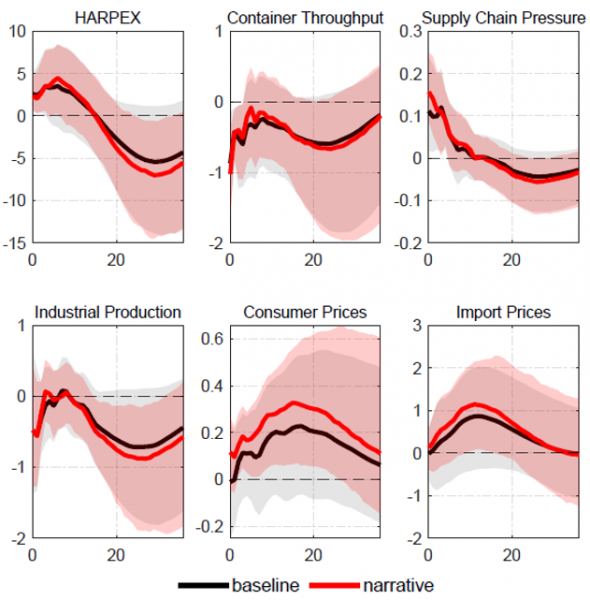
Notes: The black-solid line corresponds to the median of the baseline results, while the red-solid line corresponds to the median of the models that satisfy both the baseline sign restrictions and the narrative restrictions. The light-shaded areas correspond to the 90% credible bands for the baseline restrictions, while the red-shaded areas correspond to the 90% credible bands that additionally satisfy the narrative restrictions.
Figure (1) also shows the effect of the narrative restrictions. If we impose both the sign and the narrative restrictions, all variables’ responses are highly statistically significant. Without the narrative restrictions, the results are no longer statistically significant. Thus, aligning the supply chain shock with the established narrative is pivotal for identification. In the paper, we also show that the global supply chain shock explains a large fraction of the business cycle in the euro area. Over a horizon of one year, 29% (9%) of the forecast error variance of consumer prices (industrial production) is due to our identified shock.
The VAR model includes information about the euro area. Importantly, the impact of the identified shock remains qualitatively unchanged if we replace container throughput, euro area industrial production and consumer prices by their respective values for the GDP-weighted G6 economies (i.e. the G7 excluding the UK, for which we do not have data on the number of containers). In several alternative specifications we also show that our global supply chain shock does not mistakenly pick-up increases in geopolitical risk or trade policy uncertainty.
Our results show that supply chain disruptions are a major driver of economic activity and prices – in the euro area as well as in the G6 economies. In the debate about the sources of business cycles, supply chain bottlenecks have long been ignored in both the academic literature as well as the policy debate. Our supply chain shock is global in nature reflecting the interconnectedness of global sourcing. A diversification of supply chains cannot reduce the exposure to shocks. As shown by Kukharskyy et al. (2022), the long-run welfare costs of a decoupling from global value chains exceeds the benefits. Hence, a decoupling is not an option. On the firm level, improving the management of inventories is certainly a way forward in order to reduce the impact of supply chain shocks.
Antolín-Díaz, Juan and Juan F Rubio-Ramírez, “Narrative Sign Restrictions for SVARs,” American Economic Review, 2018, 108 (10), 2802–2829.
Arias, Juan F Rubio-Ramírez, and Daniel F Waggoner, “Inference Based on Structural Vector Autoregressions Identified With Sign and Zero Restrictions: Theory and Applications,” Econometrica, 2018, 86 (2), 685–720.
Benigno, Gianluca, Julian di Giovanni, Jan J Groen, and Adam I Noble, “The GSCPI: A New Barometer of Global Supply Chain Pressures,” Federal Reserve Bank of New York Staff Report No. 1017, 2022.
Boehm, Christoph E, Aaron Flaaen, and Nitya Pandalai-Nayar, “Input Linkages and the Transmission of Shocks: Firm-Level Evidence from the 2011 Tohoku Earthquake,” The Review of Economics and Statistics, 2019, 101 (1), 60–75.
Carvalho, Vasco M, Makoto Nirei, Yukiko U Saito, and Alireza Tahbaz-Salehi, “Supply Chain Disruptions: Evidence from the Great East Japan Earthquake,” The Quarterly Journal of Economics, 2021, 136 (2), 1255–1321.
Finck, David and Peter Tillmann (2022): “The Macroeconomic Effects of Global Supply Chain Disruptions”, BOFIT Discussion Papers 14/2022, BOFIT – The Bank of Finland Institute for Emerging Economies, https://publications.bof.fi/handle/10024/52578.
Furceri, Davide, Yan Carriere-Swallow, Pragyan Deb, Daniel Jimenez, and Jonathan David Ostry, “Shipping Costs and Inflation,” IMF Working Paper 2022/061, International Monetary Fund, 2022.
Kukharskyy, Bohdan, Gabriel Felbermayr, Oliver Krebs and Peter Eppinger (2022): “Decoupling From Global Value Chains“, VoxEU, July 07 2021, https://cepr.org/voxeu/columns/decoupling-global-value-chains
Furceri et al. (2022) use the Suez Canal obstruction as an instrument to identify supply chain shocks.