Disclaimer: The views expressed are those of the author and do not necessarily reflect those of De Nederlandsche Bank, the European Central Bank or the Eurosystem.
In response to swift policy rate hikes by the ECB, commercial bank deposit rates have increased but also diverged across the euro area. In this SUERF policy brief, I discuss the transmission of monetary policy to deposit rates in the euro area, with a focus on the role of concentration in the banking sector. Provided that banks in a more concentrated banking sector hold greater market power, market concentration may explain some of the variance seen in deposit rates across countries. Using country-level and bank-level data for euro area member states, I show that more concentrated banking sectors indeed pass-on unexpected monetary tightening more slowly than their less concentrated counterparts, while they do pass-on unexpected monetary easing more quickly. Heterogeneity in the degree of concentration could thus contribute to heterogeneity in the transmission of monetary policy to deposit rates, at least temporarily.
Amidst the recent historically rapid increase in European Central Bank (ECB) policy interest rates, lending rates as charged by banks across the euro area have shot up, as have time deposit rates paid by commercial banks. In stark contrast, overnight deposit rates have remained quite sticky, also displaying an increasingly large dispersion across economies despite all being exposed to the same ECB interest rates (Chart 1; see also Adalid, Lampe and Scopel (2024)).
This begs the question whether deposit rates are more sluggish in response to both policy rate increases and decreases, and what factors might influence the transmission of monetary policy to deposit rates. In this policy brief, I discuss these issues further, with a focus on the role of banking sector concentration (Chart 2).
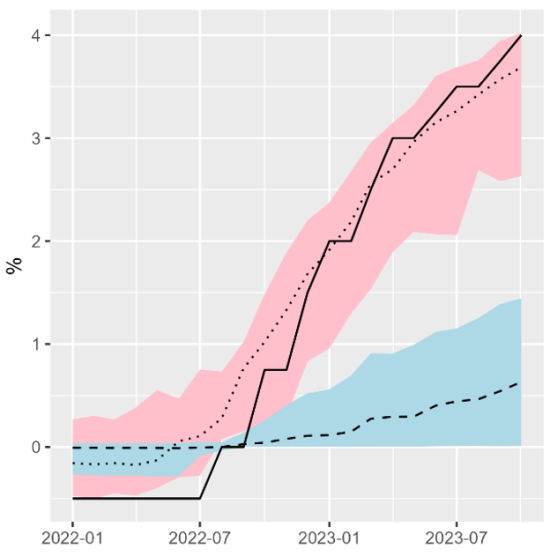
Notes: the continuous line reflects the ECB’s deposit facility rate, the dotted line the country-average time deposit rate and the dashed line the median country-average overnight rate. The light-red range covers the range of country-average time deposit rates across the euro area member states in the sample of Kho (2024) and the light-blue range the country-average overnight deposit rates.
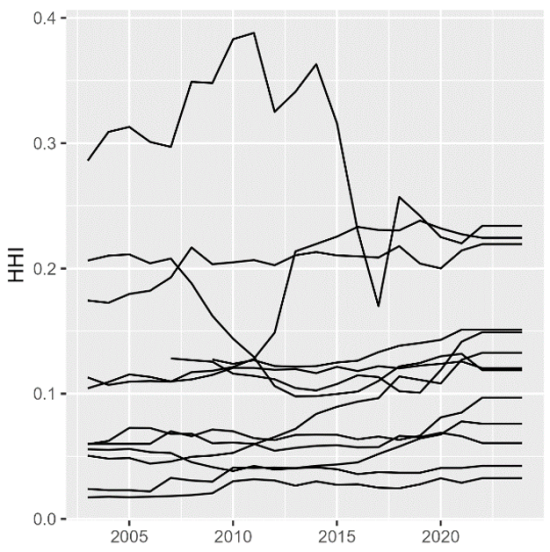
Notes: every line reflects a euro area member state’s HHI (included in the sample). Higher values implies more concentration.
Banks are likely to wish to pass-on policy rate hikes to deposit rates slowly, and cuts quickly (see also e.g. Hannan and Berger (1991) and Neumark and Sharpe (1992)). Given that banks tend to hold assets that have longer fixed-rate periods than their liabilities, passing-on higher policy rates quickly to deposit rates would be costly, potentially undermining their profitability and by extension affecting their ability to fulfil their intermediation tasks. At the same time, depositors may balk at swift decreases in deposit rates and withdraw their deposits, imposing some constraints on bank interest rate setting in the case of declining policy rates.
Whether banks are indeed able to adjust deposit rates asymmetrically to positive and negative changes in policy rates could well depend on how much market power they hold in the deposit market. This is also suggested by a recent literature on the role of deposit market power (see e.g. Drechsler, Savov and Schnabl (2017)), which however has largely focused on the longer-run pass-through.
Recent evidence based on the euro area banking sector on this topic is somewhat scarce. Exploiting error correction models, papers such as Bondt, Mojon, and Valla (2005) analysed the issue of pass-through to deposit and lending rates for the euro area. Moreover, Gambacorta and Iannotti (2007) have looked into whether the response to monetary policy had been asymmetric in Italy between 1985 and 2002.
The issue of market structure has, however, been less explored since the early years of the euro. Leuvensteijn et al. (2013) and Holton and Rodriguez D’Acri (2018) do consider the role of competition or concentration, but largely focus on lending rates. Recent research on euro area deposit markets, instead, has focused more on the until recently more topical transmission of negative policy rates (see e.g. Altavilla, Burlon, et al. (2022), Heider, Saidi, and Schepens (2019) or Ulate (2021)). In the wake of the recent rate hikes, however, an interest in the determinants of the monetary transmission in a broader sense has re-emerged (see e.g. Mayordomo and Roibás (2023)).
In Kho (2024), I provide empirical evidence on the asymmetric response of deposit rates to monetary policy, and relate this to the degree of concentration within a country’s banking sector. I estimate the impact of unexpected positive and negative changes in the ECB’s interest rates on commercial bank deposit rates, focusing on potential asymmetries in the short- to medium-run.
I do so in a panel local projections setting, with country-level data for thirteen euro area member states in the 2003-2023 period and using high-frequency identification for the monetary policy shocks (Altavilla, Brugnolini, et al. (2019)). To assess whether the deposit rate response is (even more) asymmetric in countries with more concentrated banking sectors1, I also interact the monetary policy shocks with a measure of concentration (the Herfindahl-Hirschman Index).2
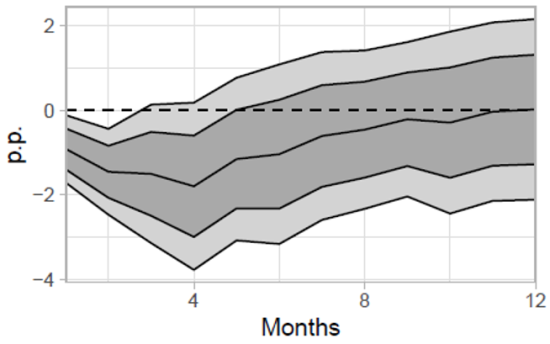
The results show that, after a surprise increase in monetary policy rates, a more concentrated banking sector increases the deposit rate by less and a less concentrated banking sector by more. Chart 3 shows how much the deposit rate (a weighted average of overnight and time deposits) in a more concentrated banking sector deviates from the ‘average’ banking sector, after a 100 basis point surprise hike.
More specifically, the chart shows that a banking sector with an 0.1-point above-average HHI (close to a standard deviation of the HHI across countries) can keep their deposit rates about 40 basis points lower than in the average sector after the surprise hike. Conversely, in a less concentrated banking sector, the deposit rate increase would be higher by the same amount. The deposit rates across countries diverge for a few months, up to about half a year.
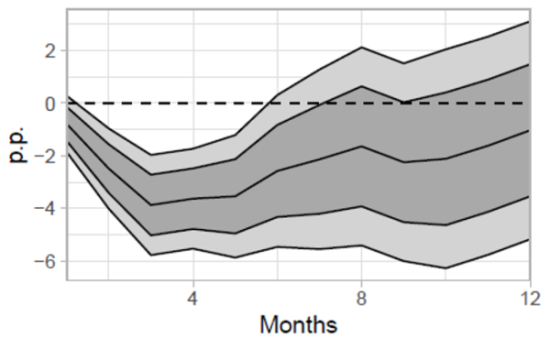
Notes: the chart shows the estimated response of the deposit rate in a 1p above-average HHI banking sector, compared to the average sector, to a 100bps surprise increase in the policy rate, over a horizon of twelve months. As the HHI values range between 0 and 1, divide the estimates by (for example) ten for an economically meaningful estimate. The dark-grey (inside) bands reflect the 68% CI and the light-grey (outside) bands the 90% CI.
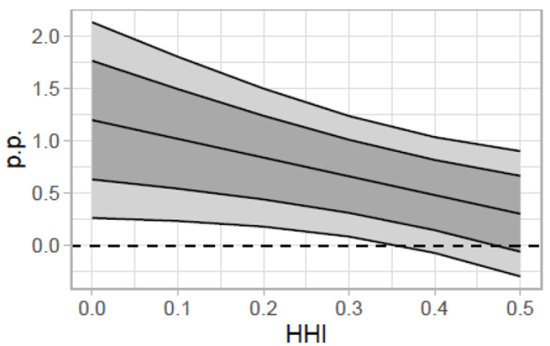
The more concentrated the banking sector is (that is, the higher the HHI measure is), the less the deposit rate has increased and the greater the margin between the policy rate and the deposit rate. This can be seen in chart 4, which combines the effect on the average banking sector and the cross-section of banking sectors by concentration to show how much deposit rates have moved relative to the policy rate, a quarter after the surprise increase in policy rates. After a policy rate increase, deposit rates are sluggish, and thus the distance relative to the policy rate increases. The negative slope in chart 4 reflects that this is more so the case for the more concentrated banking sector.
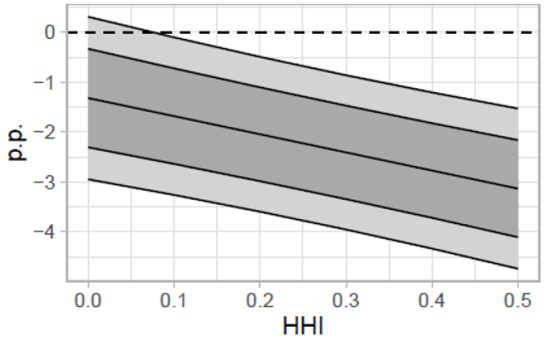
Notes: the chart shows the estimated response of the deposit rate across banking sectors with different HHI values, three months after a 100bps surprise increase in the policy rate. The chart is produced by adding up the response by a sector with an average degree of concentration and the response by sectors with above-average/below-average degrees of concentration (with higher values implying more concentration), i.e. the coefficient displayed in the previous chart. The dark-grey (inside) bands reflect the 68% CI and the light-grey (outside) bands the 90% CI.
In the case of a negative policy rate surprise, more concentrated banking sectors are faster to cut their deposit rates than the average sector. In other words, banks in these sectors restore their margins more quickly than their counterparts in less concentrated banking sectors.
Chart 5 shows that a banking sector that is more concentrated (with a 0.1-point above-average HHI) is able to push deposit rates 20 basis point below the average deposit rate across countries, a quarter after a 100 basis point surprise rate cut. The difference between banking sectors is a bit smaller than in the positive rate surprise case, but the dynamics are similar.
Notes: the chart shows the estimated response of the deposit rate in a 1p above-average HHI banking sector, compared to the average sector, to a 100bps surprise decrease in the policy rate, over a horizon of twelve months. As the HHI values range between 0 and 1, divide the estimates by (for example) ten for an economically meaningful estimate. The dark-grey (inside) bands reflect the 68% CI and the light-grey (outside) bands the 90% CI.
As in the positive rate surprise case, a higher degree of market concentration also goes hand-in-hand with a lower deposit rate, after an unexpected decrease of the policy rate. Given that deposit rates are – on average – slow to decline in response to policy rate cuts, the spread between deposit rates and policy rate narrows. However, chart 6 shows that when adding the effects on the average banking sector and on the cross section, a quarter after the surprise change in policy, more concentrated banking sectors have largely restored the margin between the deposit rate and the policy rate, but less concentrated sectors have not.
Notes: the chart shows the estimated response of the deposit rate across banking sectors with different HHI values, three months after a 100bps surprise decrease in the policy rate. The chart is produced by adding up the response by a sector with an average degree of concentration and the response by sectors with above-average/below-average degrees of concentration (with higher values implying more concentration), i.e. the coefficient displayed in the previous chart. The dark-grey (inside) bands reflect the 68% CI and the light-grey (outside) bands the 90% CI.
The degree of concentration appears to matter for the transmission of monetary policy to deposit rates, at least in the short run. More specifically, the results in Kho (2024) imply that deposit rates are sticky upwards and more flexible downwards for more concentrated banking sectors than less concentrated banking sectors, in the about six months after a surprise change in monetary policy.
The difference is statistically significant and economically meaningful, with deposit rates a few months after a surprise 100 basis point change in monetary policy temporarily diverging by tens of basis points between more and less concentrated banking sectors in the euro area.
Adalid, Lampe and Scopel (2024). Monetary dynamics during the tightening cycle. ECB Economic Bulletin Box, vol. 8.
Altavilla, Carlo, Luca Brugnolini, Refet S. G¨urkaynak, Roberto Motto, and Giuseppe Ragusa (2019). “Measuring euro area monetary policy”. Journal of Monetary Economics 108, pp. 162–179.
Altavilla, Carlo, Lorenzo Burlon, Mariassunta Giannetti, and Sarah Holton (2022). “Is there a zero lower bound? the effects of negative policy rates on banks and firms”. Journal of Financial Economics 144.3, pp. 885–907.
Bondt, Gabe de, Benoit Mojon, and Natacha Valla (2005). “Term structure and the sluggishness of retail bank interest rates in Euro area countries”. ECB Working Paper, no 518.
Drechsler, Itamar, Alexi Savov, and Philipp Schnabl (2017). “The Deposits Channel of Monetary Policy”. The Quarterly Journal of Economics 132.4, pp. 1819–1876.
Gambacorta, Leonardo and S. Iannotti (2007). “Are there asymmetries in the response of bank interest rates to monetary shocks?” Applied Economics 39.19, pp. 2503–2517.
Hannan, Timothy and Allen Berger (1991). “The Rigidity of Prices: Evidence from the Banking Industry”. American Economic Review, 81(4), pp. 938-945.
Heider, Florian, Farzad Saidi, and Glenn Schepens (2019). “Life below zero: Bank lending under negative policy rates”. The Review of Financial Studies 32.10, pp. 3728–3761.
Holton, Sarah and Costanza Rodriguez D’Acri (2018). “Interest rate pass-through since the euro area crisis”. Journal of Banking and Finance 96, pp. 277–291.
Kho, Stephen (2024). “Deposit market concentration and monetary transmission: evidence from the euro area”. ECB Working Paper Series, no 2896.
Leuvensteijn, Michiel van, Christoffer Kok Sorensen, Jacob A. Bikker, and Adrian A.R.J.M. van Rixtel (2013). “Impact of bank competition on the interest rate pass-through in the Euro Area”. Applied Economics 45.11, pp. 1359–1380.
Mayordomo, Sergio and Irene Roibás (2023). “The pass-through of market interest rates to bank interest rates”, Banco de Espana Occasional Paper Series, no 2312.
Neumark, David and Steven Sharpe (1992). “Market structure and the nature of Price Rigidity: Evidence from the market for consumer deposits”. The Quarterly Journal of Economics 107.2, pp. 657–680.
Ulate, Mauricio (2021). “Going negative at the zero lower bound: The effects of negative nominal interest rates”. American Economic Review 111.1, pp. 1–40.
An extension with bank-level data is included in the paper.
The HHI is calculated by summing the market share squared of each individual bank within a domestic banking sector, with the market share calculated by assets.