

This policy brief is based on ECB Working Paper No 3288. The views expressed are those of the authors and not necessarily those of the institutions the authors are affiliated with.
Abstract
Theory suggests inflation risk premia are positive when supply shocks are expected to dominate demand shocks and negative otherwise. These expectations are, however, hard to observe. We read them from the news by counting how often narratives in the Financial Times and Wall Street Journal attribute inflation to demand or supply factors. In both the Euro Area and the United States, inflation risk premia are lower when demand narratives prevail and higher when supply narratives prevail. The link holds at the two-, five- and ten-year horizons, survives controls for economic activity and market uncertainty, and is stronger when investors are more risk averse or inflation is more volatile. Surveys of forecasters, macro-based decompositions, and language models do not subsume the news-based measure.
Asset pricing theory offers a clear prediction. Consider an investor who holds a nominal bond. If inflation falls while consumption growth weakens, as happens after a negative demand shock, the bond’s real value holds up in bad times. In those times, an extra euro is worth more to the investor. Because the bond provides this insurance, the investor will accept a negative inflation risk premium rather than demand extra compensation. If, instead, inflation rises while the economy weakens, as happens after a negative supply shock, the bond loses real value in bad times. The investor then demands a positive premium.
The sign and size of the inflation risk premium therefore reveal which type of shock investors expect to drive macroeconomic fluctuations. The difficulty is that these expectations about future demand and supply shocks cannot be read off directly from any data series. Macroeconomic decompositions of inflation show what happened, not what investors anticipated, and surveys are available only at monthly or quarterly frequency.
We use the text of newspaper articles instead. Our approach builds on Trebbi (2025). An algorithm searches inflation articles for sentences in which journalists explicitly link inflation to a cause, using words such as “because” or “due to”. The cause is then sorted into one of six narrative groups following Andre et al. (2026). Government spending, consumer spending and sentiment, and monetary policy count as demand narratives. Commodities and energy, labour market events, and supply chain problems count as supply narratives. For each month we count the articles with a demand narrative and subtract the number with a supply narrative. We call the difference NetDemand. It is positive when a newspaper mostly attributes inflation to demand drivers and negative when it mostly attributes it to supply drivers. We build the measure from the Financial Times for the Euro Area and from the Wall Street Journal for the United States, covering 2005 to 2024.
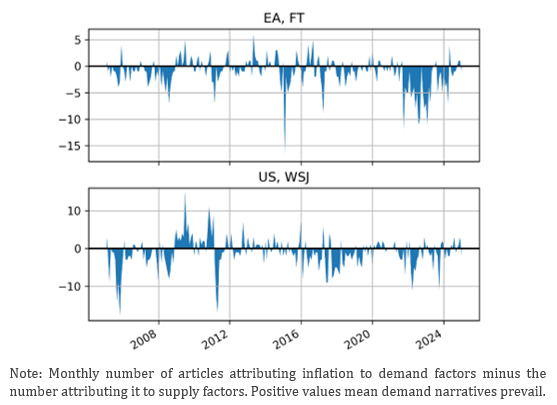
Figure 1 shows the two series. In most months one type of explanation clearly dominates: NetDemand differs from zero in 78% of months for the euro area and 85% for the US. The patterns are also intuitive. On both sides of the Atlantic, NetDemand was strongly negative in 2022, reflecting the energy crisis that followed the Russian invasion of Ukraine. Conversely, NetDemand was positive during the Great Recession in 2009, when weak demand and low inflation characterised the economy.
Figure 1. NetDemand in the Euro Area (Financial Times) and the United States (Wall Street Journal)
We compare NetDemand with estimates of inflation risk premia at two-, five- and ten-year horizons. For the Euro Area, these come from a term structure model applied to inflation-linked swap rates (see Burban et al, 2022). For the United States, we subtract survey-based inflation expectations from breakeven inflation rates.
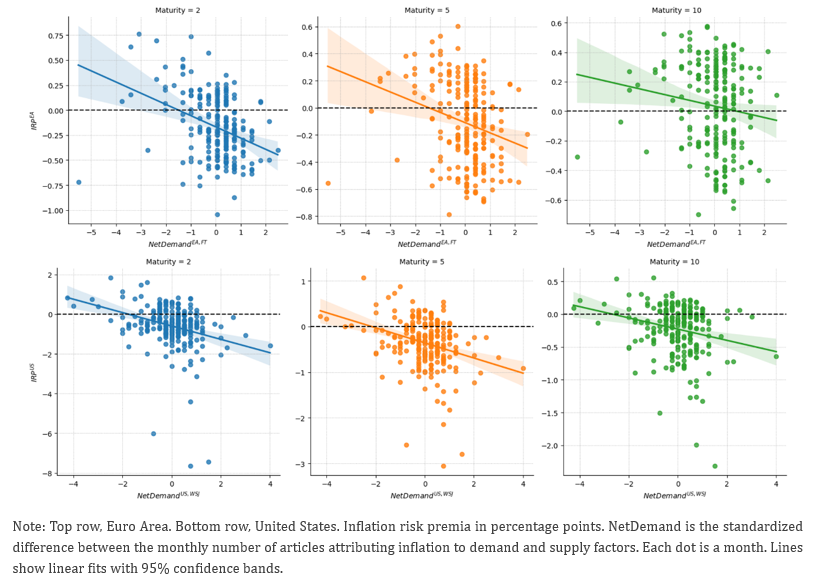
Figure 2 plots each premium against NetDemand. The relationship is negative in every panel, for both economies, and at all three horizons. Premia are higher when the press emphasises supply narratives and lower when it stresses demand narratives, as theory predicts. The effect is largest at short horizons. In the Euro Area, a one standard deviation increase in NetDemand is associated with a premium that is about 11 basis points lower at two years, 8 at five years, and 4 at ten years. The corresponding figures for the United States are about 34, 17 and 9 basis points. The results are unchanged when we control for the composite PMI and the VIX, two variables the literature has linked to inflation risk premia. They are also unchanged when we drop a handful of extreme observations.
Figure 2. NetDemand and inflation risk premia
The six categories also reveal which explanations matter most. Only supply narratives are significantly related to the premium, and the link is strongest for commodities and energy. This echoes work by Hördahl and Tristani (2014), who find that cost-push shocks are the main driver of long-term inflation risk premia in both economies.
Theory also predicts that the connection between narratives and premia should be amplified when investors are more risk averse and when inflation is more volatile, since both raise the price of bearing inflation risk. We test the two channels separately and the evidence differs across the two economies.
In the United States, risk aversion is what matters. We proxy it with the variance risk premium from Bollerslev et al. (2009). A one standard deviation increase almost doubles the relationship between NetDemand and the two- and five-year inflation risk premia. In the Euro Area, inflation volatility is what matters. We capture it with the volatility implied by inflation options, following García et al (2026). Here, the same increase strengthens the relation by about a third at the two-year horizon and by more than half at the five-year horizon. We find no comparable effect for risk aversion in the Euro Area or for inflation volatility in the United States. In both economies the amplification is visible only at short and medium horizons. The plain relationship with NetDemand also remains, so the result is not simply that journalists write more when markets are nervous.
A fair question is whether the news adds anything to what we already have. We test three existing measures of the expected predominance of demand or supply shocks. The first is a decomposition of inflation into demand and supply contributions based on sign restrictions (Shapiro, 2024). The second is the correlation between expected inflation and expected GDP growth across professional forecasters (Fonseca, 2024). The third is a measure built by asking a large language model whether articles describe inflation as demand- or supply-driven (Kwon et al., 2025). Each alternative carries useful information, and the survey-based measure in particular improves the fit for the Euro Area. None of them displaces NetDemand, which keeps a negative and significant relationship with inflation risk premia in every case.
A practical advantage is timing. Newspapers publish every day, whereas surveys and macroeconomic data are usually released at a much lower frequency.
For monetary policymakers, the results show that movements in inflation risk premia can be interpreted at high frequency through the narratives that newspapers attribute to inflation. This gives an otherwise abstract premium an economic story.
They also suggest that the inflation-hedging properties of nominal bonds differ across demand and supply narratives. Whether the same holds for other assets, such as equities or real estate, is a natural question for future research.
Andre, P., I. Haaland, C. Roth, M. Wiederholt and J. Wohlfart (2026). Narratives about the Macroeconomy. Review of Economic Studies.
Bollerslev, T., G. Tauchen and H. Zhou (2009). Expected stock returns and variance risk premia. Review of Financial Studies, 22 (11), 4463-4492.
Burban, V., B. De Backer, F. Schupp and A. L. Vladu (2022). Decomposing market-based measures of inflation
compensation into inflation expectations and risk premia. ECB Economic Bulletin, Box, Issue 8.
Fonseca, L. (2024). Box 2 Using the SPF to identify supply and demand factors affecting estimated inflation risk
premia in market-based measures of inflation compensation. In A look back at 25 years of the ECB SPF, ECB Occasional Paper 364.
Fonseca, L., G. Martorana, F. Schupp and G. Trebbi (2026). Inflation Narratives and Risk Premia. ECB Working Paper 3288.
García, J.A., R. Gimeno, P. Hinds, H. Su and M.V. Tretyakov (2026). Understanding inflation: insights from the term structure of inflation risks. ECB Working Paper 3294.
Hördahl, P. and O. Tristani (2014). Inflation risk premia in the euro area and the United States. International Journal of Central Banking.
Kwon, B., T. Park, P. Rungcharoenkitkul and F. Smets (2025). Parsing the pulse, decomposing macroeconomic sentiment with LLMs. BIS Working Paper 1294.
Shapiro, A. H. (2024). Decomposing Supply and Demand Driven Inflation. Journal of Money, Credit and Banking.
Trebbi, G. (2025). Inflation Narratives and Expectations. ECB Working Paper 3158