menu
close

Author(s):

Mojca Lindič | Bank of Slovenia

Keywords:

CESEE , Global Value Chains , GVC Participation

JEL Codes:

C33 , F14 , F40 , F62

Based on: Lindic , M. (2022). Global Value Chain Integration in CESEE and Euro Area Economies. Delovni zvezki Banke Slovenije. Paper No. 3/2022.

This analysis studies and compares integration within the global value chains (GVCs) of Central, Eastern, and South-Eastern (CESEE) European countries that are EU members and the first twelve countries that entered the euro area (EA 12). In recent years, GVC participation was the highest among small economies, i.e. CESEE members of the euro area, while the EA 12 participated in more technologically advanced sectors within GVCs than CESEE countries. The empirical analysis suggests that between 2005 and 2015, GVC participation was positively correlated with changes in global demand, and negatively with country size and wage level. On the other hand, when reducing the sample only to CESEE countries, the results also indicate to positive linkages between GVC participation and FDI, which could be a result of technological spillovers. These findings imply the importance of FDI for countries undergoing the convergence process.

1. Introduction

With the aim of optimizing production processes, firms offshore and seek inputs abroad, which makes their production processes more fragmented, complex, and divided among several countries (Gunnella, Fidora, and Schmitz, 2017). This increases linkages among firms, as they no longer trade only in finished products but increasingly also in intermediate goods (Cappariello et al., 2020). In turn, this has a significant impact on the composition of international trade and official trade statistics. Therefore, since studying net imports and exports is no longer a sufficient measure for analysing the effect of international trade on domestic economies, studying global value chains (GVCs) has gained importance (WTO, 2019).

The main advantages of GVCs are threefold. First, GVCs have enabled countries to transition from specialisation in trade in goods to specialisation in activities with a higher comparative advantage while outsourcing those with lower comparative advantage to foreign countries. In this respect, GVC participation is especially important for small and open economies, which face substantial technological and natural resource constraints in particular production activities. Second advantage is the creation of job opportunities, while third is facilitating technological and innovation transfers (WTO, 2017). More precisely, the technology embedded in imported inputs has proven to be an important aspect of technology diffusion, while studies also show that the increased foreign value added in countries’ exports has a positive bearing on the usage of high-skilled labour and hourly compensation. This could be due to imported inputs creating a positive stimulus for productivity growth via learning, variety, or quality factors (ECB, 2019). As a result, GVC participation has a positive impact on a country’s investment level and productivity, which in turn has a positive effect on GDP per capita.

In the context of the European Union (EU) single market, GVCs present an important channel for technology and knowledge transfers among member states, which should in turn have a positive impact on EU productivity. In general, involvement in GVCs has been increasing among euro area (EA) countries in recent decades. This process has been stimulated by the expansion of the currency area and synchronised regulations and institutional framework within the EU, which serve to promote cross-border production chains. Thus, EA countries have been more integrated in GVCs than other large economies (Gunnella, Fidora, and Schmitz, 2017).

This study builds its analysis around Central, Eastern, and South-Eastern European (CESEE) countries that are members of the EU, and can be classified into euro and non-euro area members. The former (i.e. CESEE EA) are Estonia, Latvia, Lithuania, Slovakia, and Slovenia, while the latter (i.e. CESEE non-EA) are Bulgaria, Croatia, Czech Republic, Hungary, Poland, and Romania. The CESEE countries share some common features. Many of them are small and open countries, located near larger EU economies and have strong relationships with them. During the 1990s, they transitioned to market economies, while as of 2000, these countries also underwent the process of real convergence towards the EU average (Žuk et al., 2018). Finally, the first 12 countries that entered the euro area (EA 12) are taken as a benchmark (i.e. Austria, Belgium, Finland, France, Germany, Greece, Ireland, Italy, Luxembourg, Netherlands, Portugal, and Spain). The analysis focuses especially on studying: (i) how (dis)similar are the CESEE economies in terms of their GVC integration with respect to EA 12; (ii) what role do country characteristics and institutions play in terms of countries’ GVC involvement; and (iii) whether there are any significant differences in the CESEE euro area and non-euro area members with respect to correlations between the GVC participation and countries’ characteristics and institutions.

2. Recent GVC Developments in Selected Countries

The GVC analysis in this study uses the Trade in Value Added (TiVA) dataset, which is provided by the OECD and considers a country’s value added in the production of goods and services. The 2018 edition includes information for 64 economies in the period between 2005 and 2015 (TiVA, 2019). The analysis was completed before the 2021 edition of the TiVA database was released.

2.1 Measures of GVC Integration

Previous studies introduced new measures in order to fully capture changes in bilateral trade balances and countries’ involvement in GVCs. Countries’ position and participation within GVCs is derived by considering the foreign value added in the imported intermediate input content of exports, herewith FVA. It presents the foreign value added embedded in inputs that are used in the production of later exported outputs. Second is the IV, which combines trade flows within the domestic value-added component that are exported to other countries. It measures the value added of intermediate goods that are used as inputs in the foreign country’s production and are later exported further by the foreign country (Koopman, Wang, and Wei, 2014). The measures offer a differentiation between backward and forward participation in the GVC, where the latter can be associated with the technologically more advance stages of production. The total GVC participation measure is then calculated as the sum of FVA and IV in the share of exports, while the GVC position index is calculated as the log ratio of the two measures, i.e. a country’s supply of intermediates used in other countries’ exports to the use of imported intermediates in its own production (Aslam, Novta, and Rodrigues-Bastos, 2017). The GVC participation measure therefore defines the extent of a country’s involvement in GVCs and shows the importance of the global supply chain for that country, while the GVC position index positions the country within GVCs and shows its relative downstream or upstream position in comparison with other countries (Koopman, Wang, and Wei, 2014).

2.2 Descriptive Statistics on GVCs

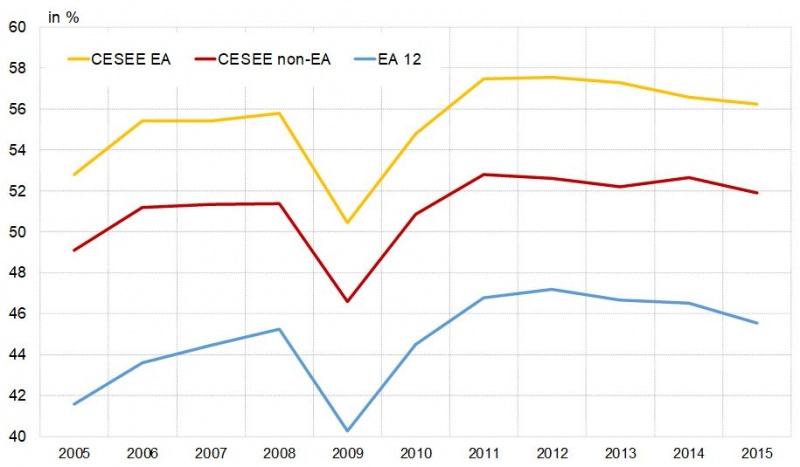
The participation in GVCs of the selected country groups has intensified between 2005, the first available year in the analysis, and 2015, the latest available year (the left chart in Figure 1), despite a marked decline after the onset of the economic crisis. One of the reasons for the former could be the intra-euro area trade, which is fostered by the common regulatory framework established within the European Single Market and the currency area. On the other hand, the reason for the latter could be, in addition to the decrease in economic activity and the increased uncertainty, onshoring, which relocated production processes closer to the demand markets and thus shortened GVCs (Gunnella, Fidora, and Schmitz, 2017). Descriptive statistics also show that the highest degree of the GVC participation among the sampled country groups is seen for CESEE members of the euro area, followed by CESEE non-euro area members and the EA 12. This indicates that smaller countries are relatively more integrated into GVCs.

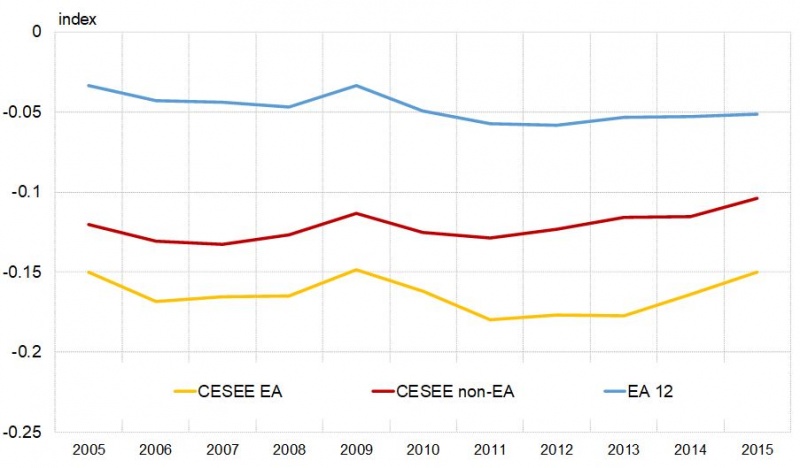
Figure 1: GVC participation and position measures

GVC participation (left panel)

 width=

GVC position (right panel)

 width=

Source: TiVA, author’s calculations. Notes: CESEE EA: Estonia, Latvia, Lithuania, Slovakia, and Slovenia; CESEE non-EA: Bulgaria, Croatia, Czech Republic, Hungary, Poland, and Romania; EA 12: Austria, Belgium, Finland, France, Germany, Greece, Ireland, Italy, Luxembourg, Netherlands, Portugal, and Spain.

Nevertheless, current developments within international trade are not yet captured in the TiVA database. In the last few years, GVC participation has been first hindered by the USA-China trade war, before being significantly obstructed by the onset of the coronavirus pandemic (UNCTAD, 2020). Thus, several factors have contributed to a slowdown in GVC participation in the recent period; rising global protectionism, the increased unpredictability of transport costs, declining FDI flows, and rising labour costs in emerging economies (Cigna, Gunnella, and Quaglietti, 2022). Although the sample precedes the important events that contributed to a slowdown in the GVC integration in general, it can be assumed that comparison among countries stays valid.

Going further, estimating GVC position shows that all considered country groups are located downstream within GVCs (the right chart in Figure 1). This is evident from the negative GVC position indices for the entire observation period, which indicate that all three country groups use more foreign inputs in their export production than they supply intermediate products to other countries. The figure also confirms that the more integrated and open the countries are, the more downstream their GVC position is. Which could point to particular specialisation of these countries in assembly activities within the pan-European contribution to GVCs (Gunnella, Fidora, and Schmitz, 2017). Nevertheless, a lower GVC position does not necessarily contribute negatively to GDP, and vice versa, since a higher share of domestic value added in gross exports might not necessarily point to a higher exported total value added and higher GDP. If a country uses inferior domestic inputs in its production, instead of importing them from abroad, this will likely result in fewer gross exports and lower total value added exports (WTO, 2019).

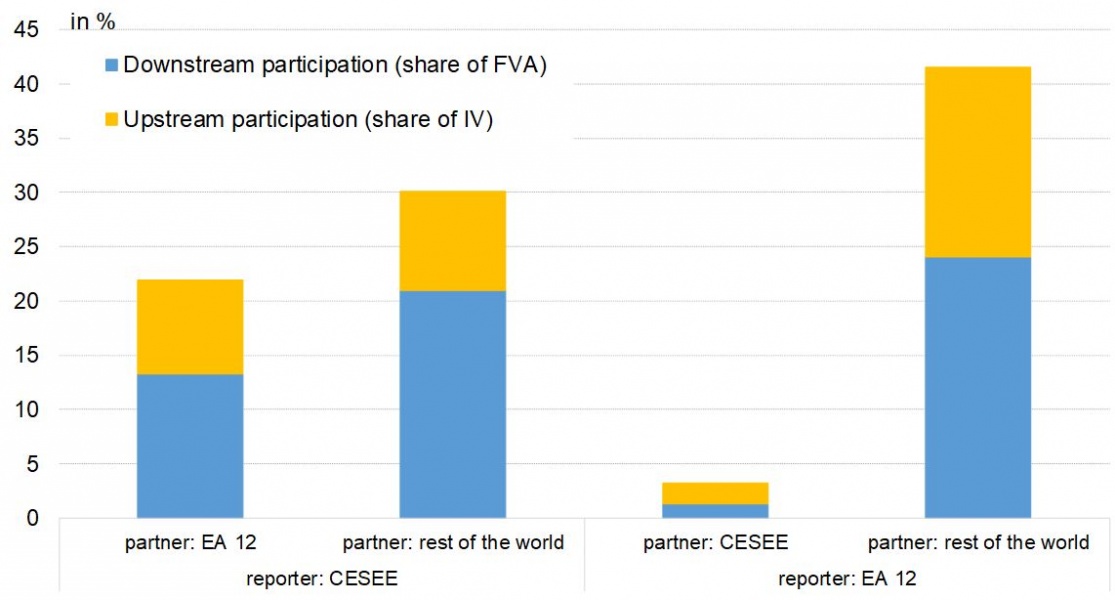
Based on bilateral GVC participation statistics, EA 12 countries represent an important GVC partner for the CESEE group. In Figure 2, GVC participation for each reporting country group is broken down by partners of interest, i.e. the remaining country group and the rest of the world. Within the CESEE group, more than 40% of the GVC participation is based on integration with EA 12 countries. On the other hand, GVC participation of the EA 12 group is less dependent on integration with the CESEE group as the proportionate share is lower than 10%. Especially due to its size and specialisation in the production of transport equipment, Germany plays a pivotal role in the euro area’s GVC integration.

Figure 2: GVC participation breakdown by reporting and partner country groups (2005–2015 average)

 width=

Source: TiVA, author’s calculations. Notes: CESEE: Bulgaria, Croatia, Czech Republic, Estonia, Hungary, Latvia, Lithuania, Poland, Romania, Slovakia, and Slovenia; EA 12: Austria, Belgium, Finland, France, Germany, Greece, Ireland, Italy, Luxembourg, Netherlands, Portugal, and Spain.

Since integration within GVCs can vary between sectors and countries, this analysis also examines possible differences in GVC participation across sectors in the CESEE and EA 12 countries. In general, services are involved in more forward linkages, i.e. upstream participation, whereas manufacturing uses relatively more foreign inputs in their production processes. In this respect, the largest suppliers in the world tend to be electrical and machinery sectors in China and Germany, whereas the highest value added is created in the financial and business services of the USA and Germany (Ignatenko, Raei, and Mircheva, 2019). This analysis shows that GVC participation, export volume and export share in CESEE and EA 12 are the highest in the industry sector. In contrast, GVC participation is the lowest in public administration, education, and health. Finally, the GVC position is negative in all country group sectors, reflecting their downstream position within the GVCs, while all sectors in the EA 12 are positioned higher than in the CESEE group.

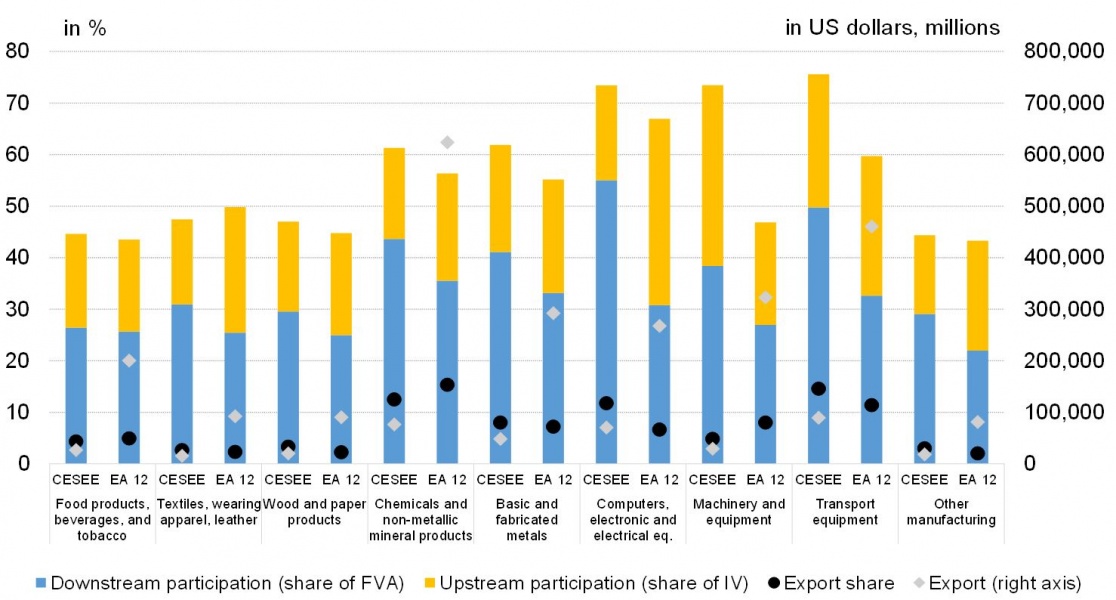
Going forward, since the analysis on aggregated sectors concluded that the highest GVC participation was within the industry sector, which is largely comprised of the manufacturing sector, Figure 3 shows GVC participation within the manufacturing sector in greater detail. Within the CESEE country group, GVC participation was the highest in the transport equipment subsector, which is important for these countries as many of them participate in car assembly activities (see for example Huidrom et al., 2019, and De Backer and Miroudot, 2013). On the other hand, the GVC participation within the EA 12 group was the highest in the subsector of computers, electronic and electrical equipment. With respect to GVC position, all manufacturing subsectors within the EA 12 group were positioned more upstream than within the CESEE group. In addition, considering Eurostat’s high-tech classification of manufacturing industries (Eurostat, 2019), the highest export share and GVC participation of the EA 12 were in more technologically advanced sectors compared to the CESEE group. Taking into account the latter and the fact that the EA 12 country group is a very important partner for CESEE countries in terms of their GVC participation, this could suggest that the EA 12 are an important source of knowledge and technology transfers for CESEE countries.

Figure 3: GVC participation breakdown within manufacturing sector for the CESEE and EA 12 country group (2005–2015 average)

 width=

Source: TiVA, author’s calculations. Notes: CESEE: Bulgaria, Croatia, Czech Republic, Estonia, Hungary, Latvia, Lithuania, Poland, Romania, Slovakia, and Slovenia; EA 12: Austria, Belgium, Finland, France, Germany, Greece, Ireland, Italy, Luxembourg, Netherlands, Portugal, and Spain.

2.3 Empirical Analysis

The empirical analysis studies in more detail the correlations between various determinants and institutional factors, and GVC participation of CESEE and EA 12 countries. The analysis takes into account the period between 2005 and 2015, using the pooled OLS model with cluster-robust standard errors, which were corrected for clustering on the country level, and provides some interesting conclusions. First, the basic model shows that, when considering the entire sample, the GVC participation is positively correlated with global demand, and negatively with country size and wage level. An especially interesting result emerges when taking into account only CESEE countries, as GVC participation becomes positively associated with FDI. Since the latter is a measure of technological spillovers, this could indicate to technology and knowledge transfers within GVCs and point to the aforementioned importance of technological diffusion for CESEE countries, which are still undergoing the convergence process. In addition, differences with regard to members inside and outside the euro area within the CESEE group also reveal some variations in correlations between the two country groups, which could be due to their different size and level of economic development. The latter was also confirmed by Ignatenko, Raei, and Mircheva (2019), who demonstrate that institutional factors, such as quality of infrastructure, have an important role for determining GVC participation.

With the aim of tackling the small number of observations and gaining additional interpretive power, an empirical estimation of the gravity-type regression models was included in the sensitivity analysis. The results of the basic and sensitivity analyses are in general consistent, where the gravity model also allows for evaluating partner-specific factors, which account for bilateral trade costs. More precisely, bilateral distance and common colonial relationship between trading partners appear to have the most significant linkages with GVC participation. In this respect, the colonial relationship controls for whether the countries have ever been in a colonial relationship, where the latter includes also historical colonial ties or past territorial configurations as for example the Austro-Hungarian Empire.

3. Conclusions and Policy Implications

To sum up, this study analyses the GVC engagement of Central, Eastern, and South-Eastern European countries (CESEE) and the first twelve euro area member states (EA 12). The main purpose of the study was (i) to analyse the GVC integration of CESEE and EA 12 countries, (ii) to empirically analyse correlations between various institutional factors and the GVC involvement, as well as (iii) to empirically analyse whether there are any significant differences in these correlations between CESEE euro area and CESEE non-euro area members. Based on the descriptive statistics and regression results in this study, GVC participation is especially important for small and open economies as it facilitates the transfer of knowledge and technology through imported inputs, which is even more pronounced and elevated within the EU Single Market.

Based on the conclusions of this study, some policy implications can be drawn. By studying the types and origins of imported inputs, and their participation and position within GVCs, policy-makers can assess which skills and occupations are most sought after by firms and can consequently adjust their country’s active labour market policies. For example, if the GVC participation is concentrated mostly in less technologically advanced sectors, policy-makers can adjust their policies accordingly in order to promote activities in sectors with higher value added. Nevertheless, although integration into GVCs presents one of the important sources of technological diffusion for smaller and less developed countries, investment and promotion in the development of their own knowledge and technology is equally important. In this vein, this study’s findings could also be relevant for future policy implications in terms of CESEE convergence towards EA 12. Despite the ongoing convergence process within CESEE countries, their GVC participation still consists of less technologically advanced sectors compared to the EA 12. Therefore, in order to continue with the convergence process, further structural changes would be needed in these countries with the aim of transitioning to even more technology- and knowledge-based economies, and to increase their own technological capacity and R&D.

The main contributions of this study are the inclusion of various institutional factors in the analysis, and differentiation between CESEE EA and CESEE non-EA country groups. In this respect, the empirical analysis controls for several economic and social drivers. On the other hand, the main limitation of the current analysis is the relatively short observation period, which does not enable the inclusion of numerous control variables. Although this drawback was somewhat mitigated in the sensitivity analysis, future analyses could address this issue in more detail. Moreover, future studies could also empirically analyse correlations between institutional factors and the GVC position, and exploit additional bilateral time-varying regressors in the gravity specification.

References

Aslam, A., Novta, N., and Rodrigues-Bastos, F. (2017). Calculating trade in value added. IMF working paper, Paper No. WP/17/178. Available at: https://www.imf.org/en/Publications/WP/Issues/2017/07/31/Calculating-Trade-in-Value-Added-45114

Cappariello, R., Gunnella, V., Franco-Bedoya, S., and Ottaviano G. (2020). Rising protectionism and global value chains: quantifying the general equilibrium effects. ECB Working Paper Series, Paper No. 2360.

CEPII Database (2020). Available at: http://www.cepii.fr/cepii/en/bdd_modele/presentation.asp?id=8

Cigna, S., Gunnella, V., and Quaglietti, L. (2022). Global value chains: measurement, trends and drivers. ECB Occasional Paper Series, Paper No. 289.

De Backer, K. and Miroudot, S. (2013). Mapping Global Value Chains. OECD Trade Policy Papers, Paper No. 159.

ECB (2019). The impact of global value chains on the euro area economy. ECB Working Group on Global Value Chains, Occasional Paper Series, Paper No 221. Available at: https://www.ecb.europa.eu/pub/pdf/scpops/ecb.op221~38185e6936.en.pdf

Eurostat (2019). Glossary: High-tech classification of manufacturing industries. Available at: https://ec.europa.eu/eurostat/statistics-explained/index.php/Glossary:High-tech_classification_of_manufacturing_industries

Eurostat (2020). Database. Available at: https://ec.europa.eu/eurostat/data/database

Gunnella, V., Fidora, M., and Schmitz, M. (2017). The impact of global value chains on the macroeconomic analysis of the euro area. Economic Bulletin, Issue 8. Available at: https://www.ecb.europa.eu/pub/pdf/ecbu/eb201708.en.pdf?098fecf8c32c2fc25cc6c334adde0f91

Huidrom, R., Jovanovic, N., Mulas-Granados, C., Papi, L., Raei, F., Stavrev, E., Wingender, P. (2019). Trade Tensions, Global Value Chains, and Spillovers: Insights for Europe. International Monetary Fund, European Department Paper Series, Paper No. 19/10.

Ignatenko, A., Raei, F., and Mircheva, B. (2019). Global Value Chains: What are the Benefits and Why Do Countries Participate? IMF working paper, Paper No. WP/19/18.

Koopman, R., Wang, Z., and Wei, S.-J. (2014). Tracing Value-Added and Double Counting in Gross Exports. American Economic Review, 104 (2), 459–494.

TiVA Database (2019). Available at: https://www.oecd.org/sti/ind/measuring-trade-in-value-added.htm

UNCTAD (2020). Coronavirus outbreak has cost global value chains $50 billion in exports. Available at: https://unctad.org/en/pages/newsdetails.aspx?OriginalVersionID=2297

UNCTAD FDI (2020). Database on Foreign direct investment. Available at: https://unctadstat.unctad.org/wds/TableViewer/tableView.aspx?ReportId=96740

UNCTAD Bilateral FDI Statistics (2019). Available at: https://unctad.org/en/Pages/DIAE/FDI%20Statistics/FDI-Statistics-Bilateral.aspx

WIOD (2020). World Input-Output Database. Available at: http://www.wiod.org/home

WITS (2020). World Integrated Trade Solution database. Available at: https://wits.worldbank.org/CountryProfile/en/Country/WLD/Year/2018/TradeFlow/Export/Partner/by-country

WTO (2017). Measuring and Analyzing the Impact of GVCs on Economic Development. Global Value Chain Development Report. Available at: https://www.wto.org/english/res_e/publications_e/gvcd_report_17_e.htm

WTO (2019). Technological innovation, supply chain trade, and workers in a globalized world. Global Value Chain Development Report. Available at: https://www.wto.org/english/news_e/news19_e/publ_15apr19_e.htm

Žuk, P., Polgar, E. K., Savelin, L., del Hoyo, J. L. D., and König, P. (2018). Real convergence in central, eastern and south-eastern Europe. Economic Bulletin, Issue 3. Available at: https://www.ecb.europa.eu/pub/pdf/ecbu/eb201803.en.pdf 

About the authors

Mojca Lindič

Mojca Lindič is a researcher at the Analysis and research department at the Banka Slovenije (Bank of Slovenia). There, her main research interest is in labour market topics. She received her MSc in Economics from the Tilburg University and her PhD in Economics from the School of Economics and Business, University of Ljubljana. Her work has been published in several domestic and international journals.

More on these topics

Tags: