We are grateful to Elizaveta Archanskaia, Leonor Coutinho, Joao Nogueira Martins, Nicolas Philiponnet, Matteo Salto and Wouter Simons for helpful comments. This Policy Brief is based on Licchetta, M. and Mattozzi, G. (2025). Corporate margins and inflation during the post-COVID-19 period in the euro area. Quarterly Report on the Euro Area, Vol. 24, n1. European Economy Institutional Paper n. 322. The views expressed in this document are solely those of the author(s) and do not necessarily represent the official views of the European Commission.
Abstract
This note contributes to the debate on the role of corporate profits in the recent inflation episode, stirred by the significant increase in firms’ unit profits and the profit share in 2021, well above historical levels. Although these two variables declined in 2022 in most sectors, they remained above pre-COVID-19 levels in 2023, approaching pre-COVID levels only in 2024. The elevated profits in the post-COVID-19 period resulted from a mostly temporary phenomenon reflecting higher input cost-inflation rather than more structural factors, including weak competition. There is no compelling evidence that firms might take advantage of higher inflation in 2021-22 to increase their markups more than during other (non-accelerating-inflation) times. Consistent with previous studies, it is found that firm-level markups increased in the euro area between 1995 and 2023, with the increase being mainly driven by firms with the highest markup. However, these markups increased less during the 2020-2023 period than on average over the whole estimation period. The estimated markups show procyclical behaviour (rising with productivity) and decline with the cost of goods sold (a measure of variable costs). This suggests that firms increase markups when they become more efficient, but lower markups to accommodate higher cost of production for example to maintain competitiveness. Capital expenditures and spending on R&D are also found important drivers of markups, suggesting that firms with greater innovation, efficiency and investment have higher markups.
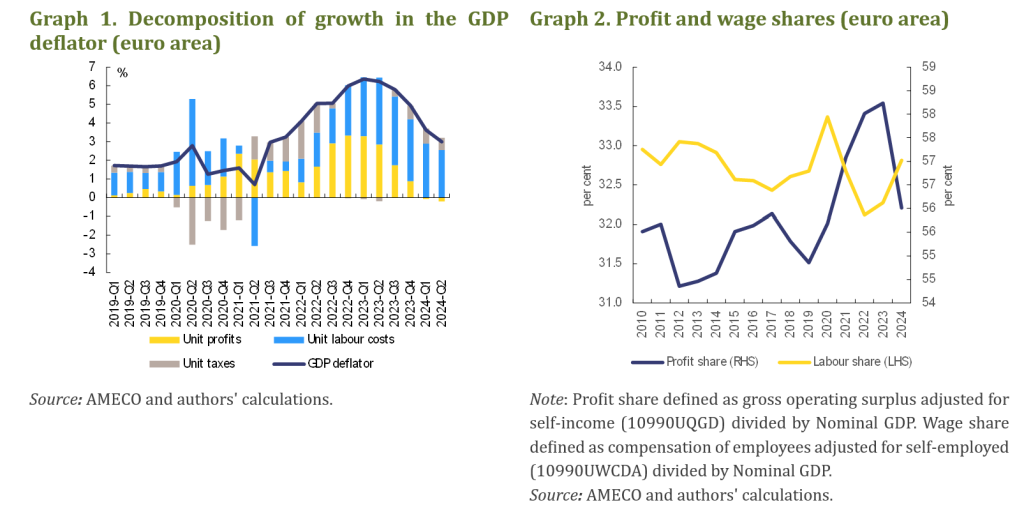
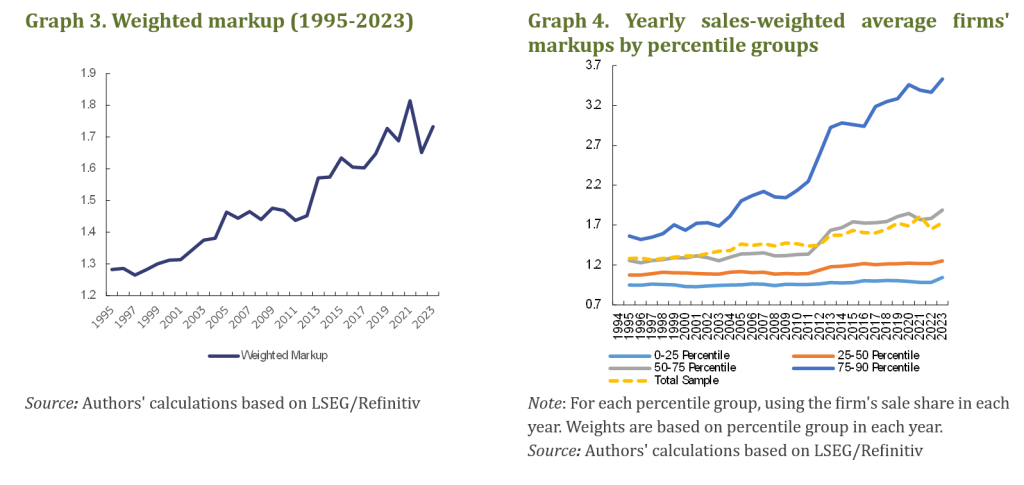
Despite notable cross-country differences, unit profits have contributed to driving domestic inflation in the euro area during 2022 and 2023, as reflected in the increase in the GDP deflator (Graph 1). The contribution of unit profits – defined as gross operating surplus and mixed income per unit of output – to the increase in inflation has attracted considerable attention from economic analysts and policymakers 1. Fears were raised that, in a context of high inflation and blurred price signals, firms might be increasing prices opportunistically (a phenomenon also known as greedflation). This was accompanied by the observation that in parallel there was an increase in the profit share and a corresponding drop in the wage share (Graph 2).
Earlier analyses based on national accounts suggested that the surge in unit profits in 2022 was likely to be a temporary phenomenon, reflecting the pass-through of higher non-wage input costs rather than more structural factors, including weak competition and higher markups (European Commission, 2023). This finds support in the reversion of the labour share decline that had already started in 2022 (Graph 2).
This note, which is based on Licchetta and Mattozzi (2025), contributes to the debate on the role of corporate profits, by analysing the evolution of corporate markups using firm-level data from LSEG/Refinitiv on large companies listed on the stock market2. Notably, it documents trends in markups and analyses the determinants of changes in firms’ markups using regression analysis. It then uses those markups to analyse the correlation between the growth in markups and in producer prices by industry.
Before turning to the data, it is useful to clarify the concepts of markups, profits, and market power. A markup is the ratio of a firm’s price to its marginal cost of production, measuring the extent to which a firm can charge above the cost of producing an additional unit. Markups are therefore a direct indicator of a firm’s market power, i.e., its ability to influence prices rather than being a price taker. By contrast, unit profits (from national accounts) capture the share of value-added accruing to capital after paying wages and other costs. While markups and profits are related, they are not synonymous: profits can increase due to higher demand or lower costs without a change in markups, and markups can rise without necessarily increasing overall profitability if sales volumes decline. Hence, analysing markups allows us to isolate the pricing behaviour linked to market power and assess its potential role in driving inflation.
Recent research based on firm-level data has documented a general increase in markups over time in several advanced economies and has highlighted the most direct and immediate impact on inflation rates. De Loecker and Eeckhout (2018) find that markups have added on average over 1 ppt each year to measured inflation rate across the G7 economies between 1980-2016. Since 1980, they estimate that the sales-weighted markup for the average firm across countries has risen by a remarkable 50 ppt. Similarly, Faryaar (2025) finds for Canada an increase in markups between 2001 to 2018, ranging from 6.7% to 13.3%, according to the different measures of variable costs used.
Yet, the role of market power in the 2021–2023 inflation spike remains debated. Some studies discuss the relation between inflation and margins and highlight that companies with market power may have taken advantage of supply chain disruptions and high demand to raise prices3. However, other studies based on firm-level data suggest that markup increases were not a main cause of inflation. For example, evidence for Belgium and Italy suggests that markups played no role in the recent increase in profits4. Archanskaia et al. (2024) provide evidence that the relative dynamics of costs and prices varied across sectors. The authors report some initial evidence of a negative relationship between cost increases and price increases, suggesting that sectors which experience relatively big increases in production costs were less likely to fully pass them on to the consumer by raising the price of their output5.
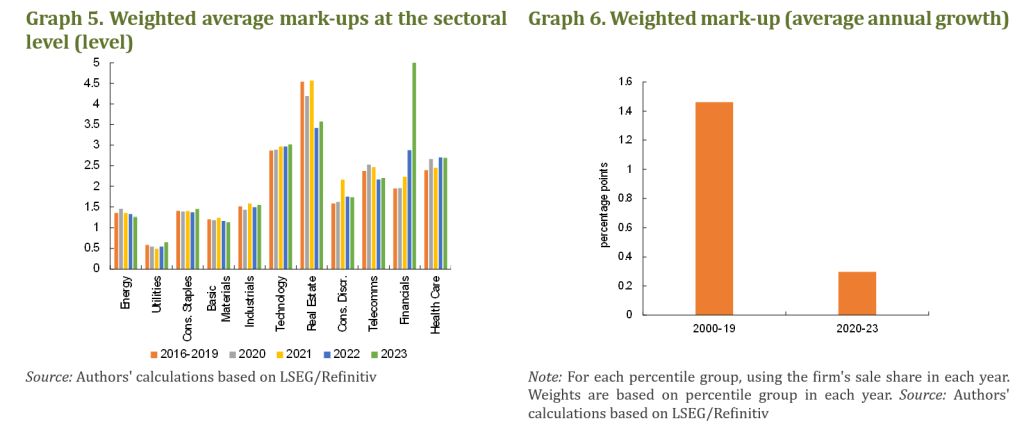
To assess the impact of markups on inflation in the euro area, we first estimate the aggregate euro area markup level following De Loecker et al. (2020). To do so, we use a proxy for firms’ actual markups as the ratio between sales and the cost of goods sold (COGS)6 times the output elasticity of the variable inputs to production using LSEG/Refinitiv data on individual firms’ financial statements7. The aggregate markup is obtained by weighting each firm by its sales share in total sales and summing for each year8.
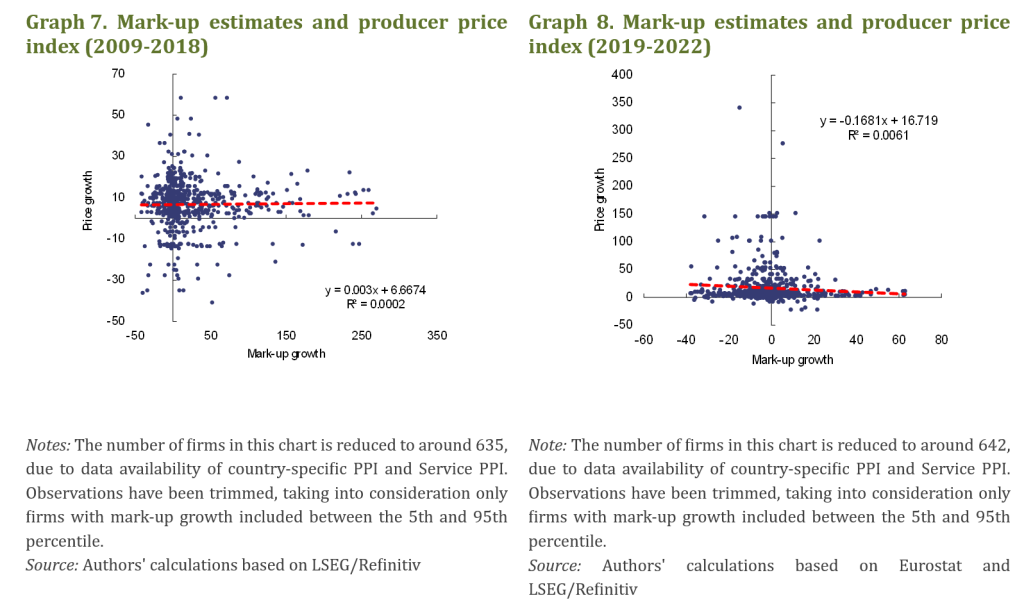
Overall, the weighted aggregate markup increased steadily between 1995 and 2023. However, most of the increase occurred between 2009 and 2019 (Graph 3). The evolution of the distribution of the estimated markups over time (Graph 4), suggests that the increase in markups is heavily concentrated in the upper tail of the distribution—companies whose markups are in, say, the top quartile. Lower markup firms had their markups broadly unchanged. Markups among firms in this upper quartile of the distribution have, on average, increased by a remarkable 73% between 2009 and 2023. This is broadly consistent with previous results in the literature9.
Our analysis finds no compelling evidence that the price-setting behaviour of firms has changed after the pandemic.
No structural change in markups: Focusing on the 2019-23 period, overall, markups have remained broadly unchanged in almost all sectors, compared to pre-COVID-19 levels (Graph 5). The main sizeable increase has been registered in the financial sector, where markups spiked in 2023, likely due to differences in the speed and extent of the pass-through of policy interest rates to deposit and lending rates. In particular, since the COVID-19 crisis, companies included in our database did not increase their markup at a faster pace than before the COVID-19 crisis (on average). The weighted markup indicator increased over time, by around 1.5 p.p. per annum on average between 2000 and 2019 (Graph 6) but increased by less than half a percent on average after the COVID-19 crisis (2020-23). This suggests that markups have played no major role in the post-COVID-19 inflation episode. In 2022, when the largest increase in inflation was observed, both weighted and unweighted markup estimates actually declined as the cost of goods sold increased faster than total sales. Changes in the estimated markup over the 2020-23 period across the distribution (not shown in the chart) are also smaller than the past average annual change.
No Correlation Between Markups and Sectoral Price Increases: We assess whether firms that exhibited greater markup growth are in industries that experienced greater price increases over the 2009–2022 period. We focused on 2019–2022 to address the concern that market power has been an important driver of inflation. In our matched dataset10, we found no robust correlation between changes in markups and the producer price index (that reflects changes in the prices at which firms sell their goods) especially during the post-COVID-19 period. We find a weak and positive correlation over the 2009-2018 period between our markups and the increase in the producer price index (Graph 7) but there is no positive correlation between 2019-2022 (Graph 8). This means that firms that exhibit greater markup growth have not been in industries that experienced greater price increases. One implication is that the increase in profits is unlikely to be related to an increase in markups but rather to the fact that prices increased in proportion to the increase in marginal costs, while wage costs remained relatively stable.
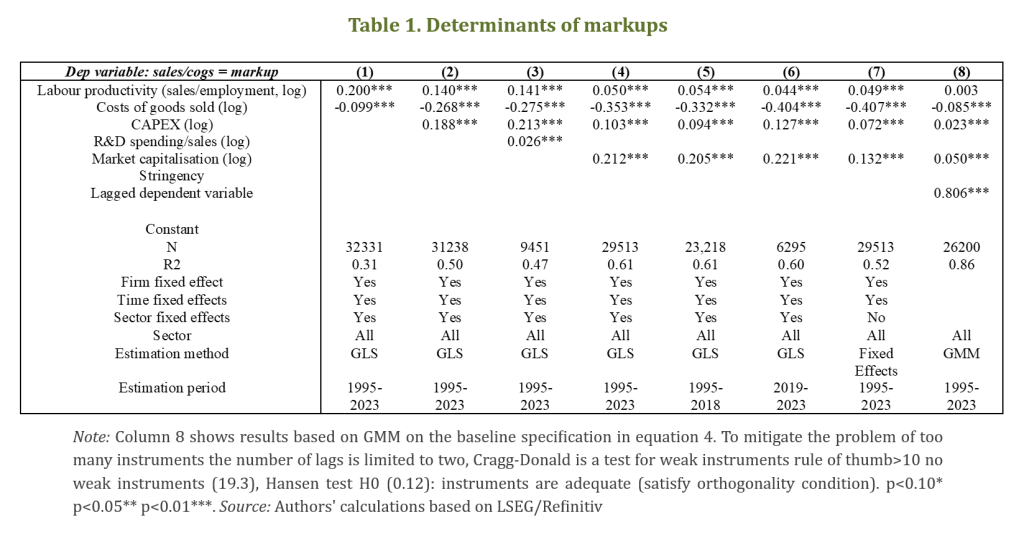
Drivers of markups: A panel regression analysis is used to investigate possible drivers of the markup estimated based on LSEG/Refinitiv firm-level dataset for listed companies in the euro area from 1995 to 2023 (Table 1).
Overall, our results support the idea that higher inflation does not point to weaker competition between 2020-2023 (the Covid and post-Covid period). Indeed, we find that markups increased less during the 2020-2023 period than during other (non-accelerating inflation) times. In competitive markets, the scope for mark-ups is limited, which means that cost increases are more quickly passed through into prices. By contrast, in less competitive markets, firms may have more “room to breathe,” as they can temporarily absorb cost fluctuations in their margins rather than immediately adjusting prices. This implies that the short-run relationship between competition and inflation crucially depends on the nature of the shock. An increase in input costs will typically result in higher inflation in more competitive environments, as firms cannot absorb cost inflation through lower margins (OECD, 2022). In addition, market power affects the absolute price level rather than the price changes. Thus, while competition policy influences prices over the longer run by regulating market power, it does not necessarily mitigate inflationary pressures in the short term, as these stem from cost shocks that competitive firms are likely to pass through to consumers. Still, in a high-cost inflation environment, consumers may have more understanding for a firm increasing its prices and are less likely to punish a firm by switching to a competitor if prices increase. Altogether, this suggests that, while increasing competition may reduce prices in the long-term, competition policy cannot be a prominent short-term anti-inflation tool.
This note contributes to a wider reflection on the lessons learned from the responses to the recent shocks. Consistent with previous findings, our results confirm (and provide further detail/underpinning) that the increase in firms’ markups has not been a (key) driver of inflation. We do not find compelling evidence that certain firms took advantage of the surprise inflation episode to exploit their competitive position and increase markups more than during other (non-accelerating inflation) times. By contrast, we find preliminary evidence that markups helped to cushion cost increases to some degree. With the progressive increase in nominal wages, unit profits are once more cushioning the increase in unit labour costs, allowing for an adjustment in real wages in 2023-24 without putting at risk the decline of inflation in the euro area towards its medium-term target (in the absence of significant progress in productivity). It follows that concerns about widespread price gouging during the recent inflationary period might have been overstated. Nevertheless, the analysis does identify a trend increase in markups, particularly among the firms with the largest markups, which may warrant further investigation.
Abraham, F., Bormans, Y., Konings, J., & Roeger, W. (2024). Price-Cost Margins, Fixed Costs and Excess Profits. The Economic Journal, 134(663), 2655–2684.
Acharya, V., Crosignani, M., Eisert, T., & Eufinger, C. (2023). How do supply shocks to inflation generalize? Evidence from the pandemic era in Europe. CEPR Discussion Paper No. 18530.
Archanskaia, L., Nikolov, P., Simons, W., & Vogel, L. (2024). Navigating shocks: The performance of the EU corporate sector from the pandemic to the energy crisis. European Economy Discussion Paper No. 216.
Bijnens, G., Duprez, C., & Jonckheere, J. (2023). Have greed and rapidly rising wages triggered a profit-wage-price spiral? Firm-level evidence for Belgium. National Bank of Belgium Economic Review, June 2023.
Bilyk, O., Grieder, T., & Khan, M. (2023). Markups and inflation during the COVID-19 pandemic. Bank of Canada Staff Analytical Note 2023-8.
Bond, S., Dietrich, D., & Martinez, C. (2021). [No title provided in the paper, please check the original document for more information].
Calligaris, S., Criscuolo, C., & Marcolin, L. (2024). Mark-ups in the digital era. CEP Discussion Paper No. 1994.
Colonna, F., Torrini, R., & Viviano, E. (2023). The profit share and firm mark-up: How to interpret them? Bank of Italy Occasional Paper No. 770.
Conlon, C., Miller, N. H., Otgon, T., & Yao, Y. (2023). Rising markups, rising prices? AEA Papers and Proceedings, 113, 279–283.
De Loecker, J., & Eeckhout, J. (2018). Global Market Power. NBER Working Paper No. 24768.
De Loecker, J., Eeckhout, J., & Unger, G. (2020). The rise of market power and the macroeconomic implications. Quarterly Journal of Economics, 135(2), 561–644.
Diez, F. J., Leigh, D., & Tambunlertchai, S. (2018). Global market power and its macroeconomic implications. IMF Working Paper No. 18/137.
European Commission. (2023). European economic forecast: Autumn 2024. European Economy Institutional Paper Series, No. 296.
European Commission. (2024). 2024 Euro Area Report. European Economy Institutional Paper Series, No. 259.
Faryaar, A. (2025). Estimating markups using firm-level data: A comparable analysis. Statistics Canada Analytical Studies Branch Research Paper Series No. 480.
Glover, A., Mustre-del-Rio, J., & von Ende-Becker, A. (2023). How much have record corporate profits contributed to recent inflation. Economic Review, 108(1), Federal Reserve Bank of Kansas City, 5–30.
International Monetary Fund. (2019). The rise of corporate market power and its macroeconomic effects. World Economic Outlook, April 2019.
Licchetta, M., & Mattozzi, G. (2025). Corporate Margins and Inflation During the Post-COVID-19 Period in the Euro Area. Quarterly Report on the Euro Area (QREA), 24(1), 41–54, June.
OECD. (2022). Competition and inflation. OECD Competition Policy Roundtable Background Note.
Palazzo, B. (2023). Corporate Profits in the Aftermath of COVID-19. FEDS Notes, Federal Reserve Board of Governors, September 8.
Traina, F. (2018). Is Aggregate Market Power Increasing? Production Trends Using Financial Statements. SSRN Electronic Journal
Weber, I. M., & Wasner, E. (2023). Sellers’ inflation, profits and conflict: Why can large firms hike prices in an emergency? Review of Keynesian Economics, 11(2), 183–213.
For example, ECB Executive Board Member Philip Lane pointed to extraordinary profits (see Interview with Philip R. Lane, conducted on Friday, 24 February 2023 by Reuters). In addition, ECB Executive Board Member Fabio Panetta raised the risk of a profit-price spiral (see Interview with Fabio Panetta, published as an article by Eshe Nelson entitled “Are Big Profits Keeping Prices High? Some Central Bankers Are Concerned.” in The New York Times, 31 March 2023), while ECB Executive Board Member Isabel Schnabel noted that part of the high inflationary pressure may indeed be due to greater market power of companies (see Central Bankers warn companies on fatter profit margin, Financial Times).
The data covers large publicly listed companies across euro area stock exchanges from 1995 to 2023. The database is constructed as an unbalanced panel, including 2728 firms, with annual observations varying from approximately 500 in the mid-1990s to around 2,450 in 2023. Large euro area economies dominate the sample, with firms from Germany, France, Italy, and Spain consistently representing about 60% of the total observations. At the sectoral level, the industrial, consumer discretionary, and financial sectors account for the largest share of firms in the dataset.
Among many, see (i) Palazzo, 2023; (ii) Conlon et Al., 2023; (iii) Weber and Wasner, 2023.
See for example (i) Colonna et Al., 2023; (ii) Bijnens and Jonckheere, 2023.
However, the short time horizon considered does not allow for a causal interpretation of price-cost dynamics, in the sense of pass-through from costs to prices.
In firms’ financial statements, “cost of goods sold” (COGS) generally includes expenses directly associated with production, such as materials and direct labour. In our markup estimation, we use COGS as a proxy for variable costs, following De Loecker et al. (2020). While COGS may also contain some elements that are not strictly variable, it provides a broadly comparable and readily available measure of firms’ input costs across sectors.
LSEG/Refinitiv data to estimate markups have two main benefits. First, they allow to estimate markups at the firm level and then calculate averages at different sectoral levels of aggregations. Second, they include a direct estimate of total variable costs (cost of goods sold), which is the basis for estimating markups.
Interestingly, the unweighted average (not shown in the chart) is well above the weighted average markup. This means that high markup firms tend to have smaller weights or smaller market share. The unweighted markup is based on a simple yearly average across the estimated firms level markups.
For example, some studies suggests that most firms with high pricing power prior to the COVID-19 pandemic (evidenced by higher markups in 2018) managed to sustain or even increase their markups in 2022. See (i) Acharya et Al., 2023; (ii) Calligaris et Al., (2024).
We matched the firm-level markup changes estimated with the price changes that arise in the firms’ industry codes obtained from Eurostat (See Table 3 in the Annex I). We rely on the TR4N code assigned to each firm by Refinitiv to match firms to the Purchase Price Index (PPI) by Eurostat. For most firms, a six-digit code is available. The PPI measures the average change over time in the prices of domestic producers and can be obtained for many Industries Classification European System codes. On a similar analysis for the United States, see Conlon et Al., 2023.