This policy brief summarizes the paper: Pulina, G. (2023), “Consumer debt in Luxembourg and the euro area: evidence from the Household Finance and Consumption Survey”, BCL working paper 175, Central Bank of Luxembourg. This policy brief should not be reported as representing the views of the BCL or the Eurosystem. The views expressed are those of the author and may not be shared by other research staff or policymakers in the BCL or the Eurosystem.
Cross-country differences in the level of consumer debt can be explained by differences in gross income. Within countries, the ratio of installment loans to gross income is highest in the bottom quintile and declines at higher income levels. In the euro area data, households with mortgages are more likely to take on consumer debt, a behavior which will affect financial vulnerability. The share of euro area households with outstanding credit card debt is rather small, but many households with credit card debt also hold significant liquid assets. This puzzling behavior may be explained by credit constraints and concerns about tightening access to credit.
The Great Financial Crisis focused attention of researchers and policymakers on household debt. While many studies concentrated on mortgage debt (e.g., Mian & Sufi, 2009, 2011), which accounts for most household liabilities, consumer debt has also attracted study (e.g., Magri et al. 2022). Consumer debt can help to identify financially vulnerable households, but can also shed light on potential risks to banks during economic downturns.
Using data from two waves of the Household Finance and Consumption Survey (HFCS), I examine the distribution of consumer debt and credit card ownership across demographic groups in Luxembourg, its neighboring countries (Belgium, France and Germany), and the euro area as a whole.1
Recent HFCS data identifies Luxembourg as one of the EU countries with substantial consumer debt among low-income households (see also Valderrama et al.,2023), indicating higher financial vulnerability and a heightened risk of mortgage loan defaults in this group (Giordana & Ziegelmeyer, 2023).
In 2018, approximately 43% of Luxembourg households with mortgages also carried consumer debt, compared to 37% in the euro area overall. In terms of volume, households with consumer debt hold around 41% of outstanding mortgage debt in Luxembourg and 37% in the euro area. In both Luxembourg and the euro area, roughly 80% of mortgage debt is associated with primary residences. Thus, it is natural for households struggling to manage both mortgage and consumer debt to prioritize the former, potentially leading to default on consumer loans.
In Luxembourg, consumer debt, held by 35% of households, is more common than mortgage debt (held by 31% of households). Across all households, more than 13% hold both mortgage and consumer debt. The main component of consumer debt is installment loans, held by 26% of households in Luxembourg and 20% in the euro area as a whole. In terms of volume, these loans made up 84% of household non-mortgage debt in Luxembourg during 2018, with similar shares in neighboring countries and the euro area.
From 2014 to 2018, there was little change in Luxembourg in both the share of households with installment loans and the median loan amount, which declined slightly to around €13,600. Similar trends were observed in Luxembourg’s neighboring countries and the entire euro area.
The average level of installment loans is twice as high in Luxembourg as in the euro area as a whole (Figure 1). Among the bottom 20% of households, the level in Luxembourg is even three times higher than in the euro area.
Figure 1: Outstanding installment loans, conditional median by country of residence
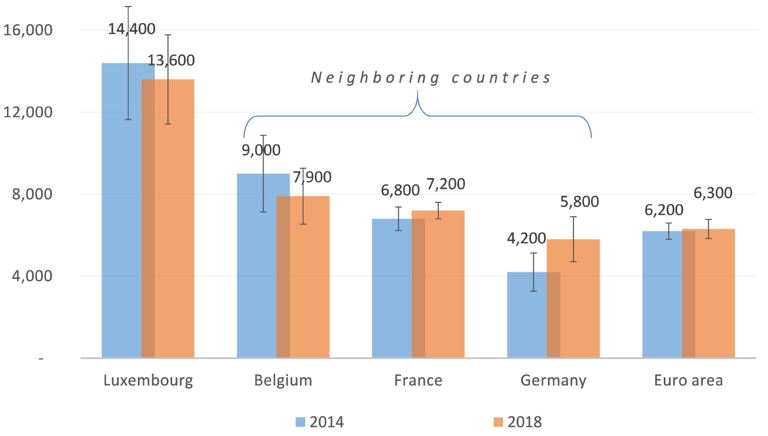
Source: Pulina (2023). Median in 2018 Euros (rounded to the nearest 100 euro). Calculations based on the 2nd and 3rd wave of the HFCS, data are multiply imputed and weighted. Error bars indicate the 95 percent confidence intervals based on 1,000 replicate weights.
Differences in consumer debt levels are partly due to differences in income, which is higher in Luxembourg. In addition, interest expenses related to installment loans are tax-deductible for many households in Luxembourg. According to HFCS data, the average ratio of installment loans to household gross income is approximately 16% in Luxembourg and in neighboring countries, and 17% in the euro area as a whole. Therefore, the average ratio in Luxembourg aligns closely with that in the euro area. Figure 2 shows that this is the case across all income quintiles. The ratio of installment loans to gross income is highest among those in the lowest income quintile and decreases at higher levels of income.
Figure 2: Ratio of installment loans to gross income, conditional median by gross income quintile, 2018 survey
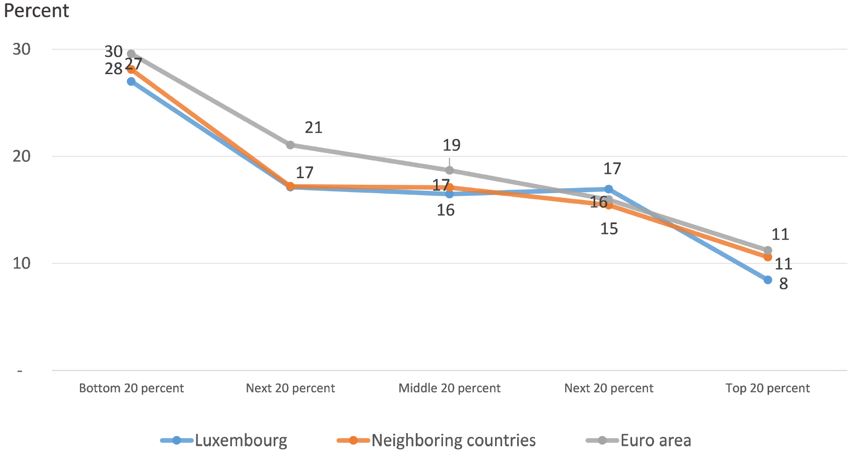
Source: Pulina (2023). Calculations based on the 3rd wave of the HFCS, data are multiply imputed and weighted.
The difference in the level of consumer debt may also reflect expected income growth (Permanent Income Hypothesis) or a desire to “keep up with the Joneses”. Most Luxembourg households with installment loans cite a vehicle purchase as the primary reason, accounting for 70% of such debt, nearly twice the share in neighboring countries and the euro area. This may explain higher loan amounts in Luxembourg.
Installment loans are generally larger among households with higher levels of education. However, in a regression controlling for different household characteristics, a higher level of education decreases the probability of holding an installment loan. Instead, a higher household income increases this probability. Presumably, household income is a signal used by lenders to decide (i) whether to grant credit to the household and (ii) how much credit to grant. Therefore, it is not surprising that the probability of holding an installment loan is higher among households whose reference person is an employee rather than self-employed or unemployed.
In Luxembourg and neighboring countries, housing tenure does not significantly affect the probability of holding installment loans. However, in the euro area as a whole, renting or owning with a mortgage make installment loans more likely. This raises concerns about the financial vulnerability of households with both consumer and mortgage debt, as they may be more likely to face difficulties in loan servicing.
A second component of consumer debt is accumulated credit card loans. In Luxembourg, nearly 84% of households own credit cards, which is almost twice the share in the euro area. However, only 5% of households use these cards to accumulate debt, both in Luxembourg and in the euro area as a whole (Figure 3).
Figure 3: Share of households with credit cards and credit card debt, 2018 survey (Percent of total population)
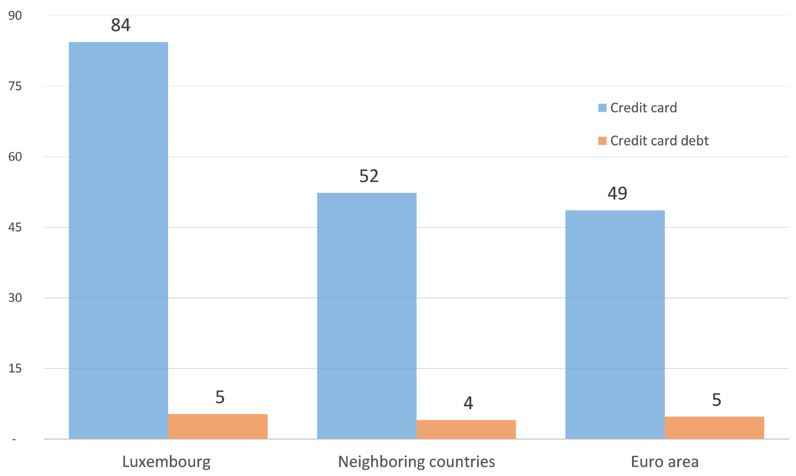
Source: Pulina (2023). Calculations based on the 2nd and 3rd wave of the HFCS, data are multiply imputed and weighted.
In general, the probability of owning a credit card is connected to household income and education levels. In Luxembourg, neighboring countries, and the euro area, approximately 7% of households consider themselves subject to credit constraints. This percentage diminishes among higher-income or older households. However, in all regions, households reporting credit constraints are more inclined to carry credit card debt.
Finally, according to HFCS data from 2018, over 90% of households who accumulated debt on their credit card had positive balances in their bank accounts. Over 70% of these households had enough money to repay their credit card debt. This behavior seems irrational when comparing the very high interest rates households pay on credit card debt to the low returns they earn on their deposit accounts. Empirical analysis suggests that this behavior can be explained by differences in risk aversion and concerns about future tightening of household access to credit (Pulina, 2024).
Chen, Yiwen, Mathä, Thomas Y., Pulina, Giuseppe, Schuster, Barbara, & Ziegelmeyer, Michael. 2020. The Luxembourg Household Finance Consumption Survey: Results from the third wave. BCL working papers 142. Central Bank of Luxembourg.
Giordana, Gaston, & Ziegelmeyer, Michael. 2023. Household indebtedness and their vulnerability to rising interest rates. BCL working papers 173. Central Bank of Luxembourg.
HFCN. 2020a. The Household Finance and Consumption Survey: Methodological report for the 2017 wave. ECB statistics paper series, March.
HFCN. 2020b. The Household Finance and Consumption Survey: Results from the 2017 wave. ECB statistics paper series, March.
Magri, Silvia, Michelangeli, Valentina, Pastorelli, Sabrina, & Pico, Raffaella. 2022. The Expansion of Consumer Credit in Italy and the Main Euro Area Countries. European Review, 30(3), 322{352.
Mian, Atif, & Sufi, Amir. 2009. The Consequences of Mortgage Credit Expansion: Evidence from the U.S. Mortgage Default Crisis. The Quarterly Journal of Economics, 124(4), 1449-1496.
Mian, Atif, & Sufi, Amir. 2011. House Prices, Home Equity-Based Borrowing, and the US Household Leverage Crisis. American Economic Review, 101(5), 2132-2156.
Pulina, Giuseppe. 2023, Consumer debt in Luxembourg and the euro area: evidence from the Household Finance and Consumption Survey. BCL working papers 175. Central Bank of Luxembourg.
Pulina, Giuseppe. 2024, Credit card debt puzzle: Evidence from the euro area. Economics Letters, 236, 111586.
Valderrama, Laura, Gorse, Patrik, Marinkov, Marina, & Topalova, Petia. 2023 (March). European Housing Markets at a Turning Point – Risks, Household and Bank Vulnerabilities, and Policy Options. IMF Working Paper Volume 2023: Issue 076. International Monetary Fund.
In the HFCS, not all countries had identical data collection periods (see HFCN, 2020b). For consistency, I will denote them as 2014 and 2018, aligning with Luxembourg’s data collection years (see Chen et al., 2020). To mitigate reference period discrepancies, all inter-wave and cross-country comparisons are adjusted for inflation using the Harmonized Index of Consumer Prices (HFCN, 2020a).