The views here expressed are those of the author and do not necessarily reflect those of Banca d’Italia. This policy brief is based on “The bank-based transmission of the 2024-25 monetary policy easing in the euro area”, Occasional Paper No. 964, Banca d’Italia.
Abstract
This policy brief assesses the transmission of the monetary policy easing that began in June 2024 to bank funding costs and lending rates in the euro area up to May 2025. The pass-through to funding costs was weaker compared with the 2008–09 easing cycle, largely due to a muted response of overnight deposit rates. In contrast, lending rates to firms declined more markedly, reflecting banks’ subdued risk perception. A Vector Error Correction Model suggests that a sharp increase in risk perception can weaken the transmission of a monetary policy easing. However, during the 2024–25 cycle, risk perception remained contained, supporting an effective pass-through from reference rates to lending rates.
Bank lending rates and credit volumes represent a key channel of the transmission of monetary policy decisions. We examine how the ECB’s easing cycle, started in June 2024, affected banks’ funding costs and lending rates in the euro area. Previous studies show that the pass-through of policy rate changes is typically incomplete (Gregor, Melecký and Melecký, 2021), heterogeneous across member states (e.g. Bernhofer and Van Treeck, 2013) and affected by credit risk and bank-specific factors (Gambacorta et al., 2015; Holton, Rodriguez d’Acri, 2018; Bottero and Conti, 2023). Our contribution consists in the assessment of the transmission during the 2024–25 easing cycle, combining descriptive evidence with an econometric analysis.
From the start of the ECB’s easing cycle in June 2024 to May 2025, banks’ marginal cost of funding (MCF) declined steadily, improving financing conditions for both non-financial corporations (NFCs) and for households (HHs). To assess the strength of the pass-through, we start by comparing this cycle with the 2008–09 episode.
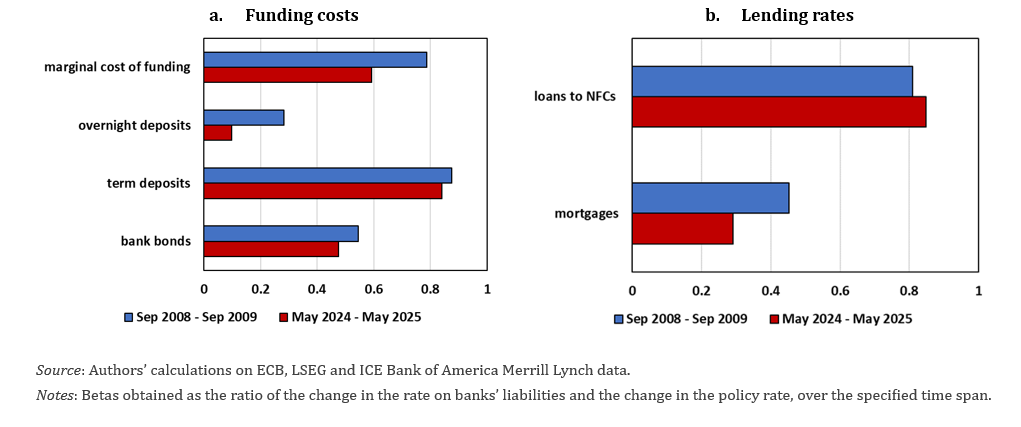
Overall, the pass-through to funding costs was weaker than in 2008–09. While the beta – the ratio of cumulative changes in banks’ funding costs to changes in €STR/Eonia1 – for term deposits was similar in both cycles, it was slightly weaker for bank bond yields, reflecting changes in benchmark rates and risk premia dynamics (Figure 1a). However, the main factor behind the lower MCF beta was the smaller response of overnight deposit rates, amplified by the increased weight of this funding source in banks’ liabilities.
In contrast, the pass-through to NFC lending rates was slightly stronger than in 2008–09 (Figure 1b). Betas were consistently larger – albeit moderately – in the 2024–25 easing cycle, reflecting a different macroeconomic and financial environment.2 For household mortgage rates, the beta in May 2025 was smaller than in the previous episode. However, it was slightly larger until February 2025, consistently with that on loans to NFCs; the subsequent rise in long-term benchmark rates from March 2025 exerted upward pressure on mortgage rates, reducing the beta.
Figure 1. Funding costs and lending rates beta, comparison between 2024–25 and 2008–09 easing cycles
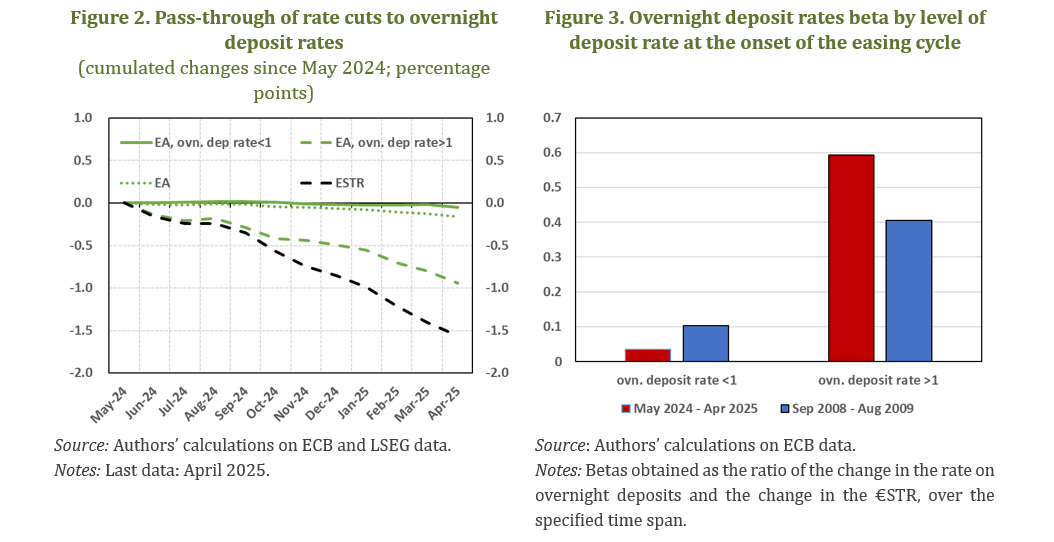
The weak pass-through to overnight deposit rates largely reflects their already very low level at the onset of the 2024 easing cycle, itself a result of the limited transmission during the 2022–23 tightening phase. This aggregate sluggishness is almost entirely driven by banks that, as of May 2024, remunerated overnight deposits at rates below 1 per cent (Figure 2). These institutions, which accounted for roughly 92 per cent of total overnight deposits, exhibited a beta close to zero. In contrast, banks offering rates above 1 per cent showed a significantly stronger pass-through.
This pattern is not specific to the 2024 cycle. A similar dynamic was observed during the 2008–09 easing episode (Figure 3), when banks with pre-cut deposit rates below 1 per cent also displayed lower betas. However, the context differed: average overnight deposit rates were higher overall, and banks offering less than 1 per cent accounted for just 26 per cent of total overnight deposits – compared to over 90 per cent in the current cycle.
To assess the strength of the pass-through to lending rates to NFCs and HHs in comparison with historical regularities, we estimate a two-variable linear Vector Error Correction Model (VECM). The model leverages the historical relationship between lending rates and their respective benchmark rates, in the absence of other factors affecting lending rates, such as banks’ risk perception or balance sheet constraints. The model is estimated using data up to May 2024, just before the first policy rate cut.3
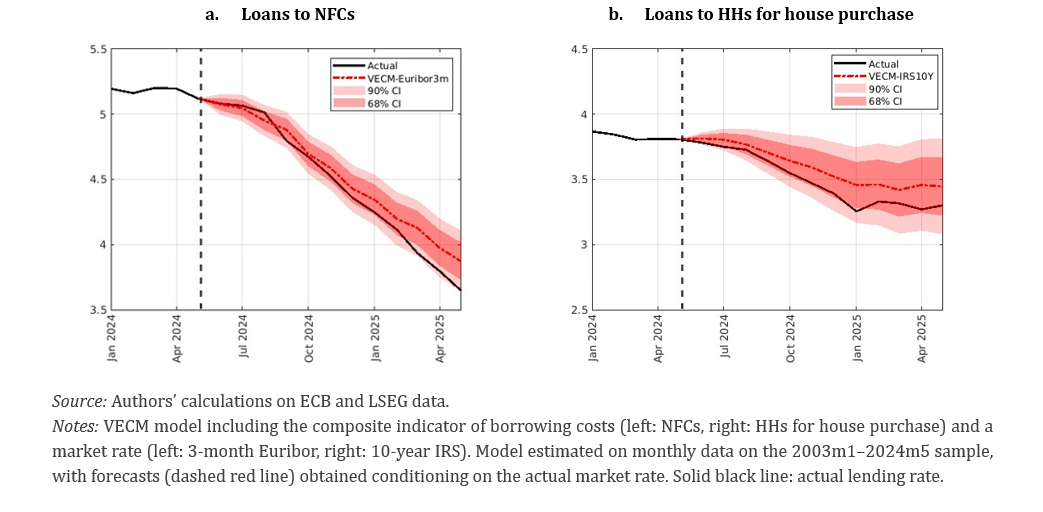
Since the start of the easing cycle, the actual NFC lending rate (Figure 4a, solid black line) closely tracked the model conditional forecast (dashed red line). It remained within the 68 per cent confidence bands through February 2025 and within the 90 per cent confidence interval thereafter. This suggests that the pass-through to NFC lending rates is broadly in line with historical regularities. The same holds for lending rates on households’ mortgages (Figure 4b). The actual path did not significantly deviate from the conditional forecast throughout the period, indicating a pass-throughbroadly consistent with historical averages also in this case.
Figure 4. Actual lending rates and conditional forecasts based on market rates (per cent)
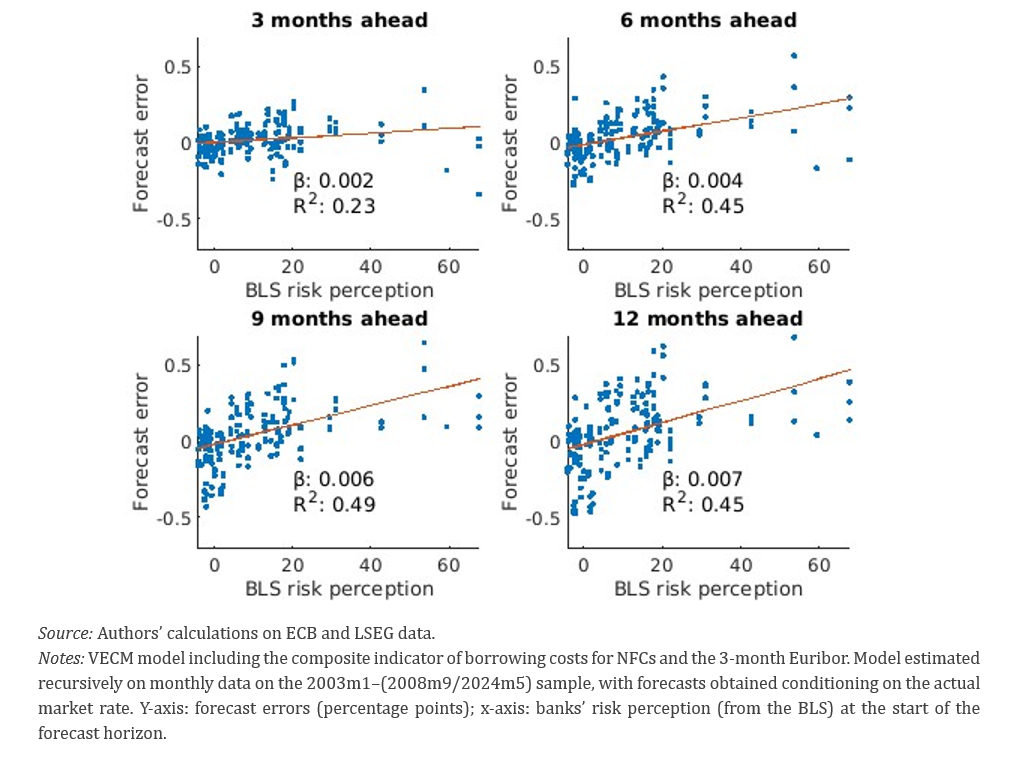
We also study how banks’ risk perception interacts with the pass-through of monetary policy to NFC lending rates. Figure 5 shows that the pseudo-out-of-sample forecast errors from the VECM tend to increase with banks’ risk perception, particularly at longer horizons.4 This suggests that the model performs well when banks’ risk perception is subdued but may underestimate lending rates during periods of heightened stress. In the 2024-25 easing cycle, risk perception and credit risk remained relatively contained. As a result, lending rate dynamics are well captured by the model, reinforcing the view of a broadly regular pass-through.
Figure 5. Forecast errors on NFC lending rates and BLS risk perception (y-axis: percentage points; x-axis: net percentage of banks)
In our work, we assess the pass-through of the 2024-25 ECB easing cycle to bank funding costs and lending rates in the euro area. Up to May 2025, the transmission to funding costs was weaker than during the 2008–09 cycle, largely due to a smaller adjustment of overnight deposit rates and the increased weight of this funding source in banks’ liabilities. In contrast, the pass-through to lending rates for non-financial corporations was slightly stronger, reflecting the relatively muted role of risk perception in the 2024-25 easing phase. Econometric evidence from a simple VECM confirms that the response of lending rates remained broadly in line with historical patterns. The subdued evolution of banks’ risk perception helped preserve the effectiveness of monetary policy transmission during the 2024–25 cycle.
Auer, S. and A.M. Conti (2024) “Bank Lending in an Unprecedented Monetary Tightening Cycle: Evidence from the Euro Area”, Banca d’Italia, Occasional Papers No. 856.
Bernhofer, D. and van Treeck, T. (2013) “New evidence of heterogeneous bank interest rate pass-through in the euro area”, Economic Modelling, 35, 418-429.
Beyer, R. C., Chen, M. R., Misch, F., Li, C., Ozturk, E. O. and Ratnovski, M. L. (2024) “Monetary policy pass-through to interest rates: Stylized facts from 30 European countries”, IMF Working Papers 2024/009, International Monetary Fund.
Bottero, M. and A.M. Conti (2023) “In the thick of it: an interim assessment of monetary policy transmission to credit conditions”, Banca d’Italia, Occasional Papers No. 810.
Conti A., Neri S. and A. Notarpietro (2024) “Credit strikes back: the macroeconomic impact of the 2022-23 ECB monetary tightening and the role of lending rates”, Banca d’Italia, Occasional Papers No. 884.
Gambacorta, L., Illes, A. and Lombardi, M. J. (2015) “Has the transmission of policy rates to lending rates changed in the wake of the global financial crisis?”, International Finance, 18(3), 263-280.
Gregor, J., Melecký, A. and Melecký, M. (2021) “Interest rate pass‐through: A meta‐analysis of the literature.”, Journal of Economic Surveys, 35(1), 141-191.
Holton, S. and Rodriguez d’Acri, C. (2018) “Interest rate pass-through since the euro area crisis”, Journal of Banking and Finance, 96, 277-291
Huennekes, F. and P. Köhler-Ulbrich (2022) “What information does the euro area bank lending survey provide on future loan developments?”, in ECB Economic Bulletin 8/2022.
The methodology for the descriptive comparison of the two easing cycles follows Beyer et al. (2024).
The contribution to changes in credit standards from risk perception reported by intermediaries participating in the BLS had a markedly different evolution during the two easing cycles. In 2024-25, the reduction in interest rates has been preceded by a steady moderation in the contribution from banks’ risk perception, whose increase had been previously driven by the energy shock and by the ECB policy tightening (Auer and Conti, 2024; Conti et al. 2024). In addition, the size of the increase in risk perception observed in the first quarters following the start of the easing cycle was quite limited. On the contrary, the 2008-2009 easing cycle was preceded by a sharp increase in banks’ risk perception related to tensions in the financial sector, which weakened the transmission of the monetary easing to lending rates.
Two separate models are estimated for interest rates on loans to NFCs and to HHs for house purchase. Both models include a lending rate and the respective benchmark rate (3-month Euribor for loans to NFCs and 10-year IRS for loans to HHs for house purchase).
The regression coefficient attains its maximum on the 12-month horizon, while the R2 is maximised at the 9-month horizon. This evidence is consistent with the presence of lags in the transmission of changes in banks’ credit standards and risk perception to lending rates and volumes (see for instance Huennekes and Köhler-Ulbrich, 2022; Bottero and Conti, 2023; Auer and Conti, 2024).