This policy brief is based on research by Heijmans and Van der Woerd (2025). Views expressed here are those of the authors and not necessarily those of De Nederlandsche Bank.
Abstract
This paper presents a methodology to detect potential failing banks in large value payment systems and measure the intraday impact of outages, considering Liquidity, Systemic, and Receiver Impacts. Medium and high risk thresholds are established to create a combined risk indicator. Outages of large banks can be detected within 10 minutes, while smaller banks may take over 30 minutes. Impact and risk levels vary by the size of the bank and the start time of the outage. Large banks can reach high-risk levels in 30 minutes, highlighting the need for timely detection, whereas smaller banks rarely reach high-risk levels.
Financial systems depend on the smooth functioning of Financial Market Infrastructure (FMI) networks. One critical type of FMI is a Large-Value Payment System (LVPS), a system used by banks to transfer large sums, in central bank money, typically in real-time and with immediate finality. TARGET2, operated by the Eurosystem, is an example of such an LVPS. TARGET2 processes around EUR 2000 billion per day (roughly the weekly GDP of the euro area). About a thousand banks participate, but a small number of large banks account for a large share of the volume.
When one major bank in such a system fails to send payments, for example, due to an operational outage or cyberattack, it can become a “liquidity black hole”. In such cases, the liquidity that other banks were expecting from the affected institution remains trapped, preventing them from fulfilling their own payment obligations. This can trigger a chain reaction and potentially disrupt the broader financial system.
International standards, such as the Principles for Financial Market Infrastructures (PFMIs), emphasize the importance of closely monitoring participants and responding swiftly to disruptions CPSS-IOSCO (2012). However, in practice, large banks in LVPSs are typically required to report an outage only after a certain threshold, such as 30 min- utes in the case of TARGET2. Unfortunately, if a critical bank halts payments, waiting this long can be too late. By then, billions of euros in expected outgoing payments can be trapped in the failing bank, placing significant stress on the bank’s counterparties and increasing systemic risk.
This policy brief introduces a new early warning and impact assessment toolkit to ad- dress this problem. Our toolkit consists of three parts:
The goal is to help payment system operators act quickly and effectively, preventing a localized technical failure from snowballing into a system-wide crisis. As an example, we apply this toolkit to the 2022 TARGET2 data.1
The remainder of this note contains three parts. First, we describe the method and results. Second, we explain how the operator could use the early warning dashboard. Lastly, we conclude and provide policy recommendations.
Each bank tends to have a characteristic timing and frequency of sending payments. Some large banks send transactions every few minutes or even seconds, whereas smaller banks may exhibit longer intervals between payments. We use these characteristic payment patterns to detect outages near real-time. We define the Minimum Outage Time Interval (MOTI) for each bank as the longest period that it usually lasts without sending a payment during a given hour, using a methodology based on historical data. If a bank exceeds this interval without payments, it may indicate an operational problem.2 Identifying such deviations early can help reduce the impact of disruptions by enabling faster responses.
For example, if Bank A almost never goes more than 10 minutes without a payment around mid-morning, then 10 minutes is its MOTI threshold for that time. If Bank A does not initiate payments for a longer period of time, an automatic alert is triggered. By customizing the MOTI for every bank individually (and for different times of day), we can catch outages of active banks within minutes, while avoiding false alarms for less active banks.
We find that banks with the shortest MOTI, between 1 and 10 minutes, tend to be high volume banks that process a large number of payments each day. In contrast, banks with longer MOTIs tend to process fewer payments. In addition, we observe that the MOTI varies during the day for large banks. More specifically, MOTI tends to increase during the first two hours after the system is opened and during the last hour of the day. In contrast, banks with lower activity levels show a more consistent MOTI throughout the day.
Detecting an outage is only the first step. We also need to understand its impact on the system in (near)real-time. We introduce three metrics:
These metrics start at zero when the outage begins and grow throughout the duration of the outage. We combine them into a single Combined Risk Indicator (CRI) with a traffic light interpretation:
The CRI gives operators an immediate sense of severity. For example, if a large bank experiences an outage and after 20 minutes has missed payments worth, say, EUR 5 billion affecting 80 other banks (with a couple of those banks in trouble), the CRI would likely signal orange and trend toward red, indicating that urgent intervention may be needed.
We use these metrics to simulate the outages of different banks in TARGET2. We find the following results: Outages of major banks escalate quickly and affect many others. For a large bank (one that processes thousands of payments a day), even a short outage can withhold a large amount of liquidity and impact a wide network of counterparties. Our analysis shows that if one of the largest banks experiences an outage at the start of the day, within 30 minutes it could withhold several billion euros of payments (high LI) and leave more than a hundred other banks waiting for incoming liquidity (high SI). Some of these banks would soon find themselves missing a significant share of their liquidity, risking a domino effect (RI rising). In contrast, if a smaller bank (say one with a few hundred payments a day) has an outage, the impact builds much more slowly and often stays low.
Outages early in the day are far more dangerous than late-day outages. Timing makes a big difference. If a bank fails in the morning, it misses the whole day’s payments; if it fails late in the afternoon, most of its important payments are likely to be made earlier in the day. In our simulations, a large bank outage starting at 9:00 AM could breach high-risk levels by noon, while the same outage starting at 3:00 PM might only reach medium-risk by the end of the day (since fewer payments remain unsent).
The MOTI early-warning system buys valuable time. In almost every severe case that we examined, the bank’s MOTI alert would ring before the situation became critical. For example, a major bank might trigger an alert after 5–10 minutes of no payments. Without MOTI alert system, operators might only notice the outage after 30 minutes when a manual report arrives; by then, the liquidity shortfall and network effects could already be at dangerous levels. Early detection allows operators to initiate contingency plans or assist affected banks early, greatly increasing the chances of containing the problem.
A key innovation of our approach is to provide actionable information to operators and management through a visual dashboard. Once a MOTI-based outage alert is triggered for a bank, the dashboard can display the status of that bank in terms of the different metrics LI, SI and RI and the CRI level, in near real-time.
Figure 1 illustrates the concept. The dashboard for an affected bank would show, for example:
When the alarm is triggered the operator can see what the expected evolution is and when a medium or high risk will be triggered, and what the main underlying cause is, e.g., the euros not sent or the number of banks affected. This concrete information helps in deciding the next steps. First, an operator would call the bank in case an alert is raised to check whether there is an operational problem. Follow-up steps could be the issue of an alert to the market, providing emergency liquidity to certain banks, or extending operating hours to clear backlogs.
We suggest implementing our method in a large value payment system, as such a tool transforms system monitoring from reactive to proactive. Instead of waiting and guessing, operators have a clear early signal and a quantified view of stress, allowing timely intervention. It also creates a common language for the response to a crisis: for example, management could establish a rule that “if the CRI goes red, convene the crisis team immediately”.
Furthermore, capturing these metrics for each incident helps in after-action reviews and improvements. Operators can identify which banks repeatedly appear as highly impacted receivers, examine whether MOTI thresholds need adjustment, and refine risk thresholds as the system evolves.
Figure 1.
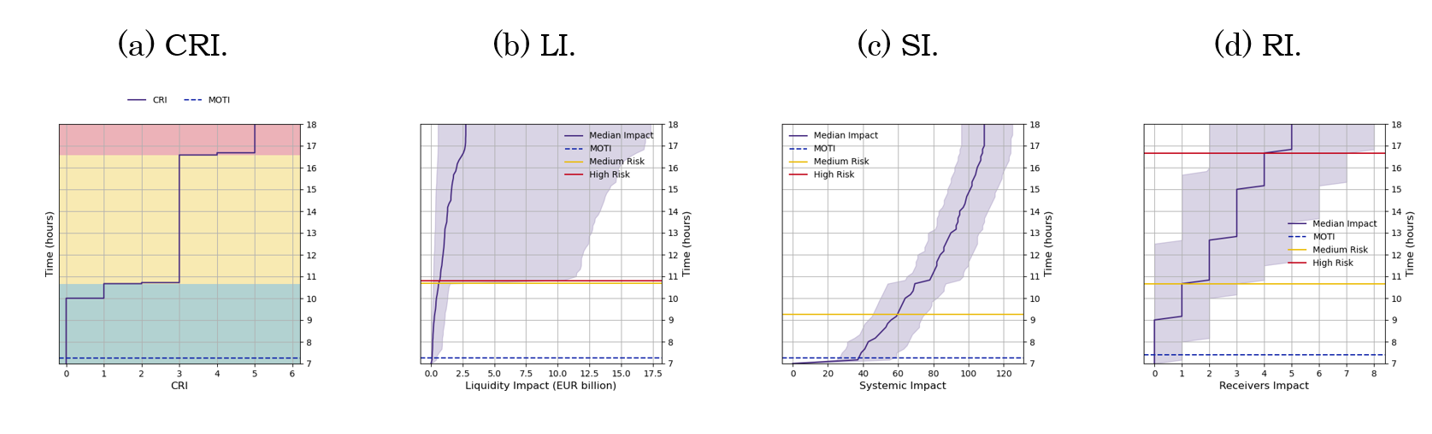
Schematic of the near real-time risk monitoring dashboard for an outage. As soon as a bank is detected to be inactive beyond its MOTI, the dashboard tracks the LI, SI and RI. The combined indicator (CRI) provides an overall risk level (green = low, orange = medium, red = high) to guide operators. In this illustrative example, the bank experiences an outages at 7:00 AM leading to a medium just before 1:00 PM, evolving into high risk at the end of the day.
Operational failures in payment systems are inevitable, but not their systemic consequence. The insights and tools of this study show that with the right monitoring, a potentially catastrophic liquidity black hole can be identified and mitigated in near real-time.
Policy makers, overseers, and system operators should consider the following actions:
By taking these steps, financial authorities can significantly reduce the chance that a single technical failure triggers a wider financial panic. In essence, we are equipping the “central plumbing” of finance with better sensors and circuit breakers. This strengthens trust in the system: even if one pipe causes a leak, we can quickly contain it before the whole network is flooded.
CPSS-IOSCO (2012). Principles for financial market infrastructures, bank of international settlements.
Heijmans, R. and Van der Woerd, E. (2025). A liquidity black hole: What is the impact of a failing participant in a large value payment system and does time matter? DNB Working Paper, 836.
However, this method can be used in any large value payment system that handle payments individually (gross). In addition, our method can also be used in future versions of TARGET2.
It is also possible in exceptional circumstances that a bank exceeds this limit for other reasons. Using historical data we can determine that this does not happen more than a couple of times a year.