The Basel Committee on Banking Supervision currently evaluates the Basel III reform package. A recent BCBS Working Paper finds that bank behavioral reactions to the package largely consist of measures that strengthen bank resilience, such as increases of capital and of high quality liquid assets (HQLA), the reduction of non-performing exposures and of non-core assets, the lengthening of funding tenors and the shift to more stable funding sources.
The Basel Committee on Banking Supervision (BCBS) recently published the results of a survey on the interaction of regulatory instruments.2 It summarizes and analyses the results of the third-wave survey conducted by the Research Task Force (RTF) on the role of multiple regulatory constraints in the Basel III framework. The study contributes to the BCBS evaluation of Basel III. Eight blocks of 28 questions test the impact of a regulatory instrument and provide an indication of the interaction among said instruments and the problems created by the growing complexity of the Basel III framework.
The survey results contribute to the better understanding of bank behavioral reactions to new regulatory constraints. The findings are highly relevant for regulators to understand the consequences of such constraints and their interactions with the overall financial system and the real economy. Furthermore, the findings provide valuable insights for researchers regarding the design of models of dynamic balance sheet optimization, regulatory impact assessments, and macro-financial feedback effects in macroprudential stress tests.
The sample consists of 128 banks, of which 86 have Tier 1 capital of more than €3 billion and are internationally active (so-called Group 1 banks) and 42 other banks (so-called Group 2 banks. The total assets of the banks in the sample amount to EUR 58,044 billion. The smallest bank has total assets of EUR 3 billion, the largest one of EUR 3,329 billion. The average Common Equity Tier 1 ratio is 15%, the average Leverage Ratio 6%, the average LCR and NSFR are 163% and 129%, respectively. The sample covers a broad spectrum of jurisdictions (44 European, 7 US, and 77 banks from the rest of the world).
3.1. Determinants of target management Tier 1 buffers
The most important determinants of target management Tier 1 buffers are financial market conditions. Regulatory constraints, risk appetite, return on equity (RoE) maximization, changes in the credit cycle and internal stress tests are also relevant. (The target management Tier 1 buffer is defined as the level of Tier 1 capital internally targeted by senior bank management above the Tier 1 capital requirement level and possible Pillar 2 capital add-ons under normal financial market conditions.) More than 75 per cent of the banks in the sample target Tier 1 management buffers of above 100 basis points. The size of the buffers vary widely across banks. There is no significant interaction between banks’ actual Tier 1 ratios and/or their RoE and the size of their Tier 1 surplus. My interpretation of these findings is, that the implementation of bank resolution frameworks reduces the implicit government guarantee on bank debt and increasingly exposes bank creditors to losses in the case of bank solvency problems (e.g. through bail-in measures). Thus, it is likely that the interaction between solvency and funding costs3 becomes more important for bank balance sheet optimization. The regulatory constraints will become less important in determining bank capitalization. For impact assessments, this implies that the common practice of approximating regulatory capital requirements by actual capitalization is inadequate.
3.2. “Unintended” consequences of bank regulation in fact endogenous reactions to internalization of negative externalities
A key question in the BCBS evaluation of Basel III focuses on their “intended” versus “unintended” consequences. The report uses the terms “intended” and “unintended” consequences, because they are frequently used in the policy debate about Basel III. In fact, the framework is agnostic with respect to the intended behavioral reactions of banks to the introduction of regulatory constraints. The Basel III reforms aim at internalizing negative external effects by shifting costs from the public back to banks. Ceteris paribus, this increases the production costs of bank loan for banks, which they (partly) pass-through to higher bank loan spreads. This leads to the substitution of bank loans by other sources of non-financial corporate debt, such as bonds, promissory notes, factoring, leasing, loans from non-financial corporates along the value chain and by internal funding or capital increases. Consequently, the potentially lower lending volume or growth is not an unintended consequence of Basel III, but an endogenous reaction to the intended internalization of negative external effects. Furthermore, high loan growth at the prices that do not cover the costs of capital, liquidity, idiosyncratic and systemic risk is not a policy objective. To the contrary, high loan growth is a very good leading indicator of banking crisis.4 Under some circumstances a reduction in loan growth can be intended (e.g. in the context of excessive credit growth or a real estate bubble).
3.3. Bank behavioral adjustments to the Leverage Ratio mostly intended
The survey asks how banks would reach a target LR requirement calibrated at 3%, with an additional G-SIB add-on. The report finds that banks would adjust to higher capital requirements largely by increasing capital (including retained earnings), reducing interbank lending, trading book, non-core assets and sovereign bonds. In sum, these behavioral reactions account for 63% of the total adjustment (Diagram 1). The reductions of lending to SMEs, other businesses and the public sector as well as reductions in residential real estate (RRE) and commercial real estate (CRE) lending account for 17%.
Diagram 1: Average contributions to reach a higher target management Leverage Ratio buffer in the case of an additional G-SIB add-on
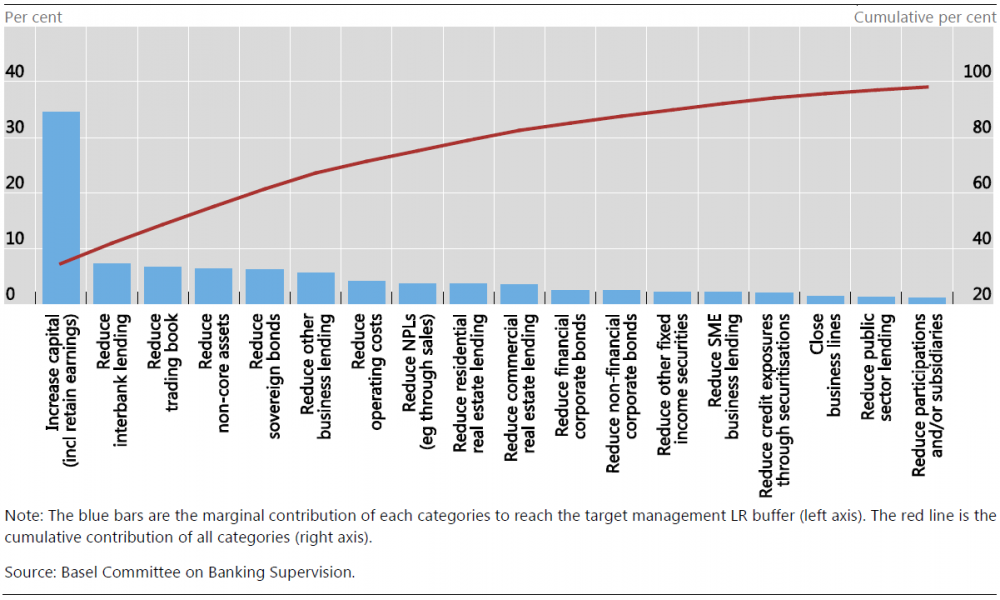
Banks with lower risk-density (risk-weighted assets/total assets) place more weight on the top 5 adjustments mentioned above (72% vs 57%) and less on unintended consequences (15% vs 22%). Banks with higher profitability in 2017 report higher contributions of capital increases (43% vs 26%). Across banks, the substantial variation across behavioral reactions indicates that there is little sign of herding. Therefore, it is unlikely that increasing capital requirements lead to a concerted reduction of bank loan supply and a substantial, negative feedback effect on economic growth.
Similar findings regarding the impact of stress test results on bank behavior corroborate these findings: the survey asks banks how they would reach a new target management Tier 1 capital buffer assuming that they needed to increase it following their stress test result. Again, the behavioral reactions of banks focus on capital increases (37%), reductions of non-core assets (7%), of operating costs (7%), of other business lending (6%) and of the trading book (4%) (Diagram 2). Most of these adjustments are intended reactions to stress tests, with the possible exception of other business lending. In sum, reductions of SME, public sector, RRE, CRE and other business lending account for 16% of the adjustment. In addition, the behavioral adjustments vary widely across banks and there is no indication of herding with significant negative repercussions for aggregate credit supply and economic growth.
Diagram 2: Average contributions to reach the target management Tier 1 capital buffer because of stress test results
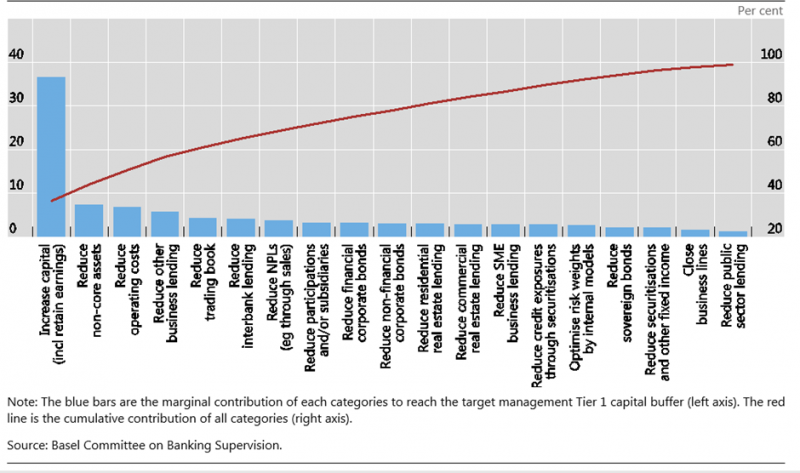
Again, banks with low risk-density feature higher values for the intended responses and lower ones for unintended consequences. Unsurprisingly, capital increases account for 10-percentage point more for banks with higher RoE compared to banks with lower RoE (above/below the median RoE in the sample). To my understanding, this is a further argument for the role of profitability in financial stability: banks that are more profitable can raise outside equity under stress more easily.
The stress tests with the greatest impact were internal capital stress tests for 58% of banks, bottom-up Pillar 2 stress tests for 22%, top down stress tests for 18% and other for 2%.
| Box 1: Results are in line with historic evidence with important implications for regulatory impact assessments and macroprudential stress tests These findings are in line with historic evidence regarding bank behavioral reactions to solvency shocks and have important implications for regulatory impact assessments and macro-financial feedback effects in macroprudential stress tests: |
For the Euro area (EA), Eidenberger at al. (2014) find that banks (Monetary Financial Institutions) react to solvency shocks predominantly by capital increases (incl. retained earnings) and reductions of interbank loans and external assets. They study the contributions of various behavioral reactions of banks to deleveraging after Lehman (October 2008). They define the leverage ratio as capital in per cent of total assets. Based on MFI data they find that EA banks increased their leverage ratio from 5.3 per cent immediately after Lehman collapsed to 8 per cent in February 2014. Capital increases accounted for 88% of the increase in the leverage ratio. The net reduction of total assets explained the remaining 12 per cent.
Diagram 3: Contributions of various categories of assets to the overall adjustment of MFI balance-sheet structure from 2003 to 2008 (blue bars) and 2008 to 2014 (red bars)
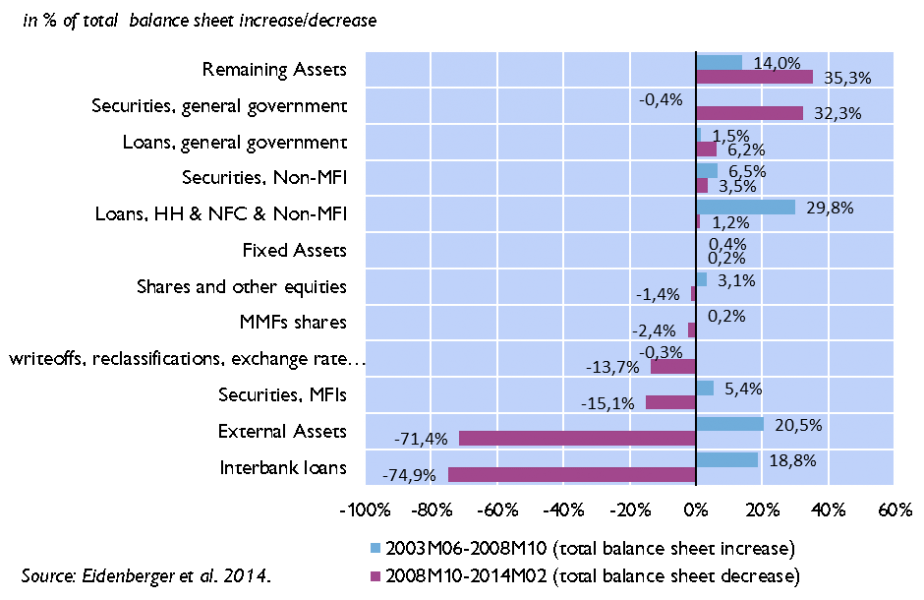
The net reduction of assets has been primarily driven by the reduction in interbank and external assets (Diagram 3). More precisely, the reductions of interbank assets amounted to -75 per cent, of external assets to-71 per cent, of MFI securities to -15 per cent and write-offs, reclassifications to -14 per cent. Remaining assets (+35 per cent), government securities (+32 per cent), and loans to government (+6 per cent) contributed to the expansion of total assets. The contribution of securities and loans to non-financial corporates was positive (+4 per cent and +1 per cent, respectively), but substantially lower than before the crisis.5
On the liability side, the largest contributions to the reduction stemmed from external liabilities and interbank deposits (-91 per cent each). Further reductions took place in debt securities issued (-29 per cent) and MMF deposits (-19 per cent) (Diagram 4). Deposits from non-MFIs and capital and reserves contributed to increases of liabilities (+78 per cent and +38 per cent, respectively).
Diagram 4: Contributions of various categories of liabilities to the overall adjustment of MFI balance-sheet structure from 2003 to 2008 (blue bars) and 2008 to 2014 (red bars)

To my understanding, the results have important implications for regulatory impact assessments and macro-financial feedback effects in macroprudential stress tests, which employ quantity-based models of bank behavioral reactions. These assume that only way banks react to solvency shocks is the reduction of lending.6 The models assume that the representative bank has two assets and two liabilities. The two assets are securities with 0 risk weight and loans to the “real” economy with positive risk weights. The liabilities are equity and deposits. All options to raise capital ratios except the reduction of loans are assumed away. Unsurprisingly, the only option that remains to increase capital ratios is the reduction of loans as the denominator of the capital ratio. The results above show that the quantity-based models are wrong and misleading; banks can raise capital and employ a broad range of behavioral reactions.
3.4. Banks confidence regarding their Tier 1 buffers and their capital allocation is high
Returning to the BCBS working paper, the report further finds that banks are quite confident regarding the sufficiency of their management Tier 1 buffers. It asks banks to indicate the probabilities at the reporting date of a target management LR shortfall, a target management Tier 1 capital shortfall and both a target management LR shortfall and a target management Tier 1 capital shortfall over the next quarter. More than 75% are very confident that they will not experience a target management Tier 1 capital or LR shortfall (ie they reported a 0% probability). Only four banks report a probability higher than 10% that they might have both a target management LR shortfall and a target management Tier 1 capital shortfall over the next quarter.
Similarly, banks show a high degree of confidence in their ability to allocate risk exposure efficiently across their various lines of business. Almost half of the responding banks are very confident about their ability to allocate efficiently risk exposures to their various lines of business. Few banks are minimally confident and only one Group 2 bank is not at all confident. Banks also report that they can adjust the allocation of risk exposure quite quickly. Two thirds of responding banks (67 banks of which 40 Group 1 banks) estimate that they can efficiently allocate risk exposures to their various lines of business within 6 months.
3.5. Bank behavioral reactions to the LCR and the NSFR largely intended
Bank behavioral adjustments to the LCR is largely in line with the intentions of regulators. Banks report the following marginal contributions to adjust to a potential shortfall of their target management LCR buffer (across all options the marginal contributions sum to 100 per cent): increase in HQLA (32 percentage points), “other options” (17 percentage points), increase in long-term issuances (15 percentage points), increase in retail deposits (11 percentage points) and decrease in short-term unstable funding (8 percentage points).7 These intended behavioral reactions (including most of the responses to “other options”) account for 82% of the total. The reduction of loans to households, to non-financial companies and to the public sector as well as the reduction in credit facilities to non-financial corporates together amount for only 7%. Banks’ behavioral reactions vary widely and there is no evidence of herding. Banks with a lower LCR (below the median of 142%) focus more on “other options”, on the decrease of short-term funding and less on the increase of HQLA than banks with a higher LCR. Banks with lower risk density report a higher share of intended and a lower share of unintended behavioral adjustments.
Equally, bank behavioral adjustment strategies to reaching the NSFR consist largely of intended measures and are similar to the LCR’s; however, increases in long-term issuances weigh 23 percentage points (compared to 15 percentage points for LCR) at the expense of increases in HQLA, which drop to 16 percentage points (32 percentage points for LCR). The remaining categories remain virtually unchanged. Again, banks use a broad range of adjustment strategies and there is no evidence of herding. Banks with a lower NSFR (below the median of 116%) place more weight on increasing long-term issuance (27 vs 20 percentage points for banks with high NSFRs). These banks place less weight on increasing of HQLA (11 vs 20 percentage points) as well as on the reduction of loans (to households, non-financial companies and the public sector) and credit facilities to non-financial corporates (6 vs 14 percentage points).
3.6. Uncertainty with respect to implementation and the complexity of regulation are the main regulatory challenges for banks
The questionnaire asks banks to rank the most challenging regulatory requirements of Basel III. About one third find the target Tier 1 ratio to be most challenging to meet, for 11% it is the LR, for 6% the LCR, for 15% the NSFR and for 12% TLAC. Regarding the nature of challenge, among the top three challenges are uncertainty with respect to implementation and/or changes to regulation as well as the complexity of the regulatory framework.8
3.7. Interaction between regulatory constraints limited
Finally, the report devotes ample room to study the interaction between regulatory constraints. It does so by splitting the samples into sub-samples. The authors consider the following non- overlapping subsamples: CET1 ratio ⋚ 12% and LR ⋚ 5.9%, LCR ⋚ 141.8% and NSFR ⋚ 116.3%.9 They then check for the statistical significance of sample-specific differences regarding bank behavioral responses to the various regulatory requirements. Overall, the interactions between regulatory constraints are small, few of them are statistically significant (18%) and even fewer affect the economically relevant top 5 contributions to banks’ behavioral adjustments (5%). In the case of significant interactions, banks with lower regulatory ratios are more like to feature intended behavioral reactions (such as increases of capital or HQLA) and less unintended reactions (such as reduction of lending).
The report finds that banks react to Basel III reforms mostly in the intended manner: they increase capital and liquid assets, reduce non-performing and non-core assets, lengthen funding tenors and shift to more stable funding sources. These reactions strengthen bank balance sheets and contribute to the stability of the financial system. It also shows that unintended consequences, such as the reduction of lending to non-financial corporates and households play a minor role. The Basel III reforms aim at internalizing negative external effects by shifting costs from the public back to banks. Consequently, the potentially lower lending volume or growth is not an unintended consequence of Basel III, but an endogenous reaction to the intended internalization of negative external effects. Historic evidence corroborates the findings of the report. The results show that quantity-based models of bank behavioral reactions are wrong and misleading: they assume that banks can only reduce the supply of loans to the real economy to adjust to new regulation. In fact, many banks raise capital and employ a broad range of behavioral reactions. There is no evidence of herding. Therefore, quantity-based impact assessments and macroprudential stress tests significantly and systematically overestimate the costs of regulation.
The author is a co-author of the WP presented in this note; the opinions expressed in the latter do not necessarily reflect those of the Research Task Force of the Basel Committee on Banking Supervision or of the OeNB.
Basel Committee on Banking Supervision (2019), Survey on the interaction of regulatory instruments: results and analysis , Working Paper 35.
Schmitz, S. W., M. Sigmund, L. Valderrama (2019), The Interaction Between Bank Solvency and Funding Costs: A Crucial Effect in Stress Tests. Economic Notes Vol. 48/No. 2. e12130.
BCBS (2019), The costs and benefits of bank capital – a review of the literature, Working Paper 37. Table 1 in Box A (p. 10) shows that high loan growth has an economically and statistically highly significant positive effect in the probability of a banking crisis.
The contributions of the various behavioral reactions add-up to -100%, the net decrease of total assets.
Dees, S., J. Henry and R. Martin (eds.) (2017), *STAMP€: Stress-Test Analytics for Macroprudential Purposes in the euro area, Frankfurt. Christiano, L. (2018), Financial Frictions in Macroeconomics, presentation at the IMF, August 2018, Washington D.C. Kitamura, T., S. Kojima, K. Nakamura, K. Takahashi, I. Takei (2014), Macro Stress Testing at the Bank of Japan. ECB (2019), Macroprudential stress tests of the euro area banking system, ECB Occasional Paper No. 226.
All banks in the sample have a liquidity surplus at the consolidated level relative to their target management LCR/NSFR buffers and relative to the regulatory minima.
The complexity of regulation has attracted increasing attention among supervisors. The OeNB organized a high level conference on the topic in May 2019, summarized in Ittner, A., M. Posch, S. W. Schmitz (2019), The future of financial stability: Maintaining effectiveness while reducing complexity . SUERF Policy Note, Issue No. 75 (June). Posch, M., S. W. Schmitz, P. Strobl (2018), “Strengthening the euro area by addressing flawed incentives in the financial system” , Monetary Policy and the Economy Q2/18, 34-50. Gai, P., M. Kemp, A. Sanchez Serrano, I. Schnabel (2019), “Regulatory complexity and the quest for robust regulation ”, Reports of the Advisory Scientific Committee of the European Systemic Risk Board No. 8 (June).
The thresholds were chosen to allow subsample sizes to be sufficiently large and to be near current or prospective regulatory thresholds for the CET1 ratio.18 The thresholds for the LR, the LCR and the NSFR were set equal to the median values in the sample because, as of December 2017, almost all banks exceeded the regulatory minimum (set at 100% regardless of phase-in period).