menu
close

Author(s):

Andrew Bailey | Bank of England

Keywords:

monetary policy , aggregate supply , equilibrium rate of interest , labour market participation

JEL Codes:

E20 , E31 , E32 , E52

This is an edited transcript of the speech delivered by Andrew Bailey at the London School of Economics on 27 March 2023. The author is grateful to Ben Broadbent, Fabrizio Cadamagnani, Kieran Dent, Izzy Doughty, Marco Garofalo, Michael Goldby, Richard Harrison, Karen Jude, Tomas Key, Catherine L Mann, Katie Martin, Huw Pill, Dave Ramsden, Andrea Rosen, Martin Seneca, Bradley Speigner, Danny Walker and Laura Wallis for helpful comments and assistance, and to ChatGPT for its views on R*.

Monetary policy works through aggregate demand, but it is the balance between demand and supply that determines inflationary pressures. The supply side has played a more important and unusual role in recent macroeconomic developments as a series of significant economic events have deeply affected the UK economy. A rise in economic inactivity has reduced the productive capacity of the economy since the start of the Covid pandemic. This is a particularly clear example of how difficult it can be in practice to judge the relative impact of supply and demand. Over the autumn and winter of 2021-22, contrary to initial expectations, policymakers were not faced with a looser labour market and an increase in unemployment as the UK furlough scheme ended. Rather, it was a tighter labour market and a decline in labour market participation. 

Introduction

The past few years have been a time of macroeconomic upheaval. A series of significant economic events have deeply affected the UK economy. This includes the change in our trading relationship with the European Union, the Covid pandemic with shutdowns of some sectors of the economy and supply chain bottlenecks in others, and the rise in energy prices caused by Russia’s brutal war on Ukraine and its people. These shocks have affected the UK economy in different ways. But they have all eroded the terms on which we trade with the outside world. This has made us poorer as a country; manifesting itself in a rise in the prices we have to pay for the things we buy as consumers. UK Consumer price inflation is currently at 10.4%. This is much too high, and we need to, and will, bring it back down to the 2% target. That is why last Thursday the Monetary Policy Committee increased Bank Rate at the eleventh meeting in a row, to 4.25%. We have increased Bank Rate by more than 4 percentage points since December 2021. These increases are being felt by households and businesses across the country.
Monetary policy cannot make the shocks to our national real income go away. But what monetary policy can – and must – do is to make sure that the inflation that has come to us from abroad does not become lasting inflation generated at home.
Our most important tool to bring inflation down is Bank Rate. This is the interest paid on reserves held by commercial banks at the Bank of England. Because commercial banks are at the centre of a system of intricately linked financial markets, Bank Rate affects interest rates and yields more widely. And because those interest rates and yields determine the returns on savings and the cost of credit – including the rates people pay on their mortgages, and the rates businesses pay on loans to finance their investments – monetary policy exerts a powerful influence on spending by households and businesses.
Monetary policy, in other words, works through the management of aggregate demand in the economy. Simply put, when inflation is too high, we increase Bank Rate to dampen demand; when inflation is too low, we reduce Bank Rate to boost demand.
In reality, things are of course more complicated. For a start, monetary policy operates with a lag. It takes time for changes in Bank Rate to work through the financial system to loan and mortgages rates, and for those changes to affect consumption and investment decisions by households and businesses. It then takes time for changes in those spending choices to affect prices in the shops. This means that the Monetary Policy Committee needs to look ahead and focus on the outlook for inflation, as much as on its current level, when deciding the appropriate level of Bank Rate today. When we look at the outlook for inflation today, we have to recognise that the full effect of the higher level of Bank Rate is still to work its way through financial markets and the real economy.
There is another complication. What actually happens in the economy – to economic activity and inflation – will be determined by aggregate demand and supply. Economic life plays out at the intersection between them, in an economic equilibrium. While it is sometimes useful to focus on one of the two, taking the other as given, we always have to bear in mind that market economies work through the forces of both demand and supply.
For monetary policy, the natural starting point is the demand side. Monetary policy exerts a powerful influence on the components of aggregate demand – on consumption and investment – but it can do little to affect the supply side – the production technologies and know-how used to make goods and services available for use in the economy. But ultimately, it is the balance between demand and supply that determines inflationary pressures in the economy. And sometimes shifts in supply can be as abrupt and as important for the inflation outlook as shifts in demand.
We have seen this very clearly in the past three years since Covid hit. Throughout this time, the Bank’s Monetary Policy Committee has had to play close attention to the supply side of the economy – and make a number of critical judgements about it – for instance, as care for the public’s health necessitated a pause in a range of economic activities.

Supply, R* and monetary policy

Monetary policy’s inability to influence supply has at times been taken to suggest that monetary policy has no effects on real economic activity at all. In classical economic theory, for example, monetary policy only affects nominal variables such as wages and prices, not real variables such as the level of production and employment.  In this tradition, real business cycle theories have been developed in which supply side disturbances are the main drivers of real activity.

But overwhelming empirical evidence, and many years of practical experience, show that monetary policy affects economic activity and inflation through aggregate demand. In the New Keynesian models that have dominated monetary macroeconomics over the past three decades, monetary policy has real effects because market prices are sticky. So when nominal interest rates change, the real interest rates that determine real consumption and investment decisions change with them. And markets may operate with ‘excess supply’ or ‘excess demand’ for as long as it takes wages and prices to adjust to shifts in either demand or supply.
Rather, it is over longer stretches of time that monetary policy is indeed ‘neutral’, and that we can think of the level of economic activity as being driven entirely by supply. By facilitating low and stable inflation, monetary policy helps create conditions conducive to economic growth. But other forces will ultimately determine the growth path of the economy. Economic growth – and with it the prospects for our real national income – will be determined by technological progress, investment and innovation, and by skills and trends in the population.
Equally, both the structure of the economy and the distribution of real national income are beyond the realm of monetary policy. Yes, monetary policy affects asset prices and unemployment over the near term. And yes, excess demand or supply may give rise to sectoral imbalances. But over the longer term, these features of our national economy will be driven by real factors and by structural policies rather than monetary policy.
Over time, even the level of interest rates is determined by such structural factors. While monetary policy steers market interest rates here and now, we do not set Bank Rate in a vacuum. The level of interest rates is anchored in an underlying equilibrium rate of interest determined by economic fundamentals on both the supply and demand side of the economy. This equilibrium rate of interest is the hypothetical interest rate that would sustain demand in line with supply, and inflation at target. We call it r*.
The equilibrium interest rate is a theoretical concept we can use to organise our thoughts. A useful framework for understanding it was set out by the Monetary Policy Committee back in August 2018. At the core of it is a distinction between the actual level of the equilibrium rate, r*, which moves around with cyclical factors acting on the economy, and its longer-run trend component, R*, which moves more slowly with underlying structural factors in the economy. The equilibrium rate, r*, in other words, fluctuates around its long-run trend, R*, as a result of shorter-run influences on the economy.
Neither r* itself not its trend component R* can be directly observed, and we cannot use them as a direct guides.  But to the extent that they can be estimated, they may help us explain the evolution of interest rates over the past and inform our assessment of where interest will go in the future.
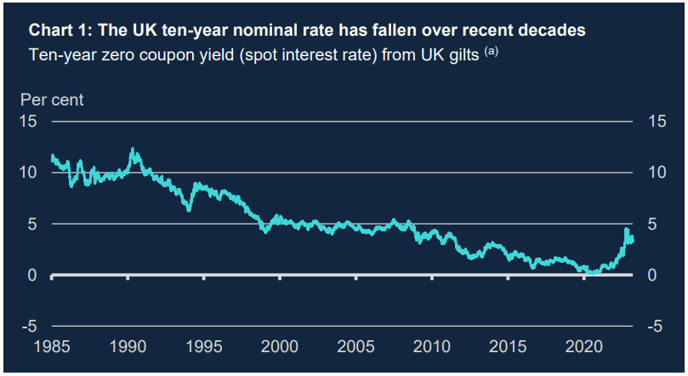
One of the most striking global trends over the past half century has been an overall decline in the level of risk-free interest rates – risk-free in the sense that they are returns on lending that carries a negligible risk that payment obligations will not be met by the borrower. Chart 1 shows how, when we look at this over a longer period of time, ten-year UK nominal rates have fallen compared to where they were in the 1980s. Both the very low levels of interest rates we have seen in the years leading up to the Covid pandemic, and their recent rise from those levels, must be seen against the backdrop of that downward trend.
 width=
(a) Sources: Bloomberg Finance L.P, Tradeweb and Bank calculations.
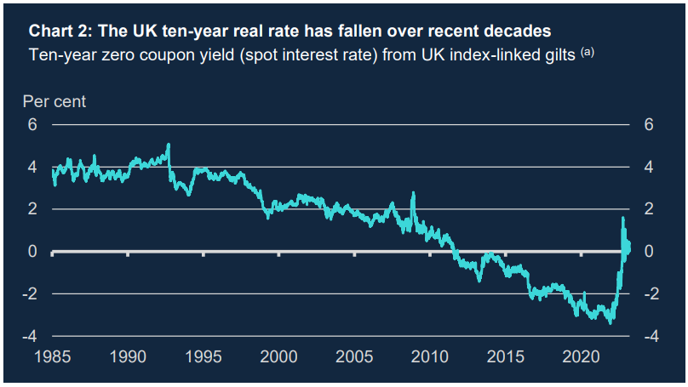
But it is not just nominal interest rates that have fallen. If we adjust nominal interest rates for inflation and look at real interest rates, we can see that they have fallen too. Chart 2 shows the UK ten-year real interest rate, measured directly from index-linked bond prices. It is clear that the real interest rate is quite responsive to cyclical events, and that it has risen sharply over the past year. But beneath the volatility, there appears to have been a fairly steady downward trend from the 1990s at least up until the onset of the Covid pandemic.
 width=
(a) Sources: Bloomberg Finance L.P, Tradeweb and Bank calculations. 
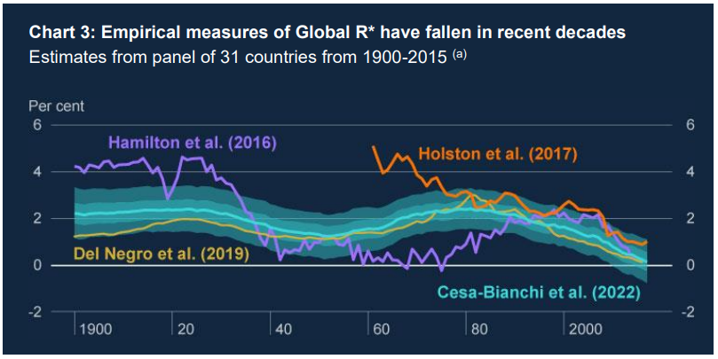
Much has been said about this trend in risk-free interest rates. Chart 3, replicated from a speech I gave last year, shows estimates of the global trend component of the equilibrium real interest rate by Bank staff (in blue) along with other estimates from academic papers. We call this trend component Global R*. There are wide error bands around the central estimate, but the direction of travel has been clear. Global R* has fallen markedly over recent decades.
 width=
(a) Source: ‘The economic landscape: structural change, global R* and the missing-investment puzzle – speech by Andrew Bailey’ (with references to academic papers); and ‘Structural change, global R* and the missing-investment puzzle’, Bank of England Staff Working Paper No. 997 (2022) by Andrew Bailey, Ambrogio Cesa-Bianchi, Marco Garofalo, Richard Harrison, Nick McLaren, Sophie Piton and Rana Sajedi. 
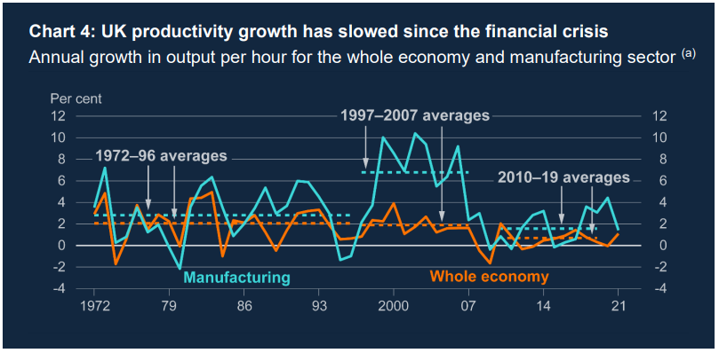
As we look deeper into the causes of this, two supply factors stand out: a slowdown in productivity growth and population ageing across advanced economies. While this is a global story, let me focus on the United Kingdom.
Chart 4, reproduced from our latest Monetary Policy Report, shows that there has been a marked and sustained fall in productivity growth in the United Kingdom following the global financial crisis in particular. Looking closer at individual sectors reveals that productivity was significantly boosted by very high growth in manufacturing sector productivity in the decade before the financial crisis, much faster than in the preceding 25 years. This is the period sometimes referred to as the ‘Great Moderation’, a period characterised by unusually low volatility in both economic activity and inflation. But following the financial crisis, manufacturing productivity growth fell back sharply. This fall in manufacturing productivity is the main cause of the slowdown.
 width=
(a) Sources: ONS and Bank calculations.
Whatever the reason, when productivity growth is weak, companies gain less from installing new capital. So weaker productivity growth has meant that firms have sought to borrow less to finance investments at a given interest rate. This reduction in the demand for capital has lowered the equilibrium rate.
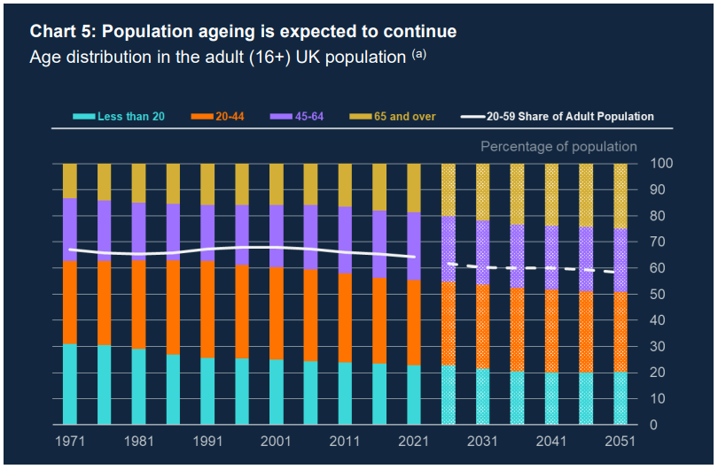
The second important factor is population ageing. Chart 5 shows the age distribution for the United Kingdom.  The share of the adult population aged 20-59 has fallen below 65% in the past decade, and it is set to decline further in the coming years. This population ageing has been driven by a decline in birth rates relative to the high levels seen in the years that followed the Second World War – as well as by the happier news that people now live for longer. As people accumulate savings over their working life to fund their retirement, wealth in the economy increases as the age distribution shifts towards older cohorts (indicated in this chart by bars in different colours).
So ageing households have sought to lend more at a time when less productive firms have sought to borrow less.  The only way to establish an equilibrium between the supply and demand in the market for investable funds – that is, to incentivise firms to invest this additional wealth into productive capital – has been for the price of those funds, the real interest rate, to fall.
 width=
(a) Dashed line and hashed bars are calculated using the ONS 2020-based interim national population projections: year ending June 2022 estimated international migration variant. Sources: ONS and Bank calculations. 
The trend equilibrium rate, R*, is like a long-term anchor for monetary policy. As R* has fallen, monetary policy has moved with it. This is an important point. The low level of interest rates over the past few decades reflects deep underlying factors on the supply side of the economy. As these underlying factors – trends in technology and demographics – only move slowly, it is not unreasonable to expect that R* will remain low. This means that, even as we now respond to rising inflation by raising Bank Rate, interest rates will not necessarily have to return fully to, and remain around, the higher levels they once had.
But let me add a caveat:
“It’s important to note that forecasting the future path of R* is challenging and subject to a significant degree of uncertainty. Economic developments and policy decisions can have unpredictable and complex effects on the economy, and it is difficult to predict their outcomes with complete accuracy.”
This was not said or written by an economist of the human sort. This is a caveat added by ChatGPT. The ‘artificial intelligence’ underlying it reminds us that technology sometimes progresses in leaps, which can lead to a sudden emergence of productive investment opportunities across the global economy. New rounds of technological revolution are amongst the factors that could shift up Global R*. Monetary policy would have to move with it.
So even if monetary policy is neutral in the long run, long-run supply does affect monetary policy by anchoring the level for interest rates. Over the short term, moreover, the actual equilibrium interest rate, r*, will fluctuate around the trend level, R*, driven by shorter-term influences from both demand and supply. This is what matters for monetary policy here and now. Why? Because r* is the rate at which demand is in line with supply so that there is no output gap – neither excess demand nor excess supply in the economy. Responding to shifts in r* is what helps keep inflation close to target.
This does not mean that monetary policy should always align Bank Rate exactly to r*. Sometimes, monetary policy faces trade-offs between inflation and the balance of supply and demand. But it does mean that supply matters for monetary policy also in the short run. By determining the level of demand the economy can sustain without generating excess inflationary pressures, it affects the appropriate level of interest rates, effectively by setting the speed limit for the economy. And when shocks drive inflation away from target in the way we have seen, monetary policy responds by steering demand to a level – relative to supply – that ensures that inflation returns to target sustainably. Monetary policy cannot affect this level of supply. But the level of supply will affect the appropriate setting of monetary policy. It matters, therefore, that big shocks to the economy have weighed heavily on supply in recent times.
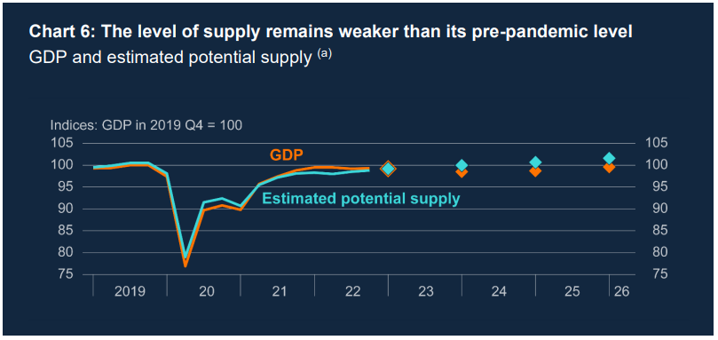
Chart 6, taken from the February Monetary Policy Report, shows that the Monetary Policy Committee’s estimated level of potential supply has not yet regained its pre-pandemic level. It illustrates that the Committee based its most recent forecast of the economy on the key judgement that the level would only recover very gradually. On our latest estimates, the growth rate of the potential of the UK economy – the supply side – is probably now around 1% per annum. This compares to a typical growth rate in the decade leading up to the financial crisis of nearly 2¾%.
 width=
(a) Diamonds are projections for 2023 Q1, 2024 Q1, 2025 Q1 and 2026 Q1. Diamonds for GDP show MPC projections. GDP in 2022 Q4 is a Bank staff projection incorporating official data to November 2022. Data include the backcast for GDP. Estimated potential supply is derived using the MPC’s projection for the level of GDP and the level of excess demand/supply. Both GDP and estimated potential supply are indexed to GDP in 2019 Q4. Source: ONS and Bank Calculations.
To understand these movements in supply, we can dive into its constituent parts. Supply depends on the amount of both labour and capital in the economy. Most simply, it can be thought of as the amount of labour available in the economy and the productivity of that labour in producing goods and services. There is a lot to be said about both. But let me focus on one of the most noticeable aspects of labour supply.
As Covid hit, labour supply growth came to an abrupt halt. The size of the workforce – that is, the share of the population taking active part in the labour market – declined by 132,000 people, or 0.4%, from the three months to December 2019 to the three months to January this year. That stands in stark contrast to a steady growth rate of around ¾% per year during the preceding decades. These may sound like small numbers, but even small changes in these small percentages of the whole workforce of nearly 33 million add up to a lot of people.
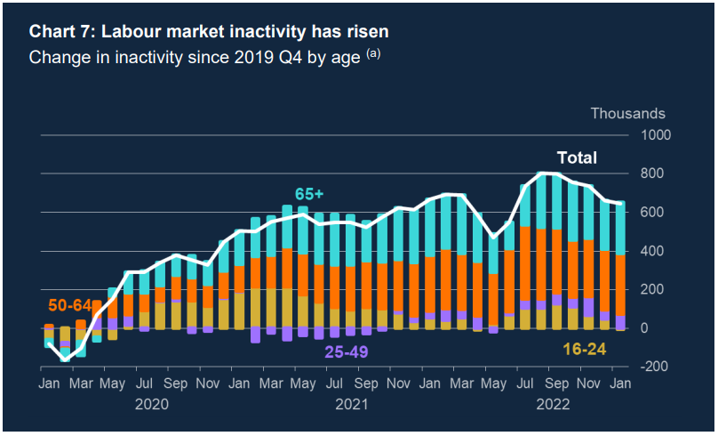
The primary cause of this reduction in labour supply is an increase in the proportion of the population that does not take part in the workforce either by working or looking actively for a job. As you can see in Chart 7 (white line), such economic inactivity rose noticeably during the pandemic. Unlike moves in employment and unemployment, this rise has not unwound as the economy has recovered.
There are two important factors that account for this increase in economic inactivity.
 width=
(a) Changes from the three months to December 2019, based on those aged 16+. Sources: ONS and Bank Calculation. 
The first is the ageing of the population, which, as we have seen, has increased the share of people who are older than what at least used to be the retirement age. As shown here in blue, that accounts for around a third of the increase in economic activity. It will provide a continuing drag in the coming years.
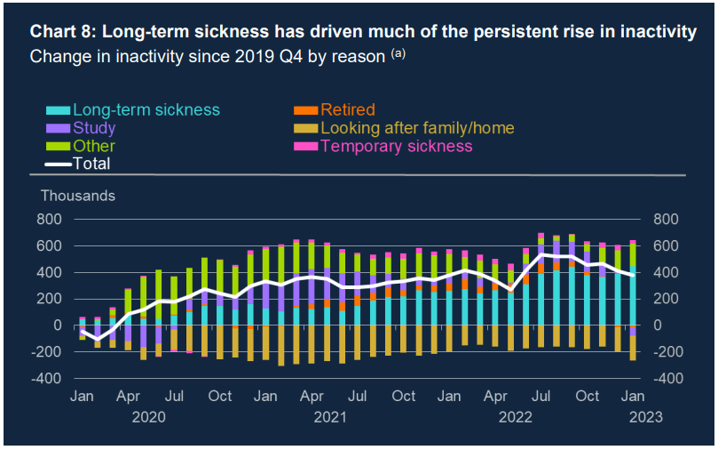
The second factor is a change in the share of working-age people actively participating in the labour market. Particularly striking is the rise in inactivity of people aged 50-64. When leaving the labour force, many people in this age group say they have retired early, making a choice about the life they would like to live. At the same time, people who have become inactive seem to have moved further away from the labour market, most commonly, they say, because their health has deteriorated.
As you can see in blue in Chart 8, long-term sickness has driven much of the persistent rise in inactivity amongst 16 to 64 year olds since the start of the pandemic. That is a striking fact. As their number has increased, the inactive population appears more detached from the labour market. More of the inactive people now say that they would not like a job than before the pandemic, and fewer now expect to return to work.
How should monetary policy respond to such a reduction in labour force participation?
 width=
(a) Changes from the three months to December 2019, based on those aged 16–64. Other reasons include: discouraged workers; those awaiting the results of a job application; have not yet started looking for work; do not need or want employment; have given an uncategorised reason; or have not given a reason. Sources: ONS and Bank Calculation. 
The first thing to note is that this does not seem to be a case in which participation has fallen in response to weaker economic conditions and a weaker labour market. This is not a fall in participation driven by a shock to demand. So, we should not expect there to be a margin of spare capacity outside the workforce that exerts downward pressure on inflation in a way that would call for a lower level of interest rates to stimulate demand.
Instead, the rise in economic inactivity is a change to the supply of labour, independent of demand, in particular by older workers. If those workers have accumulated enough savings to sustain a desired level of consumption much like the one they had before their early retirement, at least for a while, aggregate demand will not have fallen by as much as aggregate supply. We should expect this to put upward pressure on inflation in a way that would call for a higher level of interest rates to dampen demand.
So while population ageing is very likely to pull long-run R* down, as I discussed earlier, the effects on shorter-run r* from a change in labour force participation are harder to assess. In the shorter run, by reducing the productive capacity of the economy, the rise in inactivity driven by early retirement seems likely to have contributed to a rise in cyclical r*. This is part of the reason why we have had to raise Bank Rate by as much as we have.

Monetary policy in the time of Covid

Let me take a step back and revisit our response to Covid in light of this discussion. This episode is a particularly clear example of how difficult it can be in practice to judge the relative impact of supply and demand.
The pandemic was highly unusual and difficult for many reasons. In terms of the economy, it was unusual for the sudden and extreme fall in economic activity, but also for the almost synchronous and equivalent fall in both aggregate demand and supply. In most recessions, demand falls much more abruptly than supply. An output gap opens up, creating spare capacity in the economy and usually a rise in unemployment. That is not what happened during Covid.
The reason this unusually synchronous pattern of movements in aggregate demand and supply took place is not hard to find. Government policy on public health, in the face of the most extreme pandemic for at least a century, led to deliberate lockdowns. Much of economic activity simply ceased.
The important question we faced as monetary policymakers was what would happen when the restrictions were lifted as Covid abated. Would a synchronous and equivalent fall in demand and supply simply be followed by a synchronous and equivalent rise? At the time, I remember being asked quite often if the pandemic would leave scars on the economy: would there be any lasting damage to the economy?
As put, the question was about whether firms would be able to survive the prolonged economic impact of the pandemic, let alone continue to invest in the future – or whether millions would be driven into unemployment as the Government furlough scheme, which remunerated those whose jobs were in effect suspended, was set to end at the end of September 2021. This was by no means clear at the time. The furlough scheme was unprecedented and had been operating for 1½ years, and even firms were unsure of what the effects on recruitment would be, as they reported to the Bank’s Agents at the time.
A key consideration for policy, therefore, was to ensure that supply would come back on stream, and for monetary policy in particular to ensure that there was sufficient demand in the economy to pick it up.
What actually happened was quite different from what we had feared. The situation we found ourselves in over the autumn and winter of 2021-22 was not a looser labour market and an increase in unemployment as the furlough scheme ended. Rather, it was a tighter labour market and a decline in labour market participation. As Chart 6 shows, during this time, supply turned out to be weaker than demand.
In other words, as demand increased after Covid restrictions ended, supply did not follow to the same extent.
At the same time, a rotation in demand away from services and towards goods, in particular in the United States, continued to put strains on global supply chains. And unfortunately, the contraction in the labour force coincided with the most extreme shock of all during this period, the impact, particularly on energy prices, of Russia’s appalling and unprovoked invasion of Ukraine.
So the supply side has played a more important and unusual role in recent macroeconomic developments.

Conclusion

Now let me conclude with a few remarks on where we stand with monetary policy in the United Kingdom today.
The economy has been subjected to some very large and overlapping shocks. The largest impact has come from the effect of Russia’s invasion of Ukraine. This appalling act had a massive impact on energy prices last year, and has substantially affected other prices, notably food. For a variety of reasons, particularly in energy markets, those effects are now unwinding.
It is primarily for this reason that we expect to see a sharp fall in inflation during the course of this year, starting probably in a couple of months or so from now.
Growth in the economy has suffered too, as a consequence of the sheer scale of the hit to the terms of trade. There has been a very large impact on national real income, from which I am afraid there is no hiding. But there is better news on that front, the economy has been more resilient of late, helped by the sharp fall in energy prices.  The same is true for the world economy more broadly.
What does this mean for monetary policy looking forwards? The remit is clear. The adjustment and response to the shocks we have experienced must return CPI inflation to the 2% target sustainably. We must avoid these very large shocks leading to persistent inflation, and that is why we have raised the official interest rate eleven times, to 4.25%.
Recently, the evidence has pointed to more resilient activity in the economy, and likewise employment; signs that nominal wage growth has been rather weaker than expected; and two months in which there was first some downside news on inflation relative to our expectation and then a bit more upside news. This reminds us that the path of inflation will not be entirely smooth and cost and price pressures remain elevated.
Alongside all of this news, we have seen some big strains in parts of the global banking system emerge. Assessing this would be for another occasion. Suffice to say that we believe the UK banking system is resilient, with robust capital and liquidity positions, and well placed to support the economy. We have a strong macroprudential policy regime in this country. With the Financial Policy Committee on the case of securing financial stability, the Monetary Policy Committee can focus on its own important job of returning inflation to target.
We have to be very alert to any signs of persistent inflationary pressures. If they become evident, further monetary tightening would be required. With this in mind, the MPC’s response will be firmly anchored in the emerging evidence.

About the authors

Andrew Bailey

Andrew Bailey has been Governor of the Bank of England since 16 March 2020. Prior to taking up this role, he served as Chief Executive Officer of the Financial Conduct Authority (FCA) from 1 July 2016. As CEO of the FCA, Andrew Bailey was also a member of the Prudential Regulation Committee, the Financial Policy Committee, and the Board of the Financial Conduct Authority.


More on these topics

Tags: