menu
close

Author(s):

Mirko Licchetta | European Commission
Giovanni Mattozzi | European Commission

Keywords:

convergence , GDP , gross fixed capital formation , total factor productivity , income , euro area , EU , financial crises , COVID-19

JEL Codes:

F00 , O47 , O52
This paper investigates determinants of convergence in GDP per capita in the euro area and the EU between 1995 and 2021. It finds that the COVID-19 crisis temporarily slowed convergence but the estimated negative impact is significantly smaller than during the global financial crisis. Diverging effects emerged linked to the timing of the pandemic, the tightness of lockdown measures, and the importance of contact-intensive sectors in the economy, like tourism. However, the easing of lockdown measures coupled with policy support (including the successful vaccination strategy) mitigated the risks of a pandemic-driven persistent divergence in growth. Regression results provide further evidence of convergence in the euro area and the EU over the period 1995-2021. They also highlight the slowdown in convergence since the global financial crisis, which can be mostly attributed both to a contraction in investment rates in converging countries and to the limited catch-up in total factor productivity growth, especially in euro area countries. 

Introduction

Convergence in standards of living is a concept that holds high economic, social and political relevance for citizens’ well-being and is essential for European integration (Buti and Turrini, 2015 and Diaz del Hoyo et al 2017). Large differences in GDP per capita of EU Member States have persisted over time (Graph 1). In 1999, while northern countries enjoyed incomes higher than the EU average, incomes in southern and eastern countries, were well below the average. Contrasting developments in income per capita have occurred in the EU in the last decades. On the one hand, most of the eastern countries have moved up vis-à-vis the EU average over that period. On the other hand, many northern and southern countries have only maintained their income positions or experienced a relative deterioration especially since the global financial crisis.
The asymmetric economic and social impact of the COVID-19 pandemic initially raised concerns of increased divergence in GDP per capita across Member States, jeopardising the proper functioning and stability of the EU and ultimately reducing long-term growth prospects. However, there is broad consensus that the bold and timely economic policy actions, along with the successful vaccination campaign, were effective in mitigating the economic impact of the crisis. They contributed to a faster recovery than initially expected in both the EU-27 and the EA-19, with quarterly GDP exceeding pre-pandemic levels already by the end of 2021.
Graph 1: Income differences across Member States since 1999
 width=
Note: Data on GDP per capita are expressed in constant prices and purchasing power standard (PPS), as a percentage of GDP per capita in the EU-27 in each year. Source: AMECO (Spring 2022 Vintage).
In this article, based on Licchetta and Mattozzi (2022), we investigate determinants of convergence in GDP per capita including the impact of the COVID-19 crisis in the euro area and the EU. Several studies have investigated the impact of the COVID-19 pandemic on economic activity but the impact on convergence in GDP per capita has received less attention so far (see Chatelais, 2021 and Licchetta and Meyermans, 2022). In order to assess developments in income per capita and conduct a comparative analysis between EU-27, EA-19 and EA-12, the first subsection focuses on sigma convergence and the second section focuses on absolute or unconditional beta-convergence.1 The third subsection provides an assessment of the pandemic’s impact based on conditional beta-convergence. The fourth and fifth sections highlight the difference in the impact of the global financial crisis and COVID-19 crisis on income convergence and discuss the drivers of the slowdown in convergence since the global financial crisis. Finally, some policy implications are also drawn.

1. Sigma-convergence

The coefficient of variation of GDP per capita is a widely used measure of sigma convergence. In the period 1995 to 2019, the coefficient of variation decreased by around half in both EA-19 and EU-27 but the global financial crisis significantly slowed the pace of sigma-convergence for both aggregates (Graph 2). By contrast, the COVID-19 crisis led to an increase in the coefficient of variation in the EU although the Commission Spring 2022 European Economic Forecast expected the increase to be temporary and for the downward trend to resume by 2022.
Graph 2: Coefficient of variation of real GDP per capita (PPS) 
 width=
Source: AMECO (Spring 2022 Vintage).

2. Absolute beta-convergence

The global financial crisis and subsequent sovereign debt crisis proved detrimental to income convergence. Compared with 1995-2008, the absolute beta coefficient in the period 1995-2019 was about 1⁄5 lower in the EU-27 and 1⁄4 smaller in the EA-19. Results for EA-12 point to an almost zero absolute convergence coefficient prior to the global financial crisis and to a lack of convergence in the following period although results are not statistically significant.
Graph 3: Absolute beta convergence (1995-2021) in real GDP per capita (PPS) 
 width=
Source: AMECO (Spring 2022 Vintage).
Graph 4: Productivity in euro area Member States 
 width=
Note: GDP in per hour worked in PPS and in percentage of EA-19. The blue refers to EA-12 Member States. The red lines refer to Member States joining the euro area after 2001. Luxembourg and Ireland are not included. Source: AMECO (Spring 2022 Vintage).
Absolute beta convergence estimate suggests that COVID-19 had little impact on the process of convergence. Indeed, the negative relationship between the log of GDP per capita in 1995 and the average GDP per capita growth between 1995 and 2021 supports the hypothesis of absolute convergence for EU-27 and EA-19. The slope of the curve in Graph 3 measures the speed at which the gap with the steady state closes the so called ‘speed of convergence’. The absolute beta convergence coefficient among the EU-27 and euro area has been around 2% over the 1995-21 period. This is broadly consistent with the 2% ‘iron law’’ of convergence, which suggests that economies will converge at a common rate of 2% per year. In addition, as anticipated by the beta-convergence process, a large majority of the countries that joined the EU after 2004 achieved a catch-up consistent with their lower initial levels of income per capita. This result emphasises that, since 1995, poorer EU and euro area countries have exhibited faster growth than richer ones; it is consistent with the dynamics of productivity across euro area countries (Graph 4). On the other hand, there is no significant convergence within EA-12 over the period.

3. Conditional beta-convergence

This paper estimates conditional beta convergence for the euro area and the EU with panel regression using annual data from 1995 to 2021. It puts in relation the growth rates of per-capita real GDP growth with other explanatory variables aiming at capturing drivers of growth in GDP per capita (Temple 1999 and Durlauf et al 2005). In addition to the (lagged) initial income per capita, the estimated model confirms the beneficial influence of investment and trade in goods and services on income convergence (Coutinho and Turrini, 2020). At the same time, an increase in public debt is associated with lower growth in GDP per capita over the long-term although this result should be interpreted with care as causality could go in both directions (Pescatori et al, 2014 and Chudik et al, 2020). Finally, the baseline model is augmented with COVID-19 variables. As expected, the introduction of lockdown measures to curb the spread of the virus (Hale et al 2020) lowered the growth in GDP per capita. The negative impact of the lockdown measures increases with the size of the tourism sector, a labour-intensive sector characterized by face-to-face interactions and severely hit by border closures (Milesi-Ferretti, 2021). On the other hand, growth in GDP per capita increases with the rollout of the successful vaccination strategy providing evidence that it supported the recovery by facilitating the re-opening of the economy (Deb et al,  2021).

4. Impact of COVID-19 crisis on income convergence

The COVID-19 crisis had a negative impact on convergence in the EA-19, although such an impact is expected to be more temporary and less sizable than following the global financial crisis. This might be due to the very different nature of the COVID-19 and the global financial crises and the different policy responses. The global financial crisis originated from macro-financial imbalances that had built up for years requiring a long-lasting adjustment by households and governments. By contrast, COVID-19 was a major exogenous shock emerging from a health emergency the effects of which were mitigated by governments. Given the policy support provided to households and companies affected by the lockdown, once restrictions on mobility were lifted, the economy quickly rebounded.
Despite the deeper drop in GDP, we find evidence for a less sizable impact on income convergence of the COVID-19 crisis relatively to the global financial crisis. The estimated absolute and conditional beta-convergence coefficients for the EA-19 remained broadly unchanged following the COVID-19 shock (Graph 5). This suggests that the strong policy response to COVID-19 at EU and national level mitigated the negative economic impact. By contrast, the estimated beta coefficient decreased significantly following the global financial crisis suggesting a longer-lasting impact. One important caveat is that the full impact of the COVID-19 crisis might have not fully played out yet although the evidence available points to lower long-term damages than following the global financial crisis.
Graph 5: Beta coefficient estimates (absolute value) 
 width=
Note: Results are for the EA-19 sub-sample but they are qualitatively unchanged for the EU-27. Source: Author’s calculations.
Graph 6: Cumulative change in GFCF in the euro area since 1999Q1 
 width=
Source: Eurostat.

5. Drivers of the slowdown in convergence after the global financial crisis

Income convergence in the euro area slowed significantly following the global financial crisis. The estimated conditional beta coefficient is significantly smaller in the post-2007 period (Graph 5). The significant fall in investment rates of many converging countries in the period following the global financial crisis contributed to the observed slowdown in convergence. In particular, capital accumulation was sluggish in the euro area in the decade following the global financial crisis (Graph 6) and gross fixed capital formation (GFCF) took about 10 years to return to its pre-crisis level. Indeed, there is preliminary regression evidence that the contribution of GFCF declined after the global financial crisis. By contrast, in the period before 2008, growth in GFCF was higher than average in many converging countries.
The lull in convergence following the global financial crisis might also be related to the more pronounced slowdown in growth of total factor productivity (TFP) (Graph 7), a key driver of income convergence (ECB 2015). Limited productivity catch-up (IMF, 2017), in particular a progressive reduction in TFP growth, is a key driver for the lack of convergence of some of the early members of the euro area (Greece, Portugal, Spain and Italy). Euro area countries with both high and low labour productivity levels (defined according to real GDP per hour worked in 1999) have experienced a slowdown in TFP growth over recent decades (Graph 7). However, the countries with low initial productivity experienced consistently lower TFP growth throughout the sample period and a more pronounced slowdown during the global financial crisis. TFP growth in the euro area, which was already low before the global financial crisis, has worsened since then. At the same time, TFP growth was the key driver of post-accession growth in the countries that joined the euro area after 2007. Differences across countries, and regions, are also stark in some cases.

Graph 7: Decomposition of average annual GDP growth in EA-19
 width=
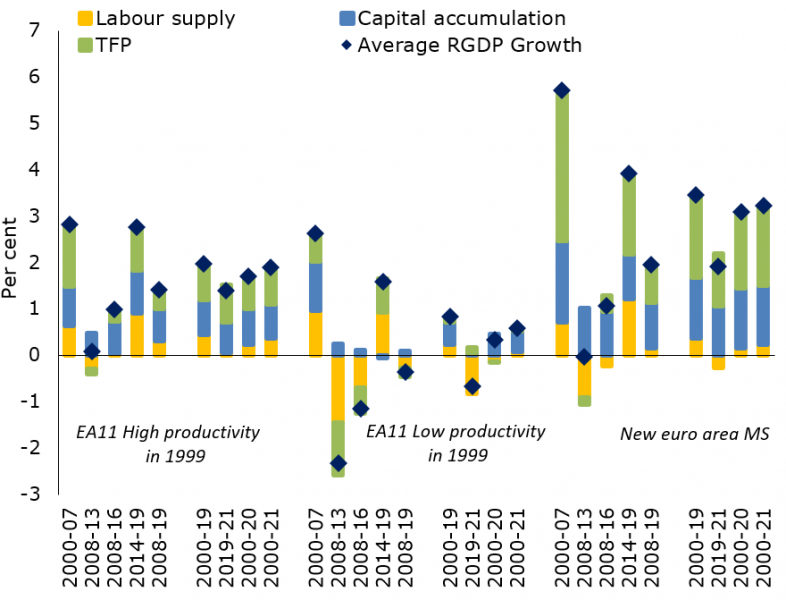
Note:
Luxembourg is excluded. Source: Eurostat.

Conclusion and implications for policy

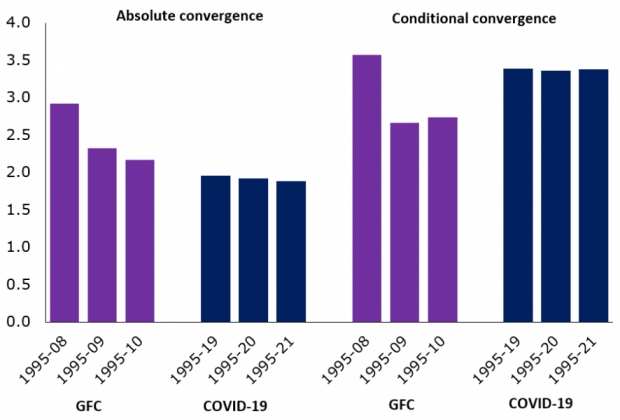
The COVID-19 crisis was like no other and had more severe consequences on countries particularly exposed to contact intensive sectors. Some of the most affected economies already experienced below EU average per capita income levels in 2019. At the same time, there were great concerns that the COVID-19 shock could further reduce the degree of convergence across the EU and lead to further divergences. The preliminary evidence provided in this paper, however, suggests that the COVID-19 shock is likely to have been significantly less damaging to the convergence process than the global financial crisis. Some of the channels that played out after the global financial crisis were probably not in play during the COVID-19 crisis.

This paper provides further evidence for the growth-enhancing role of trade, and physical and human capital. The latter driver of growth is particularly relevant in the context of the unprecedented skill shortages that emerged during the recovery from the COVID-19 crisis. The importance of human capital as a driver of growth also highlights the key role of skill policies in addressing the root causes of labour shortages. Finally, this paper further stresses the need to continue tackling structural economic weaknesses, in particular through investments and reforms needed to improve productivity growth, a main driver for income convergence.

References

Buti, M. & A. Turrini (2015). Three waves of convergence. Can Eurozone countries start growing together again? 17 April VoxEU.
Chatelais, N. (2021), Covid-19 and divergence in GDP declines between Europe and the United States, EcoNotepad – post n°229
Chudik, A., Mohaddes, K., Pesaran, H., & Raissi, M. (2013). Debt, Inflation and Growth Robust Estimation of Long-Run Effects in Dynamic Panel Data Models. Federal Reserve Bank of Dallas, Globalization and Monetary Policy Institute Working Papers, 2013(162). https://doi.org/10.24149/gwp162
Coutinho, L., & Turrini, A. (2020). Real Convergence Across the Euro Area. Intereconomics, 55(5), 301–311. https://doi.org/10.1007/s10272-020-0920-2
Diaz del Hoyo, J. L., Dorrucci, E., Heinz, F. F., & Muzikarova, S. (2017). Real Convergence in the Euro Area: A Long-Term Perspective. SSRN Electronic Journal. https://doi.org/10.2139/ssrn.3082205
Durlauf, S. N., Johnson, P. A., & Temple, J. R. (2005). Chapter 8 Growth Econometrics. Handbook of Economic Growth, 555–677. https://doi.org/10.1016/s1574-0684(05)01008-7
European Central Bank (2015). Real convergence in the euro area: evidence, theory and policy implications, Economic Bulletin, Issue 5/2015.
Hale, T. & Al. (2020), Variation in government responses to COVID-19. BSG Working Paper Series.
International Monetary Fund. (2017). Euro Area Policies: Selected Issues. IMF Staff Country Reports, 17(236).
Furceri, D., Deb, P., Kothari, S., Tawk, N., Jimenez, D., & Ostry, J. (2021). The Effects of COVID-19 Vaccines on Economic Activity. IMF Working Papers, 2021(248), 1. https://doi.org/10.5089/9781589063761.001
Licchetta, M., & Meyermans, E. (2022). Gross Fixed Capital Formation in the Euro Area During the COVID-19 Pandemic. Intereconomics, 57(4), 238–246. https://doi.org/10.1007/s10272-022-1058-1
Licchetta, M., & Mattozzi, G. (2022). Convergence in GDP per capita in the euro area and the EU at the time of COVID-19. Quarterly Report on the Euro Area (QREA), vol. 21(3).
Milesi-Ferretti, G. M. (2022). The Travel Shock. SSRN Electronic Journal. https://doi.org/10.2139/ssrn.4028722
Pescatori, A., Sandri, D., & Simon, J. (2014). Debt and Growth: Is There a Magic Threshold? IMF Working Papers, 14(34). https://doi.org/10.5089/9781484306444.001
Temple, J. (1999). The New Growth Evidence. Journal of Economic Literature, 37(1), 112–156. https://doi.org/10.1257/jel.37.1.112
  • 1.

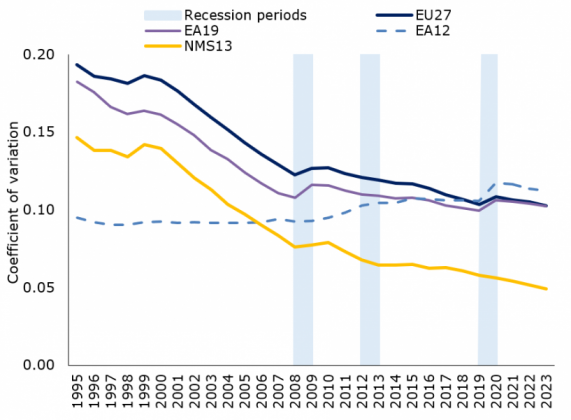
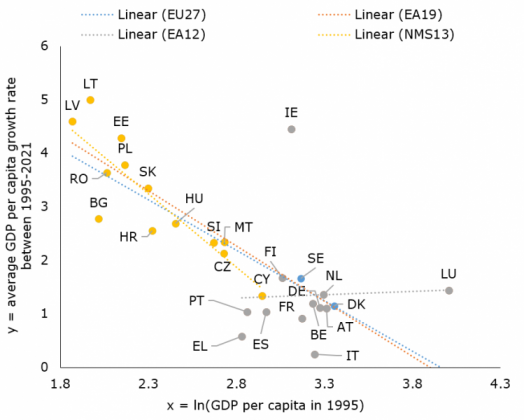
    Income convergence is defined in terms of GDP per capita. This study focuses on all European Union Member States (EU-27) and euro area countries (EA-19) Member States respectively. EA12 includes the former euro area Member States (Austria, Belgium, France, Finland, Germany, Ireland, Italy, Luxembourg, Netherlands, Portugal, Spain and Greece). New Member States (NMS-13) include Cyprus, Czechia, Estonia, Hungary, Latvia, Lithuania, Malta, Poland, Slovakia, Slovenia, Bulgaria, Romania and Croatia.

About the authors

Mirko Licchetta

Mirko Licchetta is an Economist at the DG ECFIN of the European Commission covering the euro area. Prior to the European Commission, he worked as a senior economist in the International Division of the Bank of England and as an economic adviser at the Office for Budget Responsibility (the UK fiscal council) and at the UK Treasury. He holds a Ph.D. in Economics from the University of Rome ‘La Sapienza’ and an MSc in Economics from the University of Warwick.

Giovanni Mattozzi

Giovanni Mattozzi is currently an Economic Analyst at the DG ECFIN of the European Commission, working in the Policy Coordination unit. Prior to the European Commission, he worked in a consultancy as a Data Analyst and in the International Labour Organisation (ILO), in the Employment Policy Department. He holds a MSc. in Economics from the University of Bologna and BSc in Economics from the University of Rome ‘La Sapienza’.

More on these topics

Tags: