The authors are very grateful to Monica Defend, Lorenzo Portelli, Vincent Mortier and Thierry Roncalli from Amundi; Jeremy Jouvance and Florian Vincent from Amundi Technology; Roberta Fortes from University of Paris 1 Pantheon-Sorbonne and Sonja Tilly from University College London for their helpful comments.
In this research, we show that variables from the Global Database of Events, Language and Tone (GDELT) convey significant informational content that can improve on a purely macroeconomic approach when modeling the US equity market. Based on these metrics, we construct time-series that represent and measure how some narratives that appear to be battling each other are changing in the current market environment. Namely we are able to appraise the strength of the roaring 20s, back to the 70s, secular stagnation and monetary economic narratives, but we also add up topical societal narratives related to environmental or social aspects, as well as a geopolitical risk narrative. We formalize an informational content framework and show that including quantitative signals that translate into qualitative stories brings added value when determining the stock market’s movement. Indeed, on top of higher explanatory power from their underlying variables, narratives can improve the diversification of standard macroeconomic models and enhance their quality. As such, our results advocate for a close monitoring of narratives in financial markets.
“Economic events are substantially driven by contagious spread of oversimplified and easily transmitted variants of economic narratives.” Shiller (2020a) in Q&A: Robert Shiller on the Power of Narratives in YaleNews.
The concept of economic narratives was coined by Shiller (2017), who defined the field as “the study of the spread and dynamics of popular narratives, the stories, particularly those of human interest and emotion, and how these change through time, to understand economic fluctuations”. This frontier field of study has roots in economics and finance but also in psychology and history. Indeed, the market participants’ memory structures the temporal reference of past events and will shape their perception of future economic and financial fluctuations (Blanqué, 2010).
In Figure 1, we present the timeline of the events that have had the greatest impact on the US economy in the past century, generally accepted by academics. A brief review of these episodes is provided in the box hereafter. Considering the current economic environment, characterized by high inflation, rapid technological advances, muted long-term growth expectations and the reversing of monetary policy, we are particularly confident in the topical relevance of the back to the 70s, roaring 20s, secular stagnation and monetary stories.
Figure 1: US CPI Across Recent Economic History
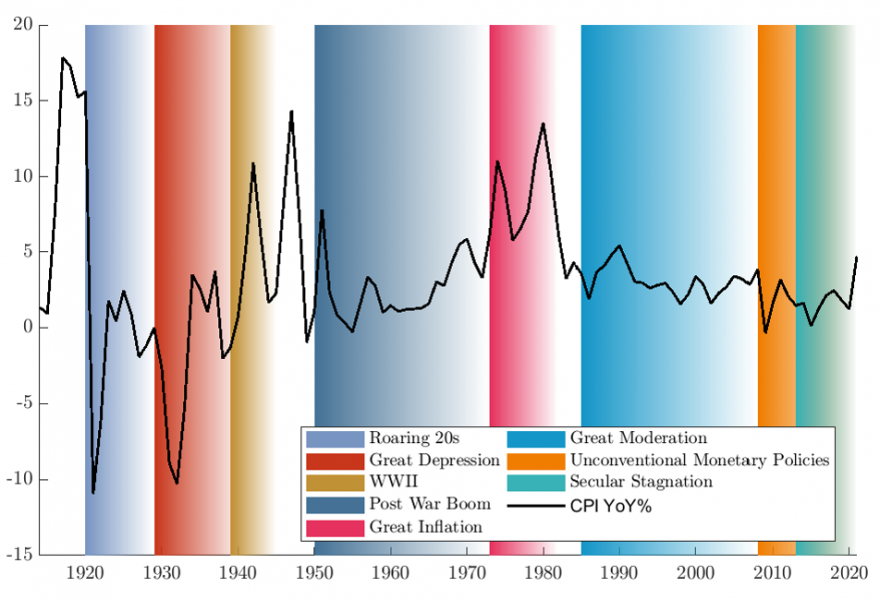
Note: US Consumer Price Index (1982/1984=100), YoY % changes
Source: Bank of International Settlements, Amundi Institute
Narratives result from public consciousness of certain major market events or episodes. However, under certain circumstances, they can also be intentionally en- gineered, as illustrated in Figure 2. For instance, central bankers have long brought narratives into their policy-making process, in order to tailor, not only the financial industry’s expectations, but also those of the public.
Figure 2: Narratives Construction Process
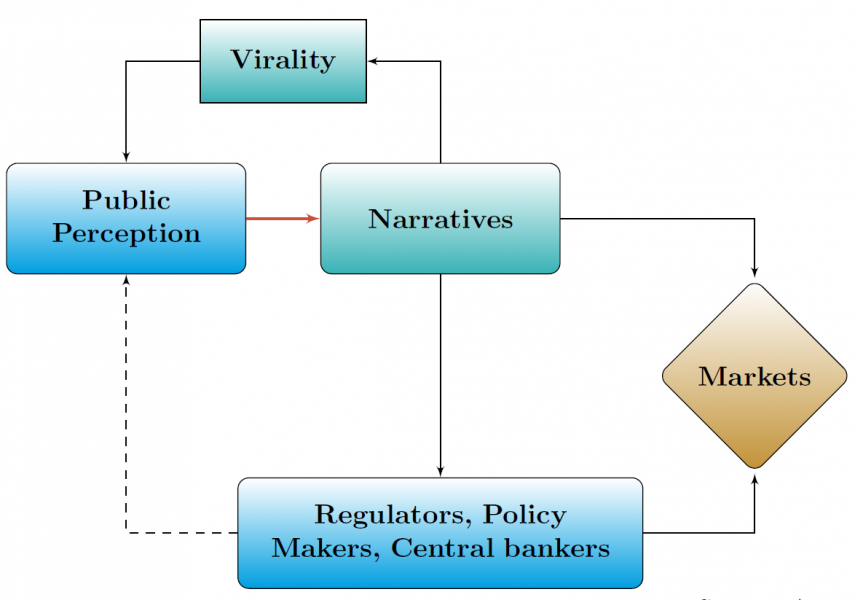
Source: Amundi Institute
A Short Review of the US Major Economic Events in Recent HistoryThe roaring 20s were a period of sustained prosperity in the post-war US, a boom notably fostered by technological advances (Eichengreen & Mitchener, 2004). Under the Gold Standard, inflationary pressures were simply transmitted to the rest of the World, with no need for the FED to raise interest rates. This era ended with the Great Depression in 1929, often attributed to the credit boom from the 1920s (Eichengreen & Mitchener, 2004), stock market speculation, but also FED’s tightening of 1929 (Friedman & Schwartz, 1963). A debt deflation phenomenon started in the early 1930s where deflation inflates real debt burden and triggers defaults, precipitating prices fall (Fisher, 1933). Gold Standard defense and banking panics were to blame (Bemanke & Harold, 1991). This period was a monetary policy failure as the FED could not use its tools to prevent deflation and hence it failed on its lender of last resort mission. Unemployment rate skyrocketed to 25% in 1933 while deflation pursued. The New Deal initiated by Roosevelt in 1933 suspended the Gold Standard, which implied that the central bank could raise the money supply to relieve the economy (Romer, 1992). In 1934, GDP and inflation rebounded but unemployment remained very high. Hansen (1939) feared that this subdued growth environment he coined “secular stagnation” would last. WWII coincided with a surge in manufacturing jobs but its financing also brought the need for low long-term rates for the FED. Its independence from the Treasury department on monetary policy was brought in 1951 (Clarida, 2021), when the FED was torn between pursuing low interest rates and counteracting runaway inflation. The Treasury – FED accord restored the ability of the FED to set interest rates and relaxed its government debt monetization obligation. A vigorous post-war recovery occurred, and public policies such as the Marshall plan, eased the economy’s transition from wartime manufacturing (Eichengreen, 2010). The 1960s were marked by rapid GDP growth, productivity gains and low unemployment. The monetary policy turned unambiguously expansionary to achieve full employment. This policy shift, combined with rising oil price and Vietnam war’s financing led to the Great Inflation (Lopez, 2012) where an“inflationary psychology”, pushed consumers to spend even more rapidly (Yellen, 2015). But the Volcker Disinflation era began in 1979, pushing rates higher, up to 20% in 1980, shifting the economy from indeterminacy, driven by self-fulfilling fluctuations, to price level determinacy (Coibion & Gorodnichenko, 2011). Such discipline conducted to the mid-1980s’ Great Moderation, marked by a lower volatility in both output and inflation, the latter being contained by globalization (Rogoff, 2003). The mid-1990s environment coined “Goldilocks” by Gordon and Stock (1998) was cut short, as the growing housing bubble turned into the subprime mortgage crisis in 2007. After conventional monetary policy was exhausted to counteract the Global Financial Crisis (GFC), the FED executed large-scale asset purchases and enhanced communications. These unconventional monetary policies had a real effect on the economy (Joyce et al., 2012). In 2013 Summer brought back the qualification of secular stagnation, sparking a debate with Bernanke (2015), yet it is still studied by academics (Schwartz, 2021; Summers, 2015). |
Smart (1999) describes how as early as the 1990s, the “monetary-policy story” narrative at the Bank of Canada fed into the Quarterly Projection Model (QPM), a model used in particular to formulate projections. In fact, the QPM aims to model how the economy functions and how its different “sectors” (households, firms, government, foreign economic players and the central bank) interconnect. In the same spirit, empirical finance turned to numerical indicators to explain future asset prices. For instance, Fama (1984) exploited forward interest rates to forecast both the spot rate one month ahead and the longer-term expected risk premium. For the equity market, Chen et al. (1986) modeled the sensitivity of stocks to “systematic economic news” by constructing state variables that described the economy, derived from quantifiable standard economic series (industrial production, inflation, credit risk premia, term structure, market indices, consumption, oil prices). In their modeling framework, news was actually captured by the innovations in the state variables. Metrics related to equity valuation have also been used to forecast the stock market outlook (Campbell & Shiller, 1998).
Alternatively, instead of treating market trends as a given (such as inflation or the term structure) the latter can be assimilated into factors and, as a result, estimated from a sufficiently large set of asset prices. As such, asset sensitivities are derived from factor loadings. For instance, Rosenberg (1974), assuming linearity of the stocks’ beta, showcased the existence of extra-market components based on firms’ fundamentals. This approach, also known as multi-factor modeling, was extensively applied in the 1970s and 1980s, thanks to the advances of the Arbitrage Pricing Theory, as a way to appraise market trends rather than directly capturing economic news. More precisely, these models calculate common factors in the cross sectional returns of assets, as well as each asset’s sensitivity to these factors (Barra, 1998). However, it appears that the reduction of dimensionality with the common factors was also an adaptation to the computing power of the time.
In fact, the tools available to academics and practitioners have rapidly evolved over recent decades. More precisely, improvement in computing capacities combined with wider dataset availability – also known as “Big Data” – led to the emergence of new approaches to capture and model market trends, compared to benchmark approaches such as multi-factor models. Natural Language Processing (NLP) is increasingly studied and applied in finance. Indeed, the use of alternative data sources, such as social networks (Bollen et al., 2011) or media, and sentiment analysis could enrich traditional factor models or even replace them in the long run. Actually, NLP and text-mining techniques can be applied to a wide range of textual supports, such as Congress’s speeches (Ash et al., 2021) or central bank communication (Fortes & Le Guenedal, 2020), but also forums (Nassirtoussi et al., 2014).
In conjunction with this – purely quantitative – investigation of key features to formalize and predict market developments, the concept of narrative emerged and is gaining in popularity (Roos & Reccius, 2021). Recently, Shiller2 further explored the notion of narratives in his book (Shiller, 2020a), providing several examples and case studies presenting a clearer view of his interpretation of narratives. Despite this, the concept is not fully formalized and further research is needed to converge toward a fully accepted definition. However, it appears that the line between the qualitative conception of narratives and the volume or tone associated with topics – that can be extracted using text-mining techniques – is rather thin. In practical terms, Shiller (2020b) conducted a case-study on the longest US expansion. He associated keywords with hypothesized economic narratives. He then searched his main keywords (Great Depression, Secular Stagnation, Sustainability, Housing Bubble, Strong Economy, Save More) in a news and newspaper database that has accumulated 97 million articles since 1989 (at the time of writing). In terms of theorization and definition, in their review of the increasing awareness of narratives in the economy, Roos and Reccius (2021) propose requirements to define collective economic narratives. To qualify, a narrative should be a story that is sense-making and shared by members of a group while emerging and proliferating in social interaction. They also require the narrative to suggest actions to economic agents.
In this paper we propose to define narratives as diffuse stories that often echo the economic history of the past century considering their similarities in terms of macroeconomic fundamentals. Considering recent market dynamics, we aim to measure the importance of the roaring 20s, secular stagnation, back to the 70s and monetary narratives in the current economic environment. This choice of four economic narratives was constrained by principles of parsimony and orthogonality3. However, we also take the stance to account for the main 21st century challenges, augmenting the aforementioned set with a social stress and an environmental narrative. We also include one related to geopolitical risk. Indeed, themes underlying these narratives, such as extreme weather, social cohesion erosion or geoeconomic confrontation are perceived as some the biggest risks over the next decade (World Economic Forum, 2022). As such, these time-series are based on a simplified and qualitative conception of narratives. In terms of measurement, in our paper we chose three metrics that we believe are acceptable proxies of narratives. Namely we employ a measure of volume (how viral a story goes) and an indicator related to the tone (whether the story is associated with positive or negative sentiment). We also build a “Count Weighted Tone” metric, that combines both.
Our analysis builds upon the Global Database of Events, Language and Tone (GDELT). In the spirit of Tilly et al. (2021) and Consoli et al. (2021), who propose the addition of sentiment scores from GDELT into macroeconomic forecasts, we show that metrics from this dataset display significant informational content for predicting movements in the S&P500, enhancing both the explanatory power and the quality of pure macroeconomic models. If we refer to the alternative data classification proposed by Denev and Amen (2020), GDELT falls under the “news” category. We exploit the metadata as we aggregate some GDELT variables under different topical narratives, in a qualitative manner. The variables underlying our chosen narratives also bring added value when forecasting the direction of the US equity market. In addition, these economic, societal and geopolitical stories can be monitored, and their relative importance evaluated. The paper is structured as follows. Section 2 introduces the GDELT database and the metrics that can be derived from it. Section 3 illustrates the informational content from GDELT variables in the modeling of US equity market, compared to standard macro models. Building on these results, Section 4 details the construction of narratives, and introduces a framework to monitor their evolution. Section 5 offers some concluding remarks.
The GDELT Project4 is a research collaboration of Google Ideas, Google Cloud, Google and Google News, the Yahoo! Fellowship at Georgetown University, BBC Monitoring, the National Academies Keck Futures Program, Reed Elsevier’s LexisNexis Group, JSTOR, DTIC and the Internet Archive (Tilly et al., 2021). This initiative aims to “construct a catalog of human societal-scale behavior and beliefs across all countries of the world, connecting every person, organization, location, count, theme, news source, and event across the planet into a single massive network that captures what is happening around the world, what its context is, who is involved, and how the world is feeling about it, every single day”(Leetaru & Schrodt, 2013). The example map in Figure 3 presents the geography of discussions about protests (orange), cyberterrorism (purple) and unrest (red). As mentioned by Shiller (2020a) in YaleNews, “narrative economics means studying the popular narratives that underlie people’s thinking, not just economists’ thinking”, thus the GDELT dataset appears appropriate to build-up narratives series.
Figure 3: Illustration of the GDELT Dataset
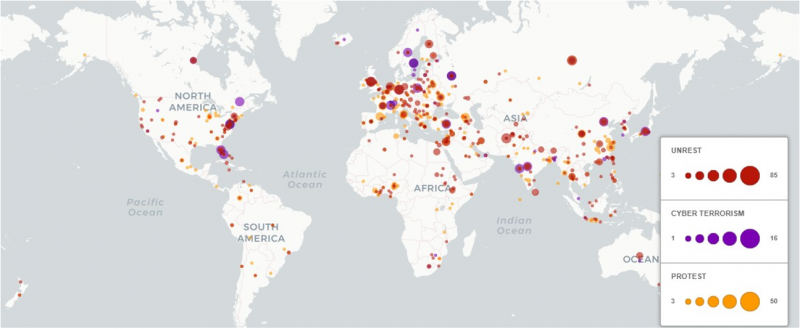
Source: https://carto.com/blog/gdelt/
Note: orange implies that protest-related mentions appear to be associated with a location over the last hour but not necessarily that a protest is taking place at that location.
The GDELT Event Database records more than 300 of categories of physical activities5, millions of themes and emotions, around the world, from riots and protests to peace appeals and diplomatic exchanges, geo-referenced to the city or mountain- top, across the entire planet dating back to January 1st, 1979 and updated every 15 minutes. We aggregate the 15-minutes files on a daily basis from January 2019 to March 2022. For each row (or event) of the file, we can find multiple identifiers associated with several locations. In this study, we focus on the US but we also calculated data for G20 countries, that we employ for illustrative purposes in Section 4.
For the January 2019 to March 2022 period, we extract approximately 130 000 time-series or “elementary-unit” narratives. To retrieve the volume, we aggregate counts for each identifier, in each location (we retain countries as locations), each day (i.e. summing overs the 15 minutes files). The GDELT dataset presents a natural bias toward United-States and China, with naturally higher information volume associated with these countries. Analyzing volume series also allows us to distinguish correlation and association between topics, as illustrated in the box on the taxonomy hereafter.
Grouping by identifier, we can observe those that had the largest volume in a single day in the United-Sates over our period of analysis in Figure 4. The identifier with the highest number of counts, “TAX FNCACT” translates the relationship between two entities, and hence exists in most pieces of news. We witness the dominance of health related topics, due to the COVID-19 pandemic. Government related identifier also rank quite high. Finally, the ethnicity aspects have been salient issues since 2019 in the US, reflecting the national public protests following the death of George Floyd in our sample period.
Figure 4: Top 30 Daily Volume by Identifier in the US between 2019-2021
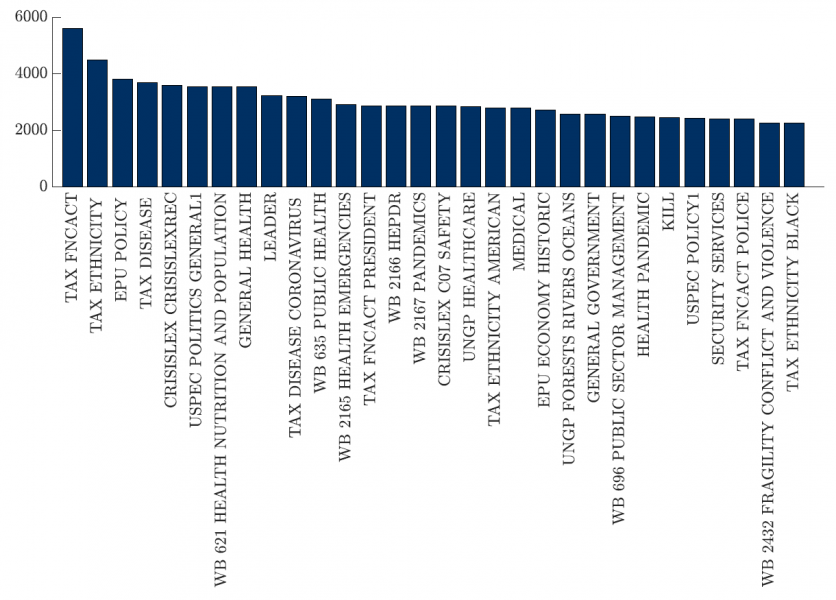
Note: ⋆HEPDR = HEALTH EMERGENCY PREPAREDNESS AND DISASTER RESPONSE
Source: GDELT, Amundi Institute. Authors’ calculations
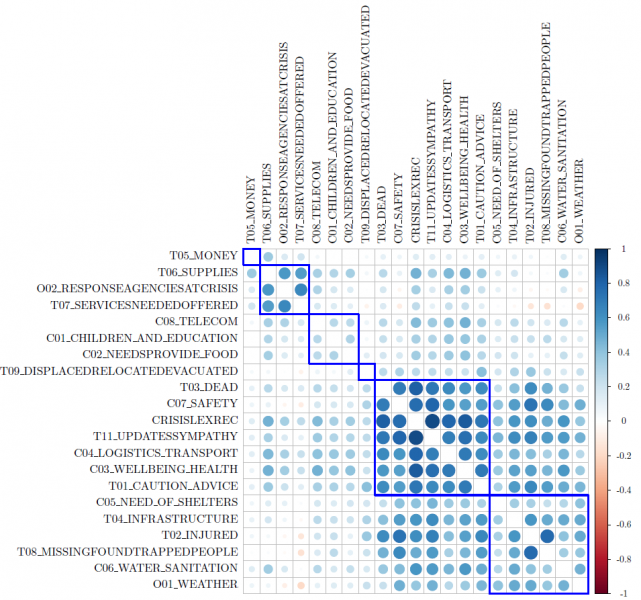
The GDELT TaxonomyAmong the 23 500 identifier series extracted for the United-States in the period 2019-2022, we can distinguish multiple sub-categories. For example, the prefix ‘WB-’ denotes an identifier covered by the World Bank taxonomy* and contains topics potentially material in the definition of the narratives time-series. The prefixes ‘ECON-’ or ‘CRISISLEX-’ are respectively denoting documents related to either economic (Tilly et al., 2021) or crisis related subjects (Olteanu et al., 2014; Temnikova et al., 2015). We remark that this latter category might be particularly relevant to identify signals on the geopolitical risk. Running a correlation analysis, we witness that despite all being under the CRISISLEX category, the volume series present unequal correlations which suggests that the topics are not concomitantly evoked, highlighting the richness of our dataset.
Source: Amundi Institute. Authors’ calculations In this example, the association that can be made clustering by volume clearly distinguishes material needs (in the upper left) from a more disaster response related groups (death, safety, transport..). * Topics from World Bank Taxonomy appear in the form ‘WB 1234 XYZ’, where ‘1234’ is the unique label and ‘XYZ’ the human-readable label. |
Departing from the maximum number of counts in a day, we investigate the time dimension of the topics that fluctuate over time in terms of volume. We construct daily time-series, associated with numerous identifiers. Figure 5 presents the daily counts of mentions associated with a small sample of variables from the GDELT dataset between 2019 and 2022.
Figure 5: US Daily Volume Time-series (3M Average) Built from GDELT
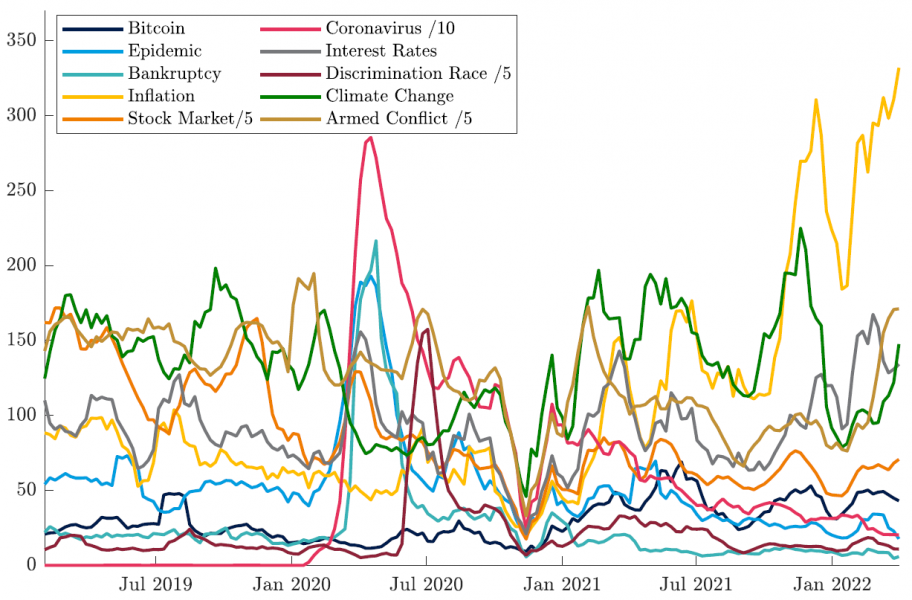
Source: Amundi Institute. Authors’ calculations
Accounting for the time-dimension yields insightful results. Indeed, it demonstrates the strong momentum of some identifiers in particular periods. For instance, the coronavirus identifier peaked in March 2020, along with epidemic and bankruptcy aspects, when the pandemic hit. Similarly, the discrimination race topic culminated in June 2020, echoing the Black Lives Matter movement that shook the US at that time. Still on the societal challenges, we witness how the climate change identifier rose during the COP 26 UN Climate Change Conference. On the macroeconomic front, the inflation topic has been particularly dynamic since the FED announced an acceleration of its tapering in the light of rising inflationary pressures. Similarly, interest rates have also been under an increasing scrutiny. The end of our sample is marked by an acceleration in the armed conflict mentions echoing the Russian invasion of Ukraine.
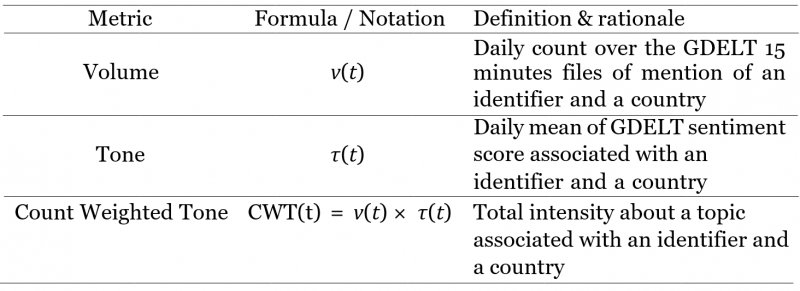
On top of identifier daily counts and volume time-series, we are able to enrich further our analysis. The average daily tone is another metric that can be built from the GDELT database. Indeed, this dataset offers an aggregated metric of the sentiment associated with each mention6. Aggregating each day, over each topics allows us to construct a daily series of tones, in the same spirit as the volume series. Finally, we also employ the product of the volume and tone, the Count Weighted Tone (CWT) metric, a measure allowing to gauge the viral and polarizing stories. In Table 1 we summarize these different metrics retrieved from the Algorithm (1), described in Appendix A.1. In the rest of our analysis we will focus on the US.
Table 1: Daily Metrics
In this section, we are keen to evaluate how GDELT variables can impact financial markets. More precisely, we want to quantify the supplemental improvement brought about by the Count Weighted Tone of GDELT metrics in the explanatory power of the S&P500 compared to a model based solely on macroeconomic variables. Moreover, particular attention will be paid to the overall quality and parsimony of the models. In our analyses we employ weekly identifiers filtered on US location, for the period from January 2019 to January 2022.
3.1 Performance of Macroeconomic Variables
Our first objective is to assess the explanatory power of traditional macroeconomic models for forecasting US equity market fluctuations. We developed a rule-based process, that will be employed to assess the informational content of different datasets along the paper. We describe the full Algorithm (2) in Appendix A.1 and will scrutinize two metrics in particular, that both penalize the number of regressors in their appraisal of a model’s goodness of fit:
![]()
where N is the number of observations, and k the number of parameters.
![]()
where l refers the log of the likelihood function of the model, with k the number of parameters and N observations.
We have chosen this agnostic and rule-based approach for defining the “best” macro models, instead of arbitrarily choosing a combination of variables from the FRED database maintained by the Federal Reserve Bank of St. Louis. To sum up our rule-based strategy on the macroeconomic front, we start from the FRED database and we extract 269 weekly variables. We first exclude those with low variability on the period of analysis and pursue the filtering process by retaining only the metrics that, when lagged (from 1 to 4 periods), exhibit a significant impact on market return RM (here defined as differentiated S&P500) in a univariate framework. We also discard metrics that present too high pairwise correlation with others, with a strict threshold set at 45% to prevent any collinearity issues within the models. Among the remaining GDELT variables, we employ an iterative process to find the combination of metrics that maximise the ![]() of Equation (3), with a constraint on the number of variables ranging from 1 to 10, and retrieve the AIC to assess the parsimony and quality of the models.
of Equation (3), with a constraint on the number of variables ranging from 1 to 10, and retrieve the AIC to assess the parsimony and quality of the models.
![]()
where RM refers the market return, namely the variation of the S&P500, with k the number of variables X and p its weekly lags.
In Figure 6, we present both the AIC, and the ![]() to appraise the informational content of macroeconomic variables from FRED.
to appraise the informational content of macroeconomic variables from FRED.
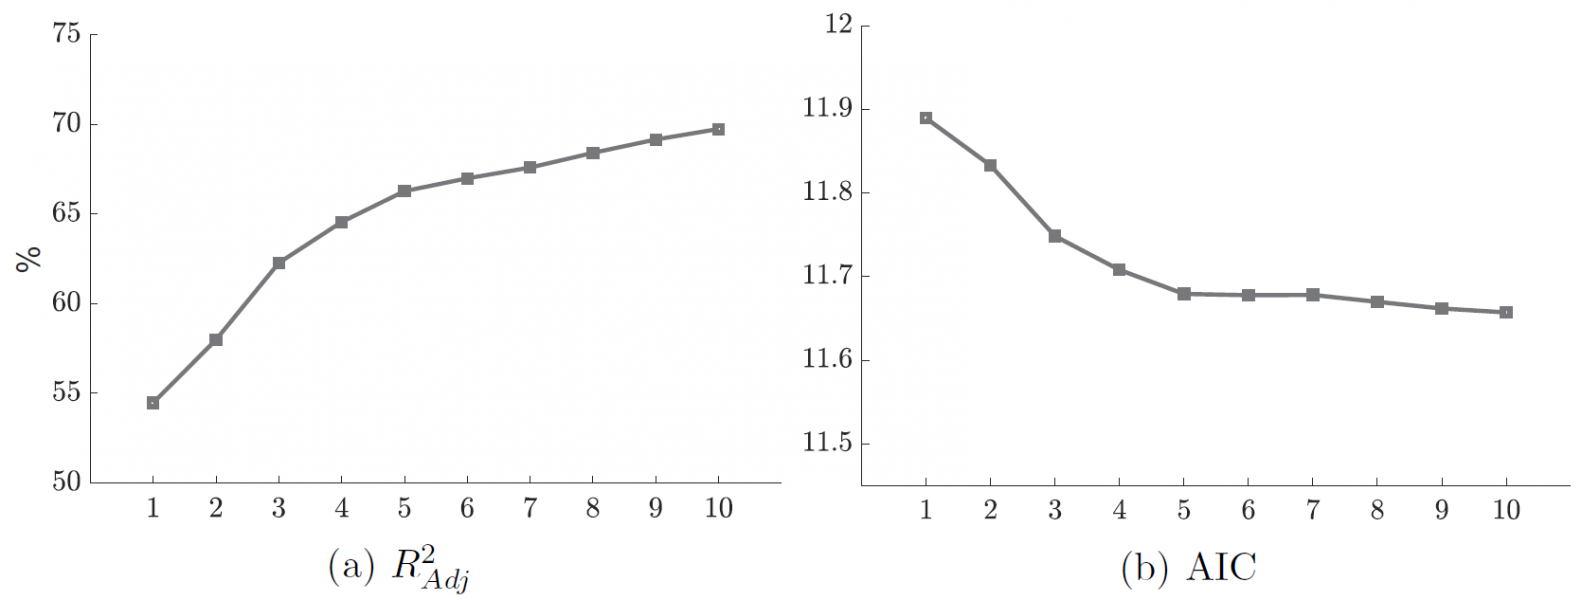
Figure 6: Informational Content Associated with Macroeconomic Variables
Source: Amundi Institute. Authors’ calculations
We witness how the quality of the macro model increases sharply when the number of variables rises to 5. However, the enhancement brought about by any additional variable is marginal (like a elbow inflexion), the AIC being fairly stable between 5 and 10 metrics. We believe that this effect derived from the parsimony principle embodied in the AIC. A similar conclusion can be drawn from the ![]() that increases rapidly for the selection of the first 5 variables, but that slows with the addition of extra FRED metrics.
that increases rapidly for the selection of the first 5 variables, but that slows with the addition of extra FRED metrics.
3.2 Performance of GDELT Variables
We replicate the previous framework of analysis, described in Algorithm (2) in Appendix A.1, on the large GDELT dataset. However, we have to apply supplemental steps to reduce the dimension of the dataset, considering that we start from 23 000 identifiers. Hence, we first apply a randomized grid search approach. We are keen to focus on the metrics with the highest volume, therefore we select those in the top volume percentile. Then random groups of variables are formed from the GDELT dataset. For each group, we identify the variables that present lags (up to 4) that are significant at the 1% level, tackling the potential non-stationarity of the series with in-difference data, to explain variations of the S&P500. This set of metrics constitutes our first pool. Second, we employ an alternative approach (see Figure 14 in Appendix A.1) to filter the most interesting features, in order to complement our first pool of metrics. More precisely, we select the GDELT variables with the highest information volume (10%) over the 2019-2021 period. Then, we randomly cluster the variables into groups: we obtain 25 groups of GDELT variables. In each group, we observe the most correlated identifiers. For each correlated pair, we remove the variable with the lowest amount of information over the period. After these first steps, for each cluster, we run a tree-based regression of the S&P500’s variations against the average Count Weighted Tone of the GDELT variables together, lagged from 1 to 4 periods, and taken in difference for those that are non-stationary over the full period. Shapley value associated with each metric can then be retrieved, in the same manner as Lepetit et al. (2021). SHapley Additive exPlanations value derived from the work of Lundberg and Lee (2017), based on the seminal study of Shapley (1953), and is one of the main ways to measure the feature importance in a model’s prediction. Among these different regressions, we select those with a R2 higher than 65% and the associated variables. Based on this set of metrics, we apply a hierarchical clustering procedure based on Pearson/ Spearman correlations, which allows us to determine which variables are the most significant drivers of the S&P500, based on their Shapley values. Finally, we apply the aforementioned algorithm on this subset of variables, combined with our first pool. We add the GDELT variables filtered on the US to previously selected FRED data, in order to assess their supplemental informational content in the determination of S&P500. Results are presented in Figure 7.
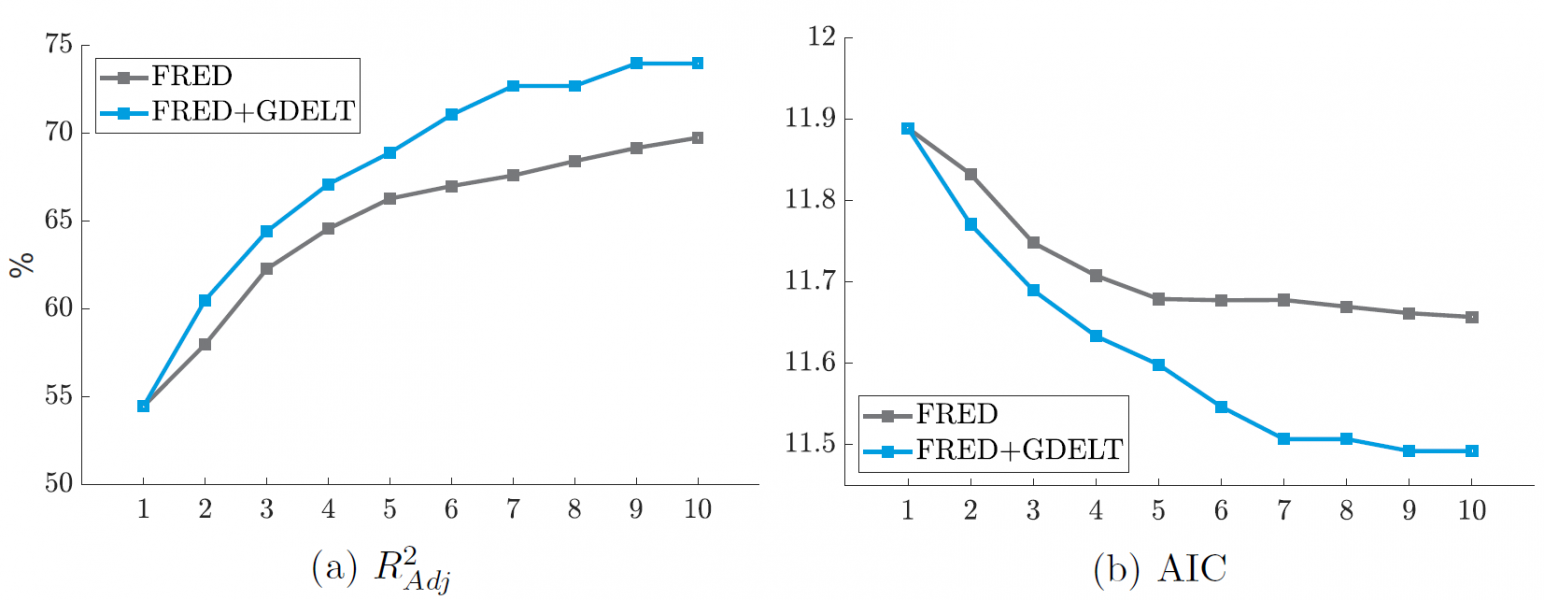
Figure 7: Informational Content of GDELT Metrics
Source: Amundi Institute. Authors’ calculations
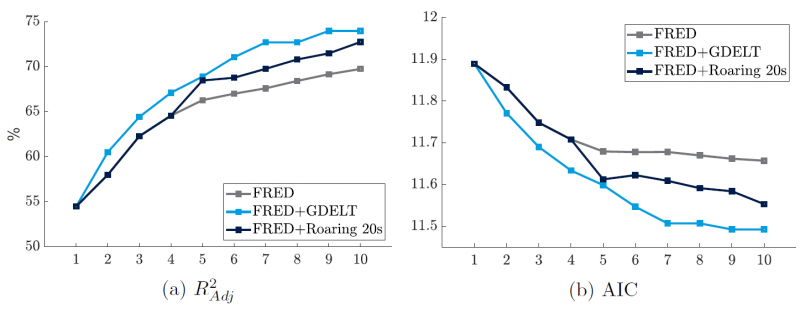
Our quantitative selection of GDELT variables allows to improve both the AIC and the of the ![]() models, independently of the number of parameters retained. However, the improvements are particularly meaningful when models are built from at least 5 metrics. We believe that this result is insightful, in the sense that it illustrates the diversification benefits that metrics related to news, and their associated sentiment, can bring to pure macro models. Indeed, we notice how the addition of traditional macroeconomic variables appears less efficient once the model reaches 5 parameters, while on the contrary, GDELT metrics can still bring significant added-value.
models, independently of the number of parameters retained. However, the improvements are particularly meaningful when models are built from at least 5 metrics. We believe that this result is insightful, in the sense that it illustrates the diversification benefits that metrics related to news, and their associated sentiment, can bring to pure macro models. Indeed, we notice how the addition of traditional macroeconomic variables appears less efficient once the model reaches 5 parameters, while on the contrary, GDELT metrics can still bring significant added-value.
Shiller mentioned that “we need to incorporate the contagion of narratives into economic theory”. However, if the concept of economic narratives is introduced in his book (Shiller, 2020a) through multiple examples, no explicit definition is provided. “What Shiller calls ‘narrative economics’ […] is the use of narratives as a predictor of potentially damaging economic events. […] the Nobel-Prize theorist makes it clear that his purpose is not just to explain economic behavior using narratives but to provide ‘better forecast of major economic events’ (xiii), the anticipation and prevention of which should be considered as a ‘moral imperative’ (xv)”(Giraud, 2021). In this context, there are two possible approaches to identify and track narratives. First, we can consider all subjects and filter quantitatively, based on the significance of their market impact, in the spirit of Section 3.2. Indeed, this approach is in line with the essence of narratives in the fact that we extract subjects that drive the market. Another approach consists in building, for each narrative, the corresponding lexicons in a qualitative manner. Thus this approach starts with a qualitative definition of the major narratives of interest and the proposal of aggregation techniques to track their evolution.
4.1 Economic Narratives
Building on the different metrics at our disposal in the GDELT database, we first propose to construct qualitatively four economic narratives, reflective of current economic environment. A narrative can be defined as the inter-connection between different themes, that tells a story. As a result, we aggregate identifiers under different groups: these clusters represent themes that constitute different economic narratives. This choice of narratives is surely subjective, but roots in the current fundamentals of the US economy. Indeed, the combination of macroeconomic imbalances and rising inflationary pressures, notably via the commodity prices channel, has resonated with market players, echoing the 70s. Similarly, technological progress has been increasing at a fast pace in the latest years and could foster productivity gains, as in the 20s. However, on the downside, doubts have been cast on the ability of the economy to return to GDP growth rate above 2% in the medium term, with closing output gap, ageing population and increased savings rates. This brought back the fear of secular stagnation. Last but not least, after nearly 15 years of unconventional monetary policies, the gradual comeback of central banks to traditional anchors implies that the monetary story is likely to remain very topical in the upcoming years. Table 2 presents the broad topics that constitutes our building blocks to construct these roaring 20s, monetary, back to the 70s and secular stagnation narratives. The GDELT identifiers associated with the different themes we define are presented in Tables 6 – 9 in Section A.2 in Appendix. As far as the aggregation process is concerned, we proceed as follows: for each GDELT topic we compute the daily Count Weighted Tone, that we then sum together under a theme. To obtain the final narrative time-series, we sum the metrics associated with all the underlying themes for a given narrative.
Table 2: Economic Narratives Construction
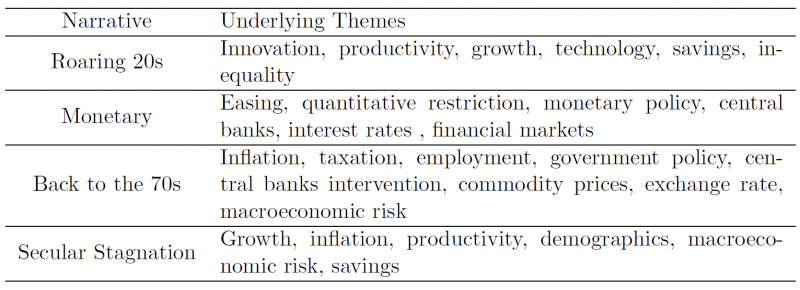
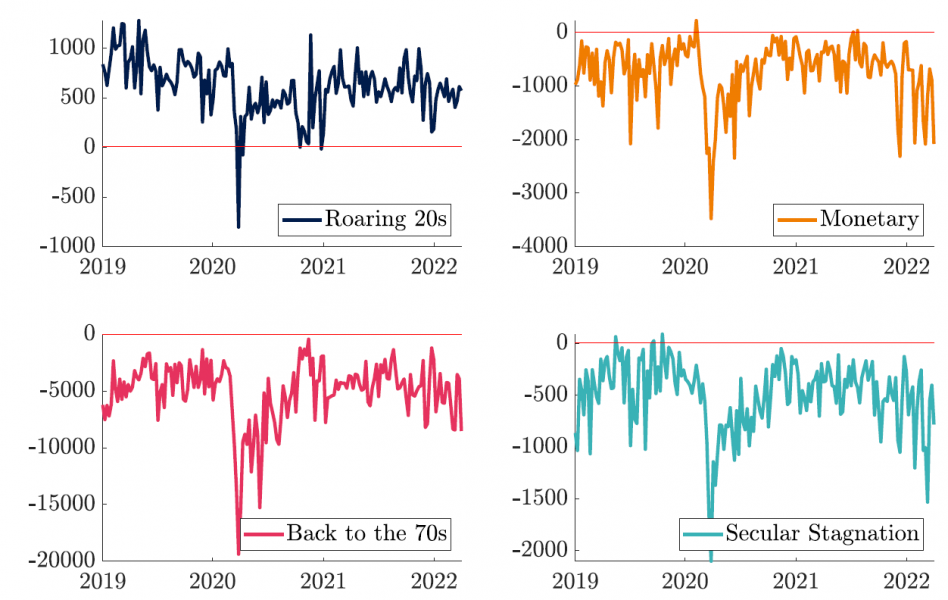
Figure 8: Economic Narratives – Count Weighted Tone
Source: Amundi Institute. Authors’ calculations
Figure 8 plots the different time-series of our selection of economic narratives. Hence we are able to appraise their respective strength since January 2019. First, we witness how the roaring 20s benefits from positive connotation compared to other stories, that are associated with negative sentiment. Second, in the month of March 2020 – when the COVID-19 deeply shook financial markets – the sentiment associated with all these stories worsened, hinting at a severe bear market. As far as the monetary narrative is concerned, it reached a noticeable low in November 2021, when the FED began its tapering. It is also interesting to note how the back to the 70s narrative was particularly active in the first quarter of 2021, namely when inflation posts revealed rising price pressures. Moreover, since the beginning of 2022, this narrative has strengthened, as the secular stagnation.
Figure 9: The Battle of Economic Narratives – Count Weighted Tone (3M Standardization)
Source: Amundi Institute. Authors’ calculations
Figure 9 allows to assess the dominance of the different narratives over the others through time by plotting their respective contribution to the total sum of absolute Count Weighted Tone (standardized over the past 3 months). While the secular stagnation story was dominating after the beginning of the COVID-19 pandemic, the back to the 70s narrative gained momentum in the first part of 2021, in accordance with rising inflation expectations. The roaring 20s scenario was also particularly praised in that period. The monetary narrative culminated in November 2021 with the beginning of monetary policy normalization in the US. Since mid-March 2022, the roaring 20s narrative is getting some traction.
4.2 Societal Narratives
In a second round of analysis, we decided to add social stress and environment narratives. Indeed, their mentions were highly visible in the GDELT dataset, as shown in Figure 5. In addition, we are convinced that these new societal challenges can be as structuring as the more familiar and established economic narratives we analyze. Social cohesion and climate change mitigation are strong challenges that will shape the next decades (World Economic Forum, 2022), but also prerequisites to the well-functioning of the society. Moreover, the materiality of these topics on asset pricing has risen sharply in the past years (see for instance Lepetit et al. (2021) on the equity front or Semet et al. (2021) for the fixed income universe), supporting the relevance of these narratives in driving financial markets. Central banks are also increasingly accounting for these new societal challenges. Indeed, Schnabel (2021) argues that central banks were in the public spotlight for their inflation mandate for decades, yet, the youngest generation has not been confronted to price pressures of the same magnitude as those observed in the previous century. As a matter of fact, Schnabel (2021) states this generation is rather concerned about climate change and unemployment, and an increasing share of the public actually expects the European Central Bank (ECB) “to play a more active role in tackling wider societal challenges, with the top priority given to climate change as well as growth and employment”, on top of their pure price stability mandate. The ECB hence aims to monitor the impact of its monetary policy on these issues, and explore how it can contribute to the transition of the economy toward a more sustainable road. Central banks are also concerned by inequalities, as highlighted by Powell stating that “the economic outlook here in the United States has clearly brightened […] it has been slower for those in lower paid jobs” (Powell, 2021). The Netherlands central bank, has already begun to integrate sustainability aspects since 2015 (Knot, 2015). This illustrates the rising importance of societal narratives in policy making. We consider that the relevance of these narratives from central bankers’ viewpoint validates the Roos and Reccius (2021)’s conditions to qualify to their definition of economic narratives. We employ the same approach as for economic narratives to build the societal time-series (see Table 10 and 11 in Appendix A.2 for a complete definition), accumulating GDELT mentions within themes, as presented in Table 3, then aggregating them at the narrative level.
Table 3: Societal Narratives Construction
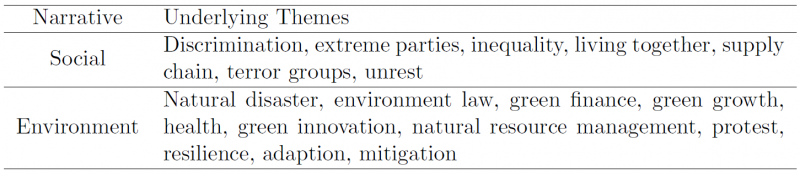
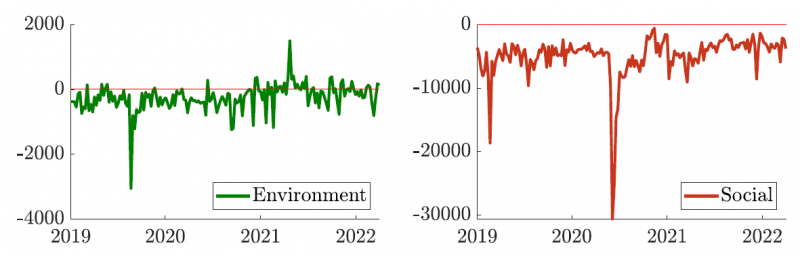
Figure 10 corroborates the stylized facts previously identified, such as the social stress following the death of George Floyd in May 2020. The fall in the social narrative in December 2021 actually mirrors the Human Rights Day, when the US issued financial sanctions and visa bans on diverse officials and organizations notably from Myanmar, China and Russia. On the environmental front, the sizeable drop in the narrative in the summer of 2019 echoes the massive Amazon wildfires that triggered protests in Latin America for the defense of the rainforest, while the peak observed in April 2021 – associated with a positive tone – is actually concomitant with the Earth Day.
Figure 10: Societal Narratives – Count Weighted Tone
Source: Amundi Institute. Authors’ calculations
4.3 Geopolitical Risk Narrative
Finally, we introduce another type of narrative, that translates geopolitical risk, in the spirit of Caldara and Iacoviello (2018). As highlighted by the authors, tensions or crisis on the geopolitical front can have substantial impact on the world economy and financial markets. Both the threats and the acts can indeed delay or divert investment decisions. As such, geopolitics must be carefully watched by market participants. Furthermore, geopolitical events can lead to short-term impact on financial markets, with temporary wider risk premia, but their impact can also be long term, leading to a permanent shift in the valuation of assets through the expected cash flows channel (Klement, 2021).
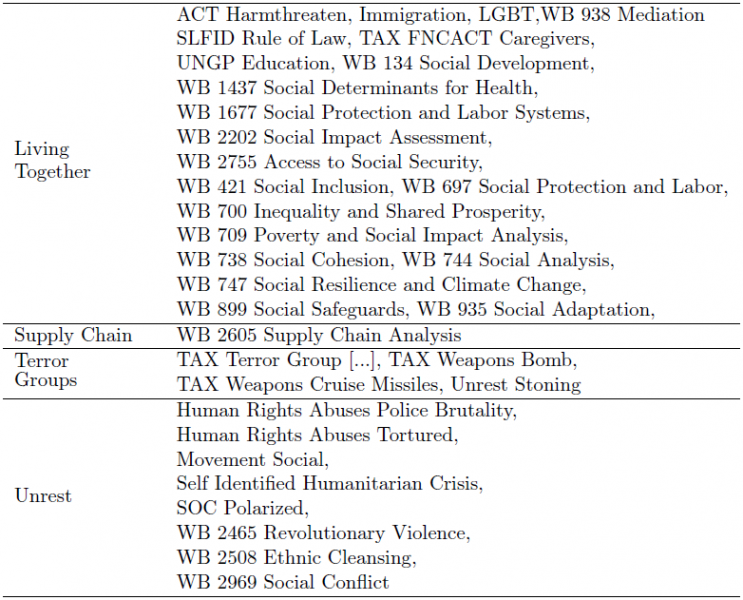
However, in our appraisal of geopolitical risk, we decide to enlarge the definition initially retained by Caldara and Iacoviello (2018), which refers to the risks “associated with wars, terrorist acts, and tensions between states that affect the normal and peaceful course of international relations”. Indeed, we choose to equally account for national political turmoil, that can spark, by snowballing effect, international tensions. For instance, a national corruption scandal may have consequences at the local level (for instance leading to protests or a president destitution) but can also offend the international community, becoming in-fine a geopolitical issue. To monitor the importance of the geopolitical risk narrative, we propose to employ the lexicon presented in Table 12 in Appendix A.2, and summarize the major themes in Table 4. The terminology overlaps the one from Caldara and Iacoviello (2018) that identified different categories of threats (geopolitical, nuclear, war, terrorist) as well as war and terrorist acts. However, as highlighted by Klement (2021), their index encompasses a “very narrow set of geopolitical risks”, hence we enlarge this lexicon, to capture a wider range of sources, but also consequences from geopolitical risks.
Table 4: Geopolitical Risk Narrative Construction
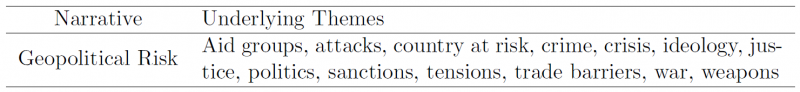
The first level of appraisal logically relies on the measures of tensions, that can emanate from rising extreme ideology, unfair justice or corrupted politics. When these tensions escalate, the concepts of crisis but also the mentions of aid groups may allow to shed the light on the risk faced by populations. Going one step further, we embody the notions of attacks, weapons crimes and wars. We also tackle the sanctions, notably on the trade front that may arise, potentially at the international stage, following political turmoil. The same method as previously presented is employed to build the geopolitical risk narrative from underlying GDELT variables, aggregated in themes. The time-series is presented in Figure 11.
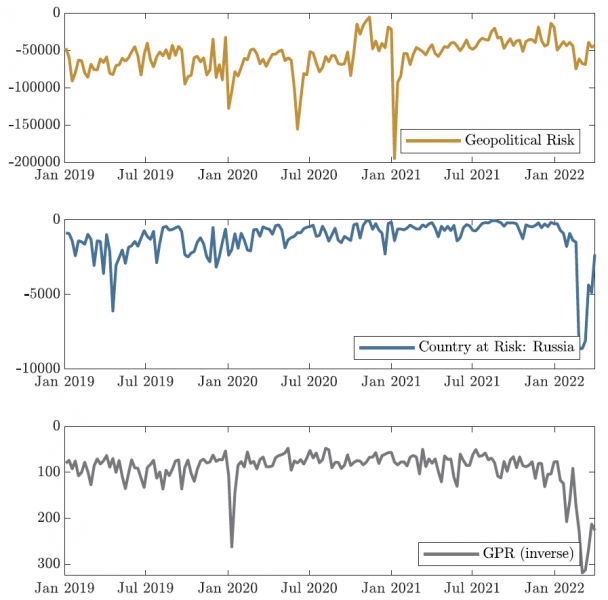
The first significant drop in the geopolitical risk narrative illustrates the Iran – US tensions escalations, following the assassination of Qassem Soleimani in the Baghdad Airport. The second one, reflects the murder of George Floyd, and subsequent national protests. The biggest spike observed translates the Capitol assault at the very beginning of January 2021. Finally, the geopolitical risk narrative has started to deteriorate since the end of January 2022. This move was triggered by the Russian invasion of Ukraine, which notably plummeted the “country at risk” theme, as illustrated by the underlying Russian metric in the middle of Figure 11. As hinted by the geopolitical risk narrative, we observe how the metric rapidly deteriorated in February 2022 with the Russian invasion of Ukraine. The previous low in the “country at risk” time-series of Russia from the viewpoint of US goes back to April 2019, with the publication of the Mueller report, chronicling Russian interference in Trump’s election in 2016. A few months later, at the beginning of December 2019, the NATO alliance condemned Russia’s deployment of new intermediate range missiles, that Russia denied. In November and December 2020, the sentiment deteriorated again, when the US Space Command revealed that Russia conducted anti-satellite missile tests. At the bottom of Figure 11, we compare our geopolitical risk narrative, with the geopolitical risk index (GPR)7 proposed by Caldara and Iacoviello (2018). We stress that the narrative we built decreases when risks increase while the GPR must be inversely read.
Figure 11: Geopolitical Risk Narrative – Count Weighted Tone
Source: Amundi Institute. Authors’ calculations
As far as commonalities are concerned, both series convey rising geopolitical tensions on two major events: the rising tensions between Iran and US, following the death of a military officer in Baghdad in a targeted US-led drone strike in January 2020, as well as the Russian invasion of Ukraine, at the end of our sample period. However, the time-series also exhibit differences, owing to a wider range of tensions accounted for (notably at the national level) in the geopolitical risk narrative compared to the GPR. This is particularly noticeable with the drops associated with US-centric events, such as the murder of George Floyd or the Capitol assault.
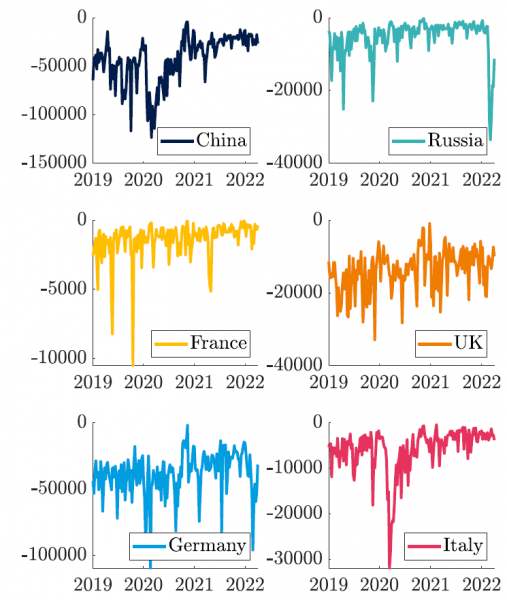
The Geopolitical Risk Narrative Across Different LocationsFor non-US countries, we are able to construct the same geopolitical risk narratives as we did for the US (except that we left out the theme “country at risk”, not having a comparable survey of “friends” and “enemies” for each country). This allows to measure the sentiment on these aspects from different countries’ viewpoints as showcased below:
We witness how most regional geopolitical risk indicators worsened with the COVID-19 outbreak in late February 2020, especially for Italy and China, first at the epicenter of the pandemic. However, more local events can also be witnessed. For instance, China’s geopolitical risk was exacerbated in the first days of October 2019, depicting the Hong-Kong protests, than intensified on the occasion of China’s National Day. Germany’s high trade dependence with Russia and Ukraine is reflected by the strong reaction in the German metric following the Russian invasion of Ukraine in February 2022, while the impact is more contained for other European countries which raises the subject of fragmentation. In France, the deterioration of the relationship with Turkey is noticeable in October 2019 and led to a large fall in the indicator. The geopolitical risk metric for the UK declined on the day of the London Bridge stabbing on the 29th of November 2019. |
4.4 Informational Content of Narratives
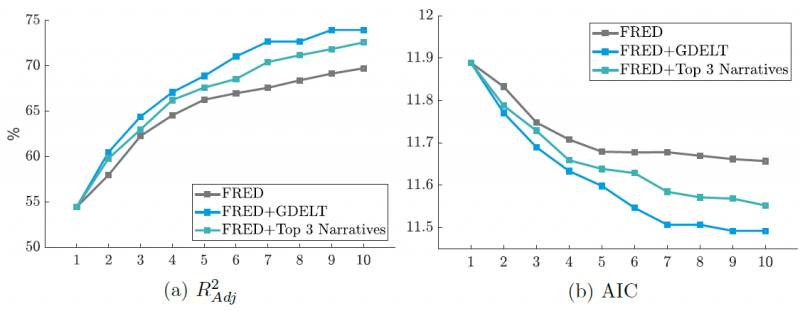
We are now keen to investigate whether the narratives we defined bring compelling informational content for the prediction of US stock market. This exercise differs from the previous ones, run on the FRED and GDELT datasets in the sense that our set of initial variables has been defined in a purely qualitative way. Still, we employ the same Algorithm (2), as defined in Appendix A.1. However, we work on each narrative separately. Therefore, we start from a different set of GDELT identifiers for each narrative, as defined in Tables 6 – 12 in Section A.2 in Appendix. As such, the algorithm we propose retains the best combination of metrics that underlies our narratives. To illustrate, Figure 12 presents the goodness-of-fit of different models with a varying number of parameters, based on our narrative definition of the roaring 20s.
Figure 12: Informational Content Associated with Narratives
Source: Amundi Institute. Authors’ calculations
In addition, in Figure 15 in Appendix A.1, we present the average informational content yielded by the three narratives with the highest explanatory power. From Figure 12 and 15 we observe that narratives, or the qualitative selection of GDELT metrics that tell a story, can enrich traditional macroeconomic models in a compelling manner. Indeed, a specification that augments key macro indicators with a few news and sentiment related time-series gains in quality and in explanatory power. It is interesting to highlight how such model actually lies in between the FRED and the FRED + GDELT approaches – both purely quantitative. Actually, on that front we argue that the FRED + GDELT lines presented in Figure 12 represent the highest estimates from this database. Our results highlight that qualitatively defined narratives are as powerful diversifiers as raw GDELT metrics in prediction models for the US equity market.
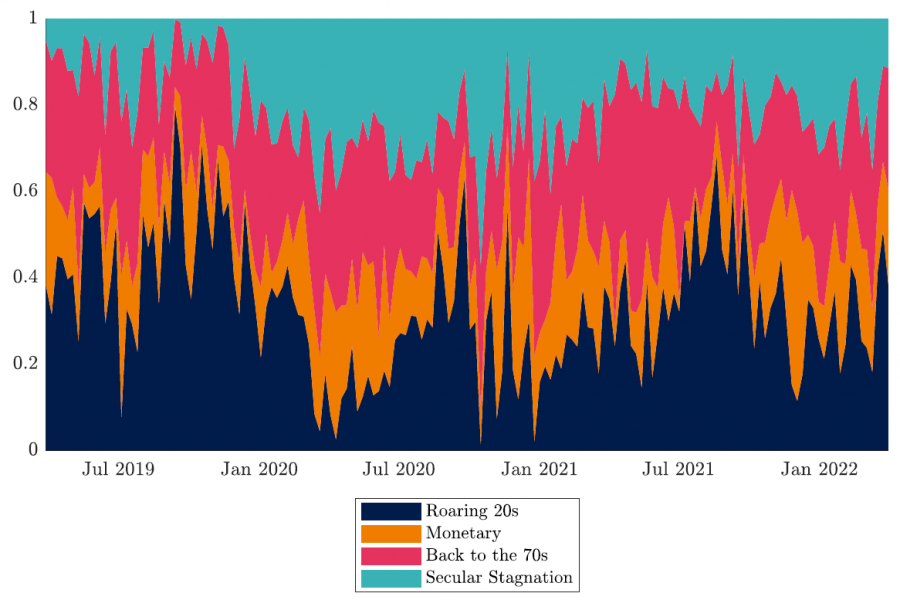
4.5 Battling Narratives
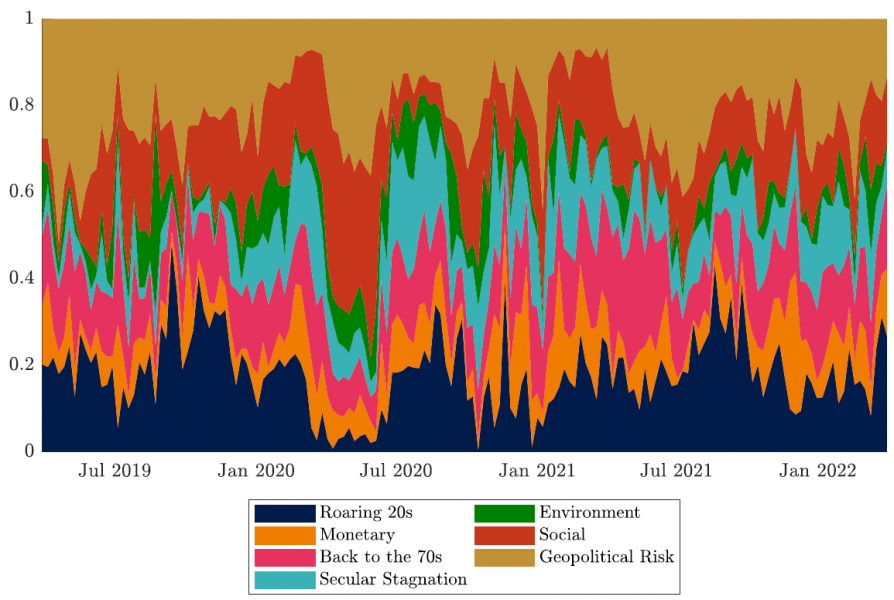
In this section we blend the traditional economic narratives, with the more recent societal ones, as well as the geopolitical risk narrative in order to assess their respective power. To evaluate their influence, at each date we sum the absolute Count Weighted Tone (standardized over the past 3 months) of the different narratives and retrieve each one’s contribution. Figure 13 illustrates this analysis. The variability of the societal narratives is actually very close to the economic ones, which supports the relevance of these novel stories in explaining the current economic environment. Moreover, the geopolitical risk narrative plays a significant role along more traditional economic stories. The quarterly ranks of these different narratives over the past years is summarized in Table 5.
Figure 13: The Battle of Narratives – Count Weighted Tone (3M Standardization)
Source: Amundi Institute. Authors’ calculations
The combination of the different types of narratives we introduced yields insight- ful results. First, we witness how the societal challenges can be highly structuring when characterizing recent market environment. The social narrative ranks particularly high since 2019. While the environment one seems less powerful over the same period, the fact that the tone associated with this story may stand in positive territory (see Figure 10) echoes the roaring 20s story and its innovation dimension. Hence, we are convinced that the environmental narrative will gain in prominence in the upcoming years, driven by a positive momentum on green innovation.
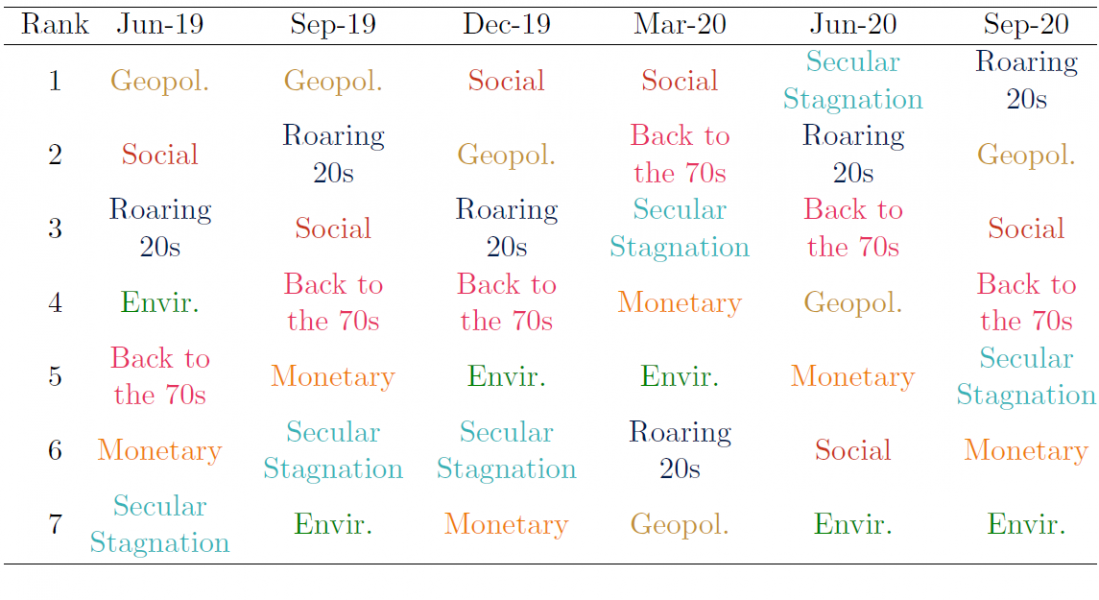
Table 5: Narratives Quarterly Rank
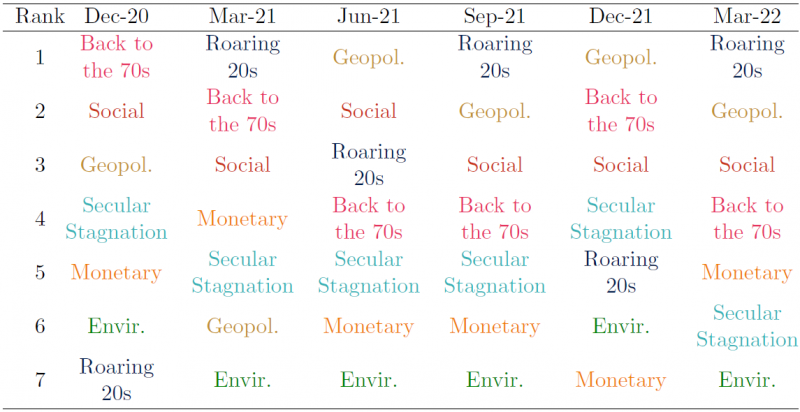
Source: Amundi Institute. Authors’ calculations
Second, geopolitical risk has exhibited a strong variability since 2019. A worsening of the narrative can relegate other narratives to the background temporarily. In fact, the geopolitical risk story was very active in our sample period, compared to other narratives, such as the monetary, secular stagnation or environment that may be completely muted at some dates. It implies that the back to the 70s, roaring 20s, social and geopolitical risk narratives have always been active since January 2019. Finally, we can observed how at the end of February 2022, following the Russian invasion of Ukraine, the geopolitical risk narrative surged in the US. Our analysis showcases that this event actually fuelled back the fears of secular stagnation, by increasing uncertainty and curtailing growth prospects. Hence, we argue that the monitoring of the battle of narratives, on top of the distinct series built from news, brings significant added value in the assessment of society’s current sentiment.
In this section we showed that qualitative narratives can be build from GDELT variables. We demonstrated that augmenting traditional macro models with narratives can increase their goodness-of-fit, acting as strong diversifiers. Last but not least, the visibility (or the volume), tone and intensity (captured by the Count Weighted Tone) of these stories can be easily monitored, so are their relative dominance over each other, and through time.
In this paper, we investigate the informational content that can be derived from alternative metrics and used for financial markets prediction. We employ the GDELT project database and retrieve the volume and tone metrics associated with a wide range of topics, extracted from online, printed and broadcast news. Based on these analytics we build a Count Weighted Tone indicator, to appraise the most visible and polarizing variables. In the next section, we demonstrate how these indicators can improve the explanatory power of standard macroeconomic models when determining US equity market’s moves. Indeed, once the standard macro models reach a certain number of variables, it appears that adding extra macroeconomic indicators does not improve the quality of the model. Our results advocate for a diversification of these traditional models towards alternative data. Finally, the last part of the paper demonstrates that narratives, defined in a qualitative manner, related to the current economic, societal or even geopolitical environment, can be constructed from metrics related to news, such as those from the GDELT database.
Our analysis of the informational content brought about by these narratives on top of traditional macro models yields insightful results. Indeed, we showcase how these topical stories can improve models’ goodness of fit, in the spirit of raw GDELT metrics. We show that the roaring 20s has been a very constructive and popular economic narrative in the market rally since 2019. However, societal stories, either tied to the environment or social stress, as well as geopolitical risk were also shaping the trend in news. The spike in geopolitical risk at the time of writing is bringing back to the forefront the secular stagnation and the back to the 70s narratives. We observe a dichotomy, between narratives that we consider “constructive” with a priori positive sentiment – such as the roaring 20s and the environment – and the others that embody more of a risk dimension.
To conclude, narratives are powerful tools at the disposal of financial market participants to form their anticipation and constitute an integral component of informational content at their disposal to formulate investment decisions. In fact, we believe that narratives take their place in a more general theory of economic and financial phenomena. This theory integrates a fundamental referential of a psychological nature which structures memory, forgetfulness and duration, which allows the narratives to be structured (Blanqué, 2010). To gain an understanding of this phenomenon, short-term and long-term memories (and their associated forgetfulness) that are constructed on narratives should be disentangled, in the spirit of Zacks and Tversky (2001) or Kahneman (2011) for instance. On more practical aspects, portfolios could be designed to take advantage of decorrelated narratives, among or within economic, geopolitical risk or societal narratives. For instance, social and environmental narratives are by nature fairly distinct from economic narratives. Positions could be fine-tuned to gain exposure to constructive narratives, or instead to hedge a portfolio based on the ones that materialize risk. Measuring the impact of international events on the geopolitical risk narratives from different countries could also allow to judge the level of fragmentation. Last but not least, we emphasize that although narratives exist at the market level, they could also be captured at the stock level to understand which particular stories drive its return.
Ash, E., Gauthier, G., & Widmer, P. (2021). Text Semantics Capture Political and Economic Narratives. Available at SSRN 3970603.
Barra. (1998). Global Equity Model (GEM) Handbook. BarraOne.
Bemanke, B., & Harold, J. (1991). The Gold Standard, Deflation, and Financial Crisis in the Great Depression: An International Comparison. NBER Chapters, pp. 33–68.
Bernanke, B. S. (2004). The Great Moderation. Washington, DC.
Bernanke, B. S. (2015). Why are Interest Rates so Low, Part 2: Secular Stagnation. Available at The Brookings Institution Blog.
Blanqué, P. (2010). Money, Memory and Asset Prices. Economica.
Bollen, J., Mao, H., & Zeng, X. (2011). Twitter Mood Predicts the Stock Market. Journal of Computational Science, 2(1), pp. 1–8.
Caldara, D., & Iacoviello, M. (2018). Measuring Geopolitical Risk. FRB International Finance Discussion Paper, (1222).
Campbell, J. Y., & Shiller, R. J. (1998). Valuation Ratios and the Long-run Stock Market Outlook. Journal of Portfolio Management, 24(2), pp. 11–26.
Chen, N.-F., Roll, R., & Ross, S. A. (1986). Economic Forces and the Stock Market. Journal of Business, 59(3), pp. 383–403.
Clarida, R. H. (2021). Federal Reserve Independence: Foundations and Responsibilities: a Speech at the Federal Reserve Bank of Cleveland, Cleveland, Ohio, November 30, 2021 (tech. rep.).
Coibion, O., & Gorodnichenko, Y. (2011). Monetary Policy, Trend Inflation, and the Great Moderation: an Alternative Interpretation. American Economic Review, 101(1), pp. 341–370.
Consoli, S., Pezzoli, L. T., & Tosetti, E. (2021). Emotions in Macroeconomic News and their Impact on the European Bond Market. Journal of International Money and Finance, 118, pp. 102472.
Denev, A., & Amen, S. (2020). The Book of Alternative Data. Standards Information Network.
Eichengreen, B. (2010). Lessons from the Marshall Plan.
Eichengreen, B., & Mitchener, K. J. (2004). The Great Depression as a Credit Boom Gone Wrong. Research in economic history. Emerald Group Publishing Limited.
Fama, E. F. (1984). The Information in the Term Structure. Journal of Financial Economics, 13(4), pp. 509–528.
Fisher, I. (1933). The Debt-Deflation Theory of Great Depressions. Econometrica, pp. 337–357.
Fortes, R., & Le Guenedal, T. (2020). Tracking ECB’s Communication: Perspectives and Implications for Financial Markets. Available at SSRN 3791244.
Friedman, M., & Schwartz, A. J. (1963). A Monetary History of the United States, 1867–1960. NBER Books.
Giraud, Y. (2021). Review of “Narrative Economics: How Stories Go Viral & Drive Major Economic Events” by Robert J. Shiller.
Gordon, R. J., & Stock, J. H. (1998). Foundations of the Goldilocks Economy: Supply Shocks and the Time-varying NAIRU. Brookings papers on economic activity, 1998(2), pp. 297–346.
Hansen, A. H. (1939). Economic Progress and Declining Population Growth. American Economic Review, 29(1), pp. 1–15.
Joyce, M., Miles, D., Scott, A., & Vayanos, D. (2012). Quantitative Easing and Unconventional Monetary Policy – an Introduction. The Economic Journal, 122(564), pp. F271–F288.
Kahneman, D. (2011). Thinking, Fast and Slow. Macmillan.
Klement, J. (2021). Geo-Economics: The Interplay between Geopolitics, Economics, and Investments. CFA Institute Research Foundation.
Knot, K. (2015). The Role of Central Banks; the Netherlands Bank and Sustainable Finance. Opening speech by Mr Klaas Knot, President of the Netherlands Bank, at the Sustainable Finance Seminar, organized by the United Nations Environmental Program and the Sustainable Finance Lab, and hosted by the Netherlands Bank, Amsterdam, 27 November 2015.
Leetaru, K., & Schrodt, P. A. (2013). Gdelt: Global Data on Events, Location, and Tone, 1979–2012. ISA Annual Convention, 2(4), pp. 1–49.
Lepetit, F., Le Guenedal, T., Ben Slimane, M., Cherief, A., Mortier, V., Sekine, T., & Stagnol, L. (2021). The Recent Performance of ESG Investing, the Covid-19 Catalyst and the Biden Effect. Available at SSRN 3946483.
Lopez, D. A. (2012). The Great Inflation: a Historical Overview and Lessons Learned. Page One Economics Newsletter, (Oct), pp. 1–4.
Lundberg, S. M., & Lee, S.-I. (2017). A Unified Approach to Interpreting Model Predictions. Advances in Neural Information Processing Systems 30 (NIPS 2017), pp. 4768–4777.
Nassirtoussi, A. K., Aghabozorgi, S., Wah, T. Y., & Ngo, D. C. L. (2014). Text Mining for Market Prediction: A Systematic Review. Expert Systems with Applications, 41(16), pp. 7653–7670.
Olteanu, A., Castillo, C., Diaz, F., & Vieweg, S. (2014). Crisislex: A Lexicon for Collecting and Filtering Microblogged Communications in Crises. Eighth international AAAI conference on weblogs and social media.
Powell. (2021). Powell Says Economy Making Real Progress, But Not for Everyone. https://www.bloomberg.com/news/articles/2021-05-03/powell-says-economy-making-real-progress-but-disparities-weigh
Rogoff, K. (2003). Globalization and Global Disinflation. Economic Review-Federal Reserve Bank of Kansas City, 88(4), pp. 45–80.
Romer, C. D. (1992). What Ended the Great Depression? The Journal of Economic History, 52(4), pp. 757–784.
Roos, M., & Reccius, M. (2021). Narratives in Economics. Available at arXiv: 2109.02331.
Rosenberg, B. (1974). Extra-market Components of Covariance in Security Returns. Journal of Financial and Quantitative Analysis, 9(2), pp. 263–274.
Schnabel, I. (2021). Keynote Speech by Isabel Schnabel, Member of the Executive Board of the ECB. VIII. New Paradigm Workshop, organised by the Forum New Economy.
Schwartz, H. M. (2021). Global Secular Stagnation and the Rise of Intellectual Property Monopoly. Review of International Political Economy, pp. 1–26.
Semet, R., Roncalli, T., & Stagnol, L. (2021). ESG and Sovereign Risk: What is Priced in by the Bond Market and Credit Rating Agencies? Available at SSRN 3940945.
Shapley, L. (1953). The Value of N-Person Games. Annals of Mathematical Studies, 28, pp. 307–317.
Shiller, R. J. (2000). Irrational Exuberance. Philosophy and Public Policy Quarterly, 20(1), pp. 18–23.
Shiller, R. J. (2017). Narrative Economics. American Economic Review, 107(4), pp. 967–1004.
Shiller, R. J. (2020a). Narrative Economics: How Stories Go Viral and Drive Major Economic Events. Princeton University Press.
Shiller, R. J. (2020b). Popular Economic Narratives Advancing the Longest U.S. Expansion 2009–2019 [SI: Growth and Trade in the United States and Europe]. Journal of Policy Modeling, 42(4), pp. 791–798.
Smart, G. (1999). Storytelling in a Central Bank: The Role of Narrative in the Creation and Use of Specialized Economic Knowledge. Journal of Business and Technical Communication, 13(3), pp. 249–273.
Summers, L. H. (2015). Have we Entered an Age of Secular Stagnation? IMF Fourteenth Annual Research Conference in Honor of Stanley Fischer, Washington, DC. IMF Economic Review, 63(1), pp. 277–280.
Temnikova, I. P., Castillo, C., & Vieweg, S. (2015). EMTerms 1.0: A Terminological Resource for Crisis Tweets. Proceedings of the 12th International Conference on Information Systems for Crisis Response and Management (ISCRAM).
Tilly, S., Ebner, M., & Livan, G. (2021). Macroeconomic Forecasting Through News, Emotions and Narrative. Expert Systems with Applications, 175, pp. 114760.
World Economic Forum. (2022). Global Risk Report 2022.
Yellen, J. L. (2015). Inflation Dynamics and Monetary Policy. Speech at the Philip Gamble Memorial Lecture, University of Massachusetts, Amherst Available at FED website.
Zacks, J. M., & Tversky, B. (2001). Event Structure in Perception and Conception. Psychological Bulletin, 127(1), pp. 3–21.
A.1 Algorithms and Informational Content
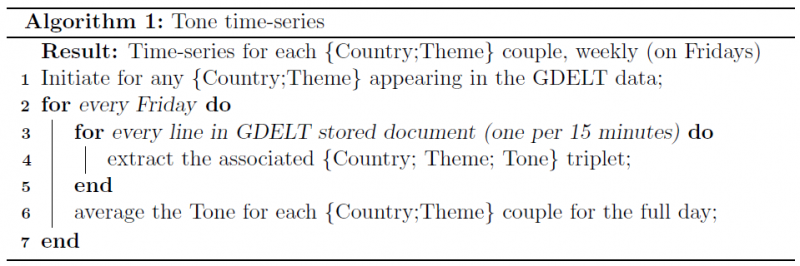
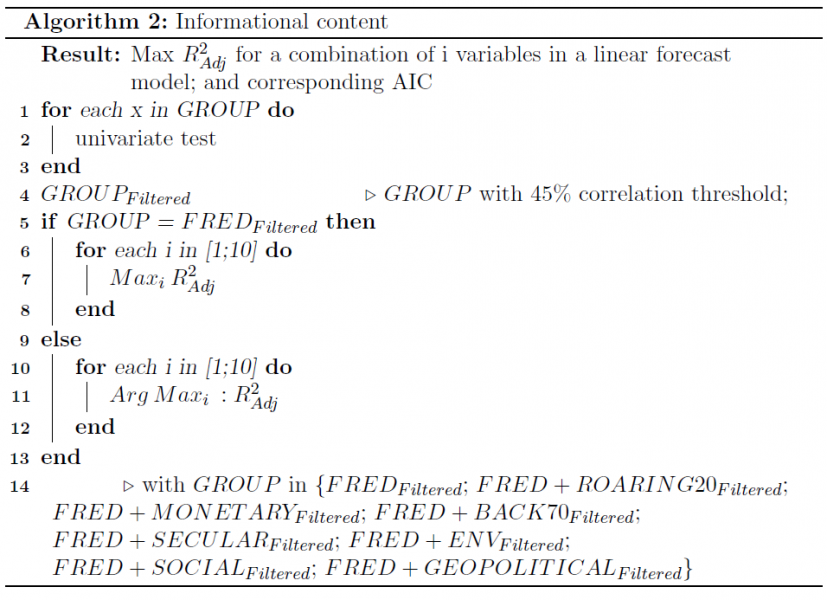
Figure 14: Machine Learning Process
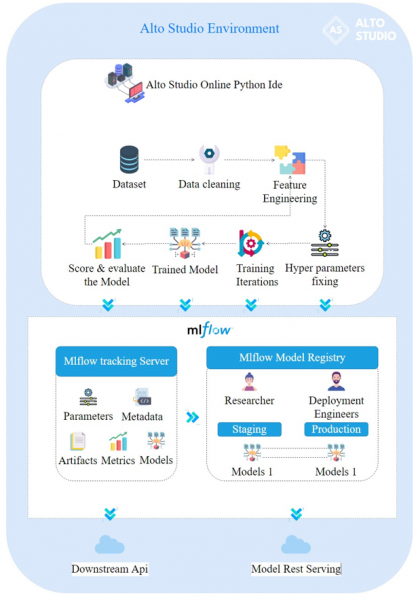
Source: Amundi Institute.
Figure 15: Informational Content Associated with Top 3 Narratives
Source: Amundi Institute. Authors’ calculations
A.2 Definition of Narratives
Table 6: Roaring 20s – GDELT Selected Identifiers with United-States Filter
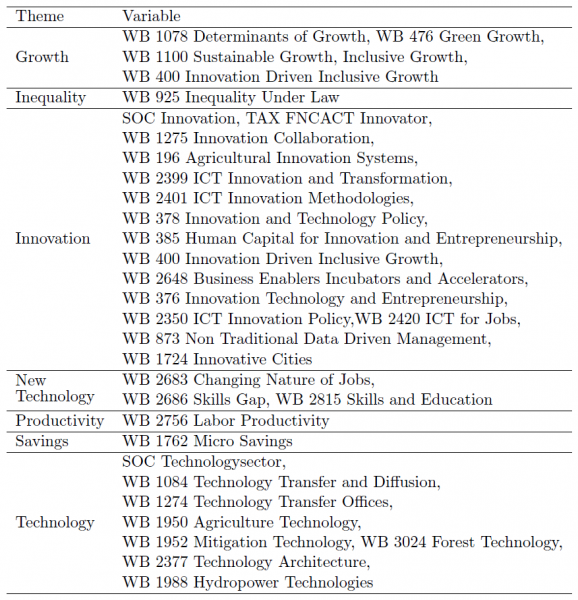
Table 7: Back to the 70s – GDELT Selected Identifiers with United-States Filter
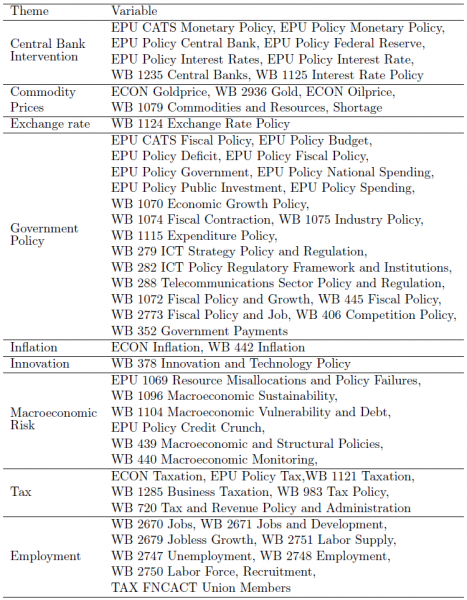
Table 8: Secular Stagnation – GDELT Selected Identifiers with United-States Filter
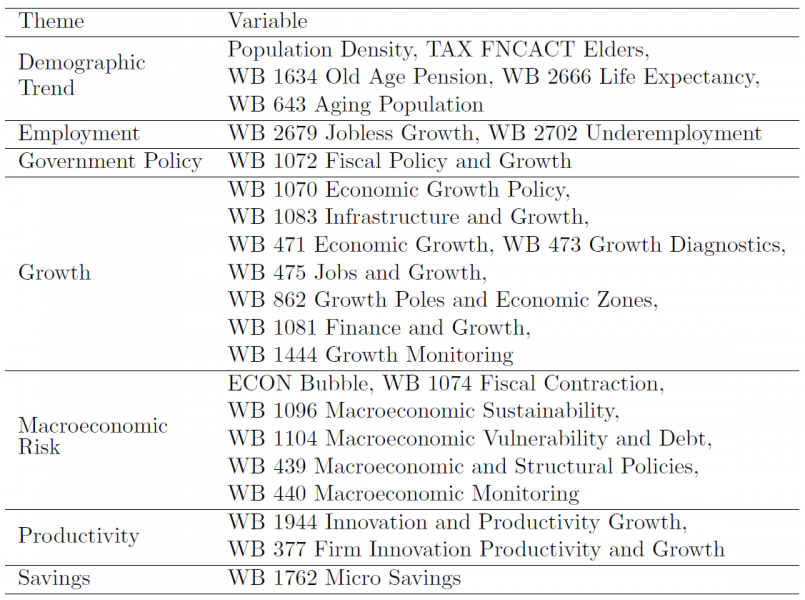
Table 9: Monetary – GDELT Selected Identifiers with United-States filter
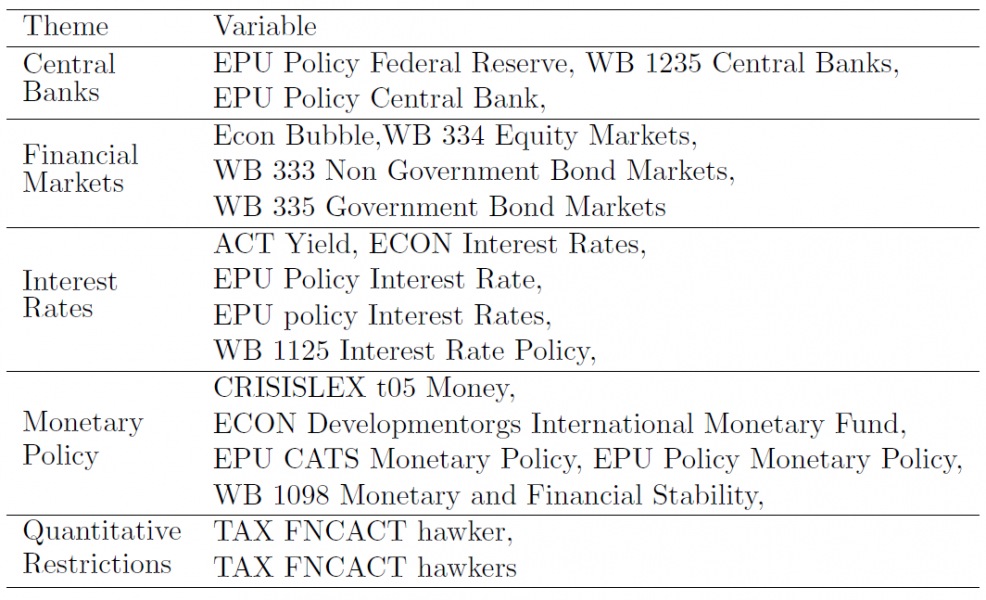
Table 10: Environment – GDELT Selected Identifiers with United-States filter
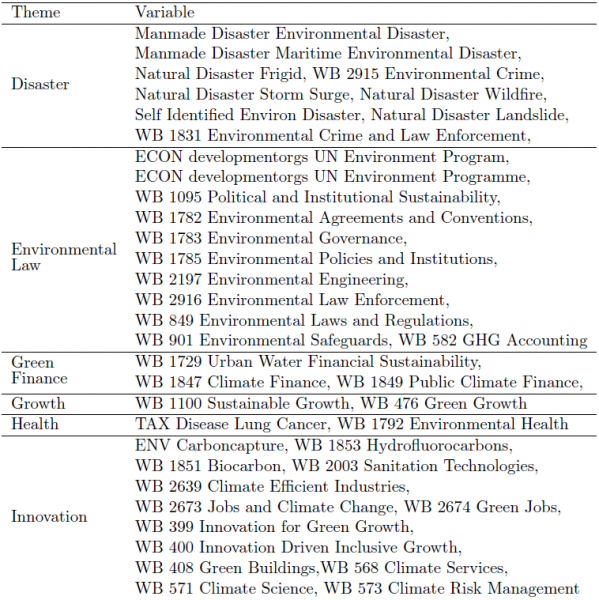
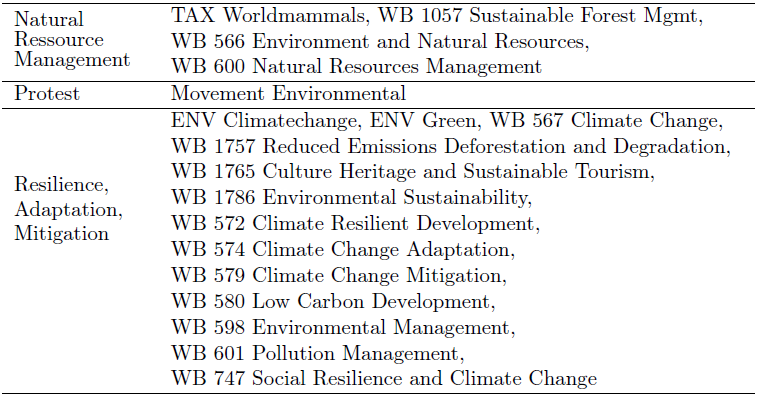
Table 11: Social – GDELT Selected Identifiers with United-States filter
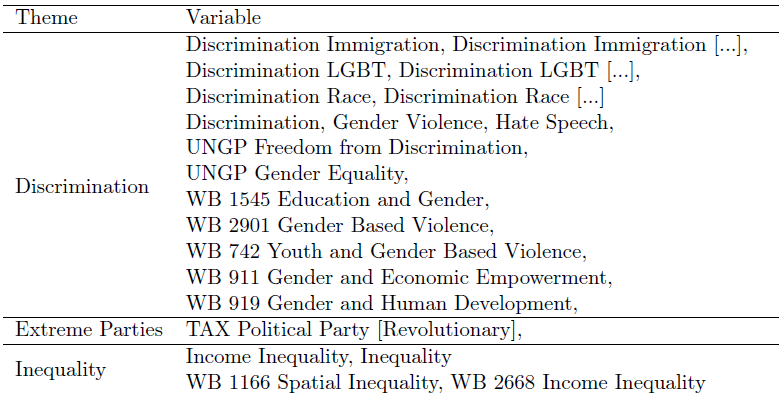
Notes: For variables denoted […] we actually retrieve all the variables with at least one count over the period of analysis that begins with the same prefix. For instance, there are many groups under the prefix Discrimination Immigration, such as Discrimination Immigration Attacks on Immigrants or Discrimination Immigration Xenophobia. For extreme parties, we selected those whose labels contained the term “revolutionary”.
Table 12: Geopolitical Risk – GDELT Selected Identifiers with United-States filter
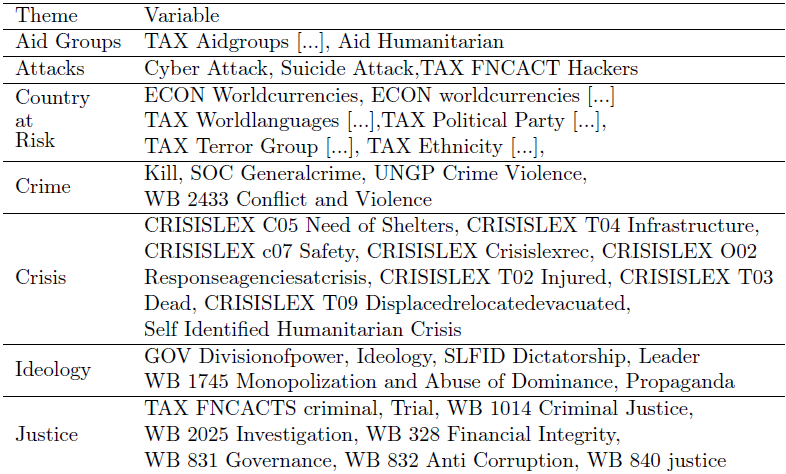
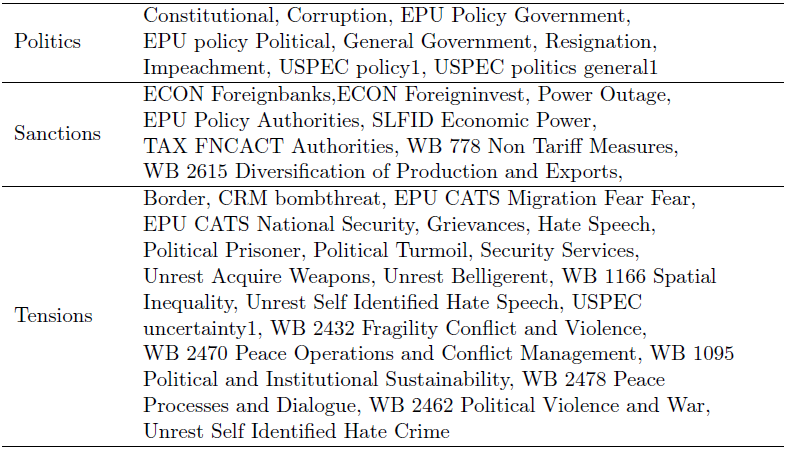
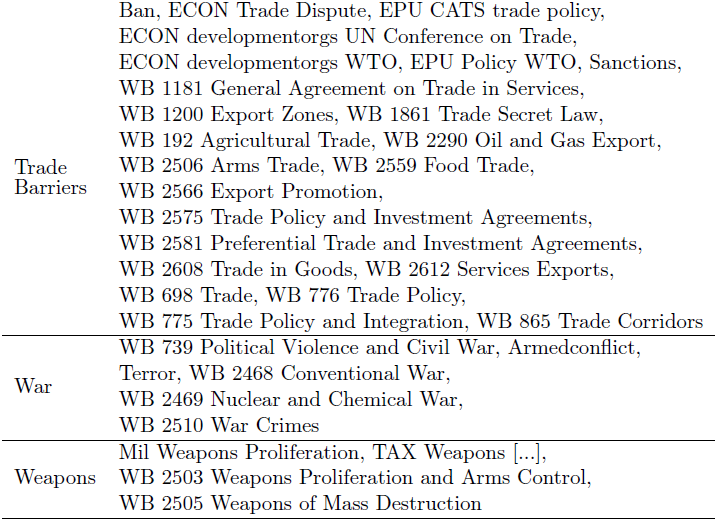
Notes: For the TAX Aidgroups variables denoted […] we actually retrieve all the metrics with at least one count over the period of analysis that begins with the same prefix. For instance, there are many groups under the prefix TAX Aidgroups, such as TAX Aidgroups Amnesty International or TAX Aidgroups Red Cross. Similarly, for Weapons, we selected all the different types, ranging for instance from TAX Weapons Landmines to TAX Weapons Surface to Air Missile. For the country at risk, we retrieve the top 20 countries that are assimilated to “ennemies” in a survey available at https://today.yougov.com/topics/politics/articles-reports/2017/02/02/americas-friends-and-enemies. For each of these countries, we retrieve metrics related to the national language, political party, terror group, ethnicity and currency when available.
The authors are very grateful to Monica Defend, Lorenzo Portelli, Vincent Mortier and Thierry Roncalli from Amundi; Jeremy Jouvance and Florian Vincent from Amundi Technology; Roberta Fortes from University of Paris 1 Panthéon-Sorbonne and Sonja Tilly from University College London for their helpful comments.
Robert Shiller has inspired generations of financial professionals. His analysis on irrational exuberance (Shiller, 2000) was included in the curriculum of the CFA Charter in the early 2000s. In 2000 the first edition was published on the timing of the dot-com bubble burst. The second edition which included an update on the housing bubble was published in 2005 ahead of the subprime mortgage crisis and the start of the GFC.
Available at https://www.gdeltproject.org/.
http://data.gdeltproject.org/documentation/CAMEO.Manual.1.1b3.pdf.
This is the average “tone” of all documents containing one or more mentions of this event. The score ranges from -100 (extremely negative) to +100 (extremely positive). Common values range between -10 and +10, with 0 indicating neutral sentiment. This can be used as a filtering method for the “context” of events as a subtle measure of the importance of an event and as a proxy for the “impact” of that event. For example, a riot event with a slightly negative average tone is likely to reflect a minor occurrence, whereas an extremely negative average tone may instead suggest a wider scope, at the national level for instance.