Vaccination against the COVID-19 virus began in December 2020 in the UK and by the end of March 2021 were running at 5% population/week. High Levels of social restrictions were implemented for the third time in January 2021 to control the second wave and the resulting in increases in hospitalisations and deaths. Easing those restrictions must balance multiple priorities, weighing the risk of more deaths and hospitalisations against damage done to mental health, incomes and standards of living, education and provision of non-Covid-19 healthcare.
This study uses weekly and monthly reported data from 2020 and 2021 to estimate the impact of seasonality and social restrictions on the spread of the virus, on the economy and overall healthcare services. We use an SIR model to estimate how the virus spreads. This takes account of the impact of the vaccination program and suitably calibrated it tracks the historic growth trends in reported deaths closely. The model is used to evaluate the consequences of different speeds of easing social restrictions.
The results show vaccinations are significantly reducing the number of hospitalisations and deaths. The central estimate is that relative to rapid easing (essentially just leaving in place from now on guidance on sensible behaviour – wash hands, weak masks, avoid crowded indoor spaces) the avoided loss of life-years from a strategy of relatively slow easing over the next 4 months comes at a cost in terms of GDP reduction of around £0.4 million/life-year loss avoided. This is over 10 times higher than the usual limit the NHS uses for spending against Quality Adjusted Life Years (QALYs) saved.
Alternative assumptions for key factors affecting the spread of the virus give significantly different trade-offs between costs and benefits of different speeds of easing. But in most cases the results favour a somewhat faster easing of restrictions in England than current policy implies, at least if one uses valuation metrics commonly used for other government decisions.
The SARS-CoV-2 (Covid-19) virus has impacted all aspects of life in the UK, as elsewhere in the world. The number of reported cases of related hospitalisations and deaths rose rapidly once again at the end of 2020 across England and then fell rapidly through February 2021. By the end of March 2021 vaccines against the virus have been administered to around 30 million people across the UK; the rollout of the vaccines looked likely to proceed rapidly through the Spring and beyond. It is likely that the extensive restrictions on travel and social interactions introduced at the end of 2020, and extended further early in 2021, have been the major factor behind the substantial decline in the rate at which the virus was spreading. As those who have recently been vaccinated gain some immunity, and as new doses are administered to more people, the rollout of the vaccine will play an increasing role in driving down the R number – the key factor behind the spread of the virus.
How fast restrictions should be eased as vaccinations bear down on the spread of Covid-19 is a critical policy issue. It should depend on how the risks of infections, hospitalisations and deaths are affected by easing restrictions – given the pace of vaccinations and their likely effectiveness. However, assessing how many more people might be infected and suffer serious illness if restrictions are eased sooner rather than later cannot be the only factor that is relevant to policy. The great benefits that severe restrictions bring is in reducing illness and deaths from the virus; but restrictions bring costs and it is clear they are very large: the disruption to education will negatively affect millions of young people for many years; the mental health and other distress that isolation brings for people forced to stay home is likely to be significant now and into the future; the number of businesses that will shed employees will rise the longer severe restrictions are kept in place and the unemployment this will cause will do significant harm to those who lose their jobs and struggle to find new ones.
Assessing the impact that easing restrictions at different rates might have on the spread of the virus, hospitalisations and deaths is essential to the policy decision. But it cannot, in itself, answer the policy questions because that should also depend upon the costs of keeping restrictions in place. If all that mattered was the likely path of new infections, hospitalisations and deaths then maximum caution would be the right policy. But maximum caution comes at a high price. The damage to the wellbeing of the population from keeping restrictions in place needs to be weighed against the damage from more Covid-19 related illness that an easing of restrictions may bring. So while the sort of exercise which focuses solely on the spread of the virus and its sensitivity to restrictions is invaluable (for example the 2021 SAGE report of Whittles et al (1)), it cannot answer the urgent policy question.
This paper tries to bring an assessment of the costs and benefits of different strategies for easing restrictions together to inform that urgent policy question. Using an SIR model which takes account of vaccinations, seasonal factors and the impact of restrictions, it simulates the impact upon infection rates and deaths from different strategies for easing restrictions in England and sets those alongside an assessment of the costs of different strategies. The SIR model makes the spread of the virus depend upon the interactions between those infected and the susceptible population. Interactions are greater the more people are infected and the larger is the population of those susceptible. The key factor behind the growth of the virus is the R number that is implied by an SIR model – the number that will become infected (on average) by those currently infected. This can be reduced by restricting interaction (either through voluntary actions or through government restrictions); it is also reduced if vaccinations (as well as some immunity built up from those recovered from past infection) effectively reduce the susceptible population. But restrictions bring costs.
Our strategy is to compare different speeds of easing restrictions measured against the yardstick of a scenario in which restrictions (beyond general advice to wear masks, wash hands, avoid being in crowded indoor spaces) are removed immediately. In each case we estimate likely economic costs and Covid deaths of each strategy relative to the base of removing restrictions straight away. This allows us to assess the trade-offs that might be faced by slower or faster easing of rules.
We first consider the costs of different levels of restrictions. We then set out the way we have calibrated the SIR model – and more specifically the R number – allowing for the impact of varying restrictions on possible paths for infections and deaths. Finally, we bring together an assessment of the costs and benefits of different scenarios for easing restrictions.
The costs of restrictions imposed to control the spread of the virus are not easy to measure accurately. Many of those costs are likely to arise in the future – the damage done to the life chances of young people whose education has been disrupted will be incurred over long periods stretching far into the future. The Institute for Fiscal Studies has estimated that this cost (assessed as the hit to the present value of cumulative future earnings) may already run to something like £350 billion (2); nearly all of that lies ahead of us. Businesses that will not be able to re-open after the pandemic has past will create unemployment that is being masked by government schemes that have stopped unemployment from rising significantly now. Research by Peter Lambert and John Van Reenan of the London School of Economics (3) suggests that around nine hundred thousand firms – mainly smaller businesses that employ around 2.5 million people – were at significant risk of not being viable by mid-2021. The extent to which that risk crystallizes will depend on how and when restrictions are eased. The damage that unemployment and disrupted education brings goes beyond the lower incomes (lost GDP) now and into the future – the damage to the physical and mental health of reduced employment chances is imperfectly reflected by a calculation of lost aggregate output. Work by Carol Propper of Imperial College suggests that the rise in unemployment in the UK that came in the wake of the global financial crisis of 2007-08 increased the number of people in the UK with chronic health problems by around 900,000 (4). It is plausible that the rise in unemployment that comes about as a result of Covid-19, and the restrictions imposed to deal with it, may be of the same order of magnitude. Much of this damage to the welfare of people would have occurred even without any government restrictions. It is only that part of the costs of the pandemic that came from restrictions that should be weighed up against the benefits that such restrictions bring.
Thus, there are two formidable measurement issues that arise in assessing what costs come from restrictions – first what are the scale of the many different costs, which spread far into the future, from the virus (over and above the direct costs to the health of those infected) and, second, how much of those costs are due to government restrictions and how many would have arisen even without such restrictions because of voluntary changes in behaviour from a cautious public.
Our strategy is to take a very narrow definition of costs, simply focusing on the value of total incomes (that is Gross Domestic Product (GDP)) lost as a result of government restrictions during the months when they were in place. This will generate an estimate of the damage that is likely to substantially underestimate long-run costs. It would only be a central estimate of economic costs if the impact of restrictions is only felt while they are in place and that once they are lifted economic activity returns to its pre-pandemic path. Recent Office for Budget Responsibility (OBR) estimates suggest that the economic damage from Covid-19, and restrictions taken to counter its effects, will last for many years; they suggest incomes will be 3% lower even in the long term.
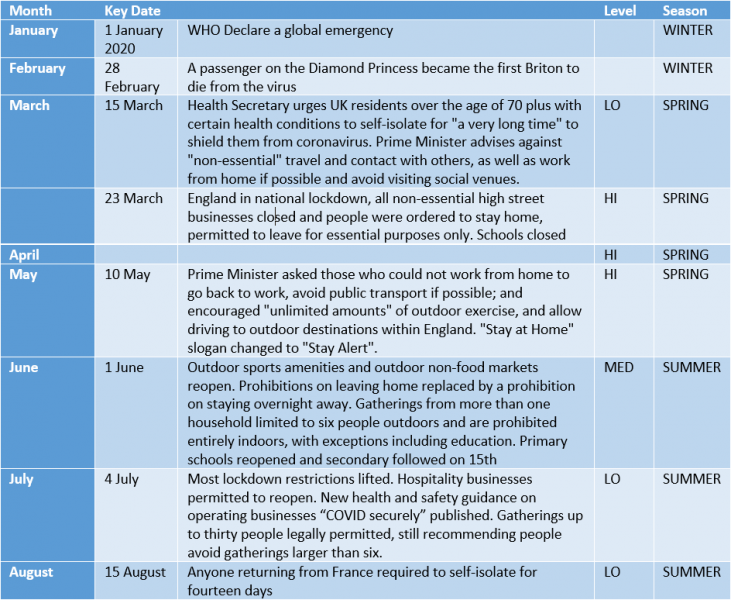
UK GDP fell dramatically below its pre-pandemic levels in the months during which a high level of government restrictions were in place after they were introduced in the second half of March of 2020. (See the appendix for details of when restrictions were introduced and relaxed). The highest level of restrictions remained largely in place until early June 2020. During the whole of April and May of 2020 severe restrictions were in place when the message from the government was clear – ‘stay at home’. During those months GDP was around 22% lower than in the corresponding months of 2019.
Restrictions were eased significantly between June and August of 2020. Over those three months, GDP recovered so that on average it was around 10% below the levels of the corresponding months of 2019.
By early Autumn of 2020, at which point restrictions had been relaxed to a level as low as they were to reach in 2020, GDP was around 6% lower than for the same months of 2019. The tightening in restrictions that came at the end of 2020 had yet to have its full impact on UK GDP by December 2020 and it seems likely that output in the first quarter of 2021 was significantly further below the pre-pandemic level than in the Autumn of 2020.
It would be a very substantial overestimate of the immediate GDP cost of restrictions to attribute all these falls in UK incomes to government restrictions. It is clear that fear of the virus would have caused the majority of people, and businesses, to change behaviour even had the government not imposed restrictions. But there is a good deal of evidence that government restrictions will have reduced economic activity to a much greater extent than if people had been left to make their own decisions. The International Monetary Fund (IMF) has recently summarised the extensive evidence from many countries on the relative impacts of government restrictions and of individual cautiousness in accounting for declines in economic activity. In chapter 2 of the October 2020 World Economic Outlook the results of IMF analysis are summarised thus:
“…..countries that endured more stringent lockdowns experienced larger growth declines relative to pre–COVID-19 forecasts, even after controlling for the severity of the local epidemic. The chapter then assesses the impact of lockdowns using high-frequency proxies for economic activity, namely mobility indicators provided by Google and job postings provided by the website Indeed. Regression results show that lockdowns have a considerable negative effect on economic activity. Nonetheless, voluntary social distancing in response to rising COVID-19 infections can also have strong detrimental effects on the economy. The analysis suggests that lockdowns and voluntary social distancing played a near comparable role in driving the economic recession”
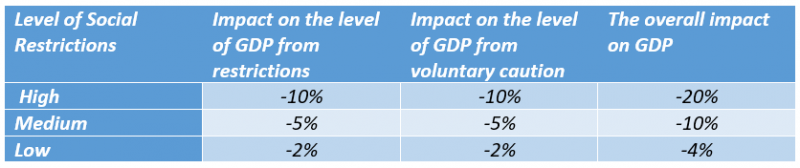
IMF research suggests that just under one half of the ‘hit’ to economic activity might have come about as a result of government restrictions rather than voluntary social distancing. Applying that evidence, along with the record on what happened to GDP in the UK, we use the following assumptions for the effect of restrictions on immediate levels of GDP:
Table 1. GDP impact of different levels of social restriction
We stress again that in only taking the immediate hit to GDP from restrictions we are taking a narrow measure of their costs and erring on the side of underestimating their harm. We make no allowance for the indirect harm to health and welfare that restrictions may have created. It is clear that the response to the pandemic has disrupted the provision of non-Covid general healthcare and those costs may last for many years. For example:
But there are some benefits of restrictions that we also do not take account of – pollution levels seem to have been lower during the periods of greatest restrictions on travel; cleaner air will have created health benefits. GDP lost is a crude proxy for immediate economic costs of restrictions and greater home production of many goods will mean that the true value of productive activity will have fallen less than market values of transactions that GDP mostly comprise. For some of those not working during lockdowns the greater leisure will have value – though probably less than leisure taken when restrictions were lower. One potentially significant long-term side effect of restrictions is that it has forced companies and their employees to experiment with alternative methods of working, of producing and of selling goods. Greater flexibility about working from home may be one positive side effect of Covid restrictions. We have not allowed for such benefits.
The effective R number is the key to how the virus spreads. It tells us how many new infections will be generated by the current group who are infected (I). An SIR model makes the effective R value at a point in time reflect the numbers susceptible (S) as a share of the population and the interactions between them and the infected.
We take account of a wide range of factors influencing the rate at which new infections occur and the health costs associated with them. Restrictions and a degree of natural caution (voluntary social distancing) have a significant effect on the rate at which the virus spreads and both bear down on the average number of new infections created by a single infected individual (the effective R number). Accumulated immunity – coming both from past infections and from vaccinations – reduces the susceptible population and brings down the R number. Vaccine rollout is likely to play a major role in determining the course of the virus in the future. Seasonal factors appear to play some role.
Our model is essentially one which makes assumptions about how this R value is impacted by restrictions and by seasonal factors. It accounts for the reduction in the effective R number as immunity builds up from vaccinations and from any immunity the recovered have. We do this by keeping track of the numbers vaccinated and recovered from being infected. We draw a distinction between the R number which would exist at a point in time if there was no immunity (R0) and then calculate the effective R number by scaling that downwards to the extent that immunity makes the effective susceptible population lower than the current non-infected population.
Restrictions reduce R by decreasing interactions between the infected and the susceptible. Easing restrictions will tend to increase R.
The easing of restrictions in the UK was considered at the Eightieth SAGE meeting on COVID-19, 11 February 2021 (9) and described in the report on modelling scenarios for the easing of restrictions, (10). This drew heavily on work undertaken at Imperial College and Warwick University. These reports suggest that a rapid easing would bring on a 3rd wave of the virus causing in the worst case an estimated further 170,000 deaths on the basis that the R-value (excluding the effects of some immunity having built-up) would rise to 3 or even 4. Those values are plausible levels for R at the beginning of 2020 when the virus arrived in the UK but before anyone was aware of risks. It seems, however, unlikely that even if government restrictions were eased quickly the R-value (excluding immunity) would return to such levels. People are unlikely to believe all risk is gone when they would be reminded every day of new infections and deaths.
As we describe below we use a somewhat lower estimate of what R will become when government restrictions are eased. We also factor in the impact of vaccinations and seasonality which already have played some role in the path of the virus. We allow for both factors to influence how the R number evolves in the scenarios for easing restrictions.
The UK was the first country to approve vaccines for use in the general population and began on 8 December 2020, shortly after the British regulator, the Medicines and Healthcare products Regulatory Agency (MHRA), granted emergency authorisation to Pfizer–BioNTech vaccine. The Oxford–AstraZeneca vaccinations began on 4 January 2021 shortly after approval; the Moderna vaccine was approved on 8 January 2021. There are other COVID-19 vaccines at varying stages of development. Most of these require 2 rounds of vaccination to achieve maximum effectiveness. Since February, an average of around 2.4 million vaccinations are being given each week in England.
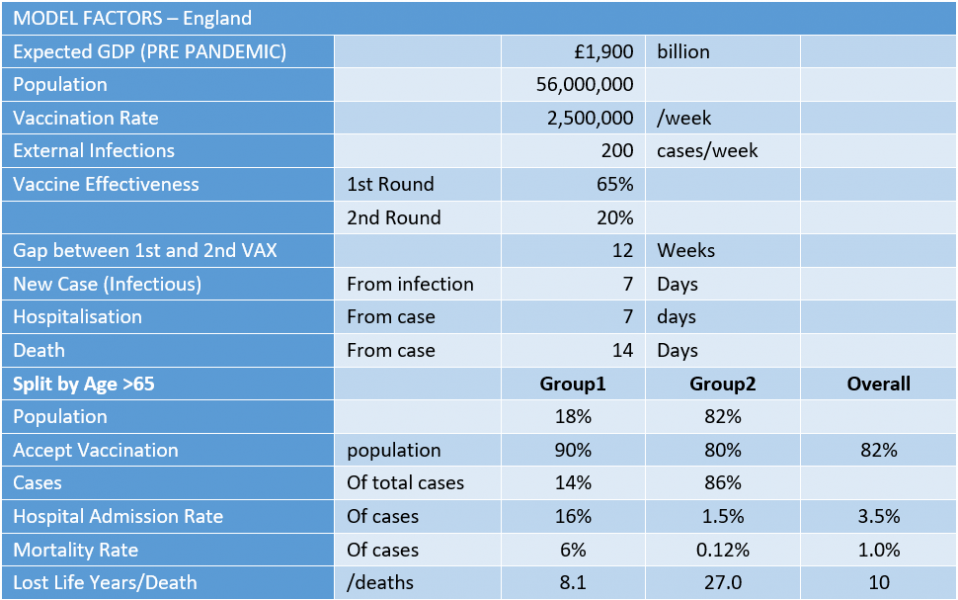
Our base assumption is that vaccines affect both the probability of onward transmission and the chances of avoiding serious morbidity equally. We assume that the first dose gives a 65% reduction in both risks with a further smaller reduction of 20% at the second dose. This is somewhat lower than some estimates of vaccine effectiveness (see, for example, 11); but it looks a plausible central estimate based on Table 4 in (1).
Overall, uptake of the COVID-19 vaccination programme has exceeded expectations, with 93% uptake in those over 75 years of age (12). The base model we use for simulations sets uptake at 90% for Group 1 (aged over 65) and 80% for group 2 (aged under 65).
The last 12 months of infections with the SARS-CoV-2 virus have shown month by month patterns seen in seasonal respiratory viruses; poor outcome risks are higher in the older and less well and fluctuation in infection rates appears significantly related to the season. Pathogen Seasonality presents as a variation in pathogens’ effective reproductive number, which reflects the pathogen persistence, contact patterns or host susceptibility. Physical factors generally considered to affect virus persistence are temperature, humidity, and sunlight (13). The Ultraviolet (UV) sensitivity of coronaviruses and SARS-CoV-2 indicates that a proportion of the SARS-CoV-2 virus might be inactivated after being exposed to sunlight during summer in most world cities.
We assume that risks of hospitalisation and death for the newly infected depend on age, using fairly crude compartmentalisation into those at high risk of serious illness and death (age over 65) and those at relatively low risk (age under 65).
In the next section we describe how we parameterised the impact of various factors on the R number and then and assess their plausibility by how well they account for the past evidence on the course of the pandemic in the UK.
Our strategy is to take government data on the effective R number over time and from that make plausible estimates of how it has varied with the impact of seasonality and restrictions. We make use of government estimates of current effective R-values, published weekly from 27th May 2020 (14). We used these estimates and scaled up to an R0 equivalent – that is the R number were all people to have been susceptible. The transition between R0 and effective R values is made by adjusting for the percentage of the population remaining susceptible; the effective R number is R0 multiplied by the proportion of the population that is susceptible i.e. the total population minus those vaccinated (adjusted by the assumed effectiveness of vaccination) and minus those with an assumed immunity from past infections. The estimated level of immunity we use is based on government estimates reported by the ONS (15).
We divided the year into 4 three-month seasons that correspond to the normal periods where there are broadly similar environmental and social characteristics including expected holidays, school closures etc. These were SUMMER (June, July and August), AUTUMN (September, October, and November), WINTER (December, January, and February) and SPRING (March, April, and May). A twelve-month scale was considered but there was insufficient evidence to quantify changes at that level of granularity. Historic R-value data was available for summer, autumn and winter of 2020; data for Spring 2020 was less reliable.
A wide range of social restrictions has been mandated over the period and these will have had varying effects on R. A simple three-level classification of government social restrictions (Low (LO), Medium (MED), High (HI)) was used. The exact nature of restrictions within these classes might vary – Appendix 1 shows how we have allocated periods since February 2020 to the three classifications based on the nature and extent of restrictions (in terms of any additional school closures, restrictions in retail, hospitality, leisure, sport, travel and personal social restrictions). LO is considered as a new normal even after easing of legal restrictions is complete as guidance on maintaining social distancing, wearing of masks and working from home are expected to continue into the medium term.
We allocated an R0 value to each of the 12 level variants of Seasonality and Social Restriction based on the historical evidence, and where not available interpolation across the missing elements. Figure 1 shows the values we are trying to match for the R number – the mid point of the range for each week is the central government estimate for what the effective R number was at that time. (Table 2 below shows what we set the R(0) number to be for each season and for each level of restriction).
We model the disease cycle time so that the number infected each week depends on the R number multiplied by the number who were infectious in the previous week. We assume all people who have not been vaccinated or infected in the past are equally likely to become infected and have the same propensity to pass on the virus (including those under 16 years of age). We have used a lag of 7 days between the period when someone becomes infectious and their infecting another person. The World Health Organisation put the peak infection point at 6 days after infection. The UK government self-isolation policy implies that after 10 days of being initially infected there remains a low risk of further infectiousness. The SAGE advisory group use a central estimate of 4.6 days latency for those infected and a 2.1 day further period for the asymptomatic and 4.0 days for the symptomatic; this seems to imply a period of being infectious of between 6.7 – 8.6 days after infection.
We take the 7-day infectiousness period as our base case but also consider the possibility of a 14-day infectiousness period.
We assume that some proportion of those who are infected are hospitalised, and that happens one week after they show symptoms. We assume that those who die with the virus do so two weeks after they are infectious and become ill. SAGE papers suggest an average lag between the onset of serious illness and death of 5 days (for those not hospitalised) and 10 days (for those hospitalised). Our 7-day figure is around the average of those figures.
We also allow for infections coming from the rest of the world into the UK. We assume a fixed number of new infections arrive each week (independent of local levels of the infection); we chose that fixed arrival rate to match the model prediction against recorded levels of infections and deaths in 2020. We set the number of imported infections at 200 a week.
The model predictions can be compared with data on how the virus seems to have spread in England and the deaths that it may have caused. The government reports data daily on numbers of people admitted to hospital who tested positive for COVID-19 in the 14 days before admission, and those who tested positive in hospital after admission. These aggregate figures are reported daily for England (17), along with their age profile.
The total number of deaths of people who had had a positive test result for COVID-19 and died within 28 days of the first positive test reported are also recorded daily along with their age profile (18).
The data may overstate the true number where COVID was the underlying cause of hospitalisation or death. The monthly excess deaths as published by the ONS (19) show a significant shortfall between the number of non-Covid deaths registered and the average for the previous 5 years.
Figure 1 shows the published ranges for the effective R rate from May 2020 to Jan 2021. The mid-point of that range is shown within each range by a tick. At each point, we take the data on estimated immunity and use that to adjust the mid-point of the range upwards to get an R0 value. The colour of each of those points (or blobs) reflects our assessment of the level of restrictions in place at that time. In July and August 2020, after the ending of most social restrictions in June 2020 (and which we classify as restriction level LO), our central estimate of the base R Values (R0) remained just below 1; in May and June, with some moderate restrictions (which we classify as MED) the central estimate of the R-value was around 0.8.
There are no government estimates yet for the R values provided for the key spring months Mar-April-May (either for 2020 or yet for 2021). Autumn and winter R estimated values are available. A reasonable assumption is that in the spring months R values would lie between winter and summer values.
Based on the data in Figure 1 we assume that the way in which the R0 value has varied with restrictions and with the season is as shown in Table 2.
Figure 1. Weekly published R values range with the midpoint uplifted for the current level of immunity to generate R0.
Colours of blobs show estimated levels of social restrictions; Figures alongside the monthly Blobs are the R0 estimates to 1 decimal place
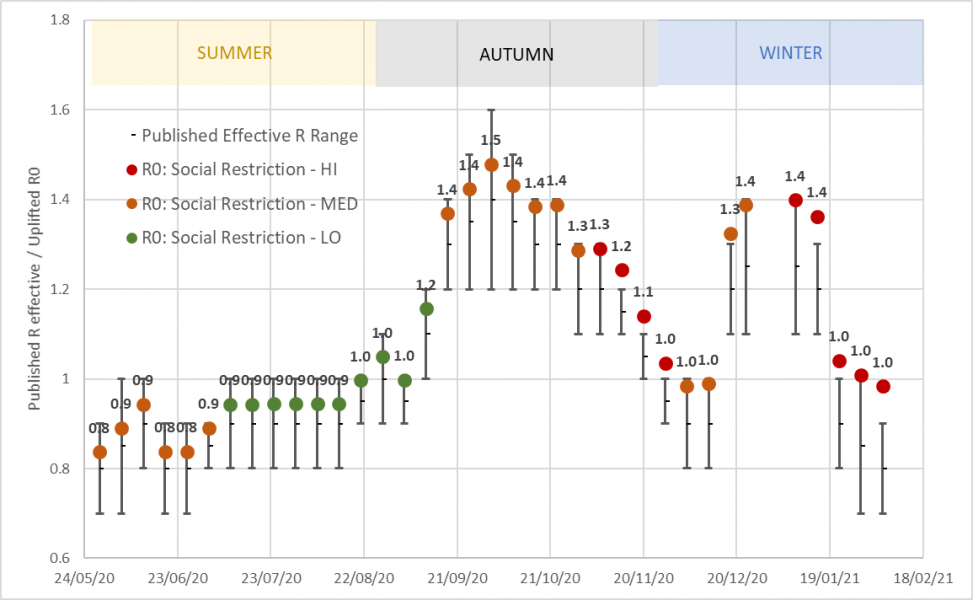
Table 2. Central estimate for base reproduction value (excluding increased immunity) used in model
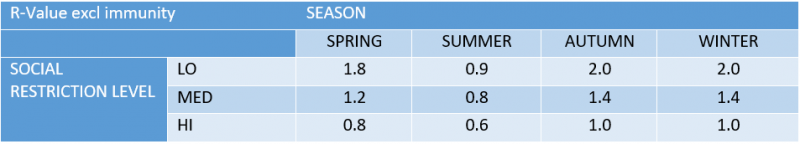
Figure 2 illustrates the large variation in mortality risk level associated with age; the oldest 18% of the population accounted for 14% of the cases but 90% of the deaths, a 50 fold higher case fatality risk compared to the other group with 82% of the population and 10% of the deaths.
Appendix 2 shows all the model parameters we use for simulations. Using the parameters set out in Table 2 we ran the model through 2020 comparing results with actual recorded data.
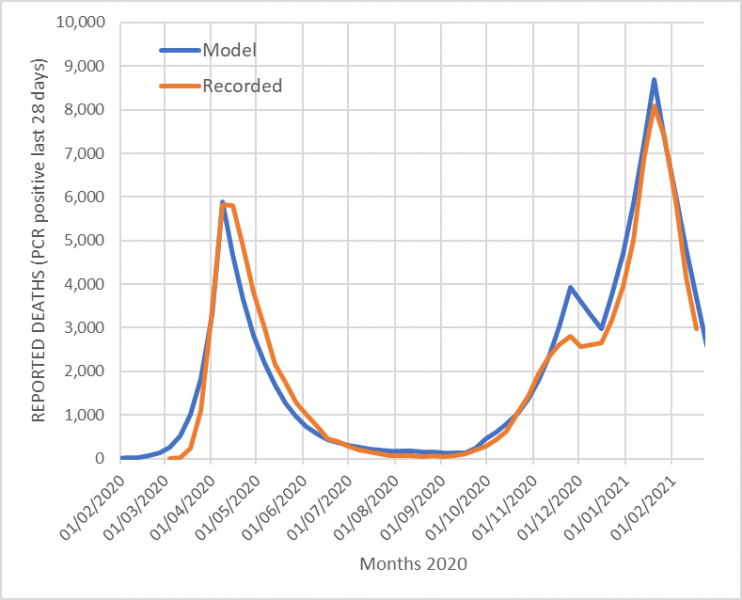
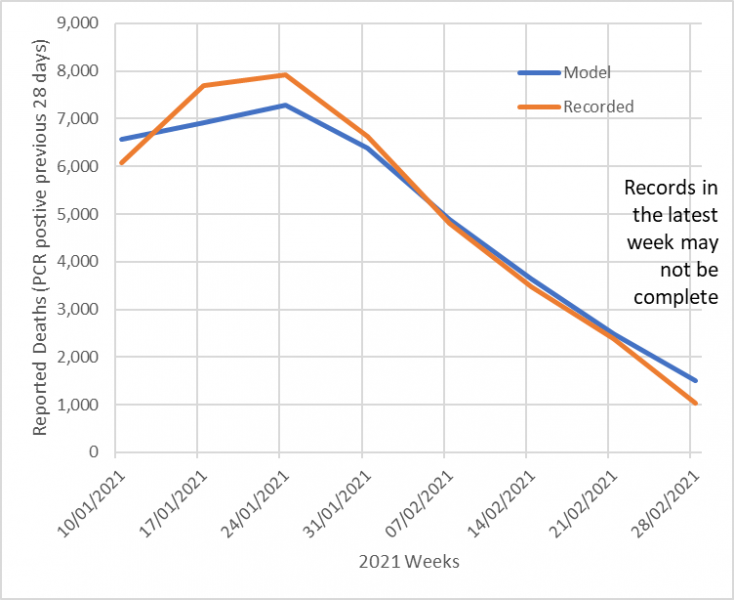
To validate the assumptions, the model simulation was started once on 21st January 2020 and a weekly number of fresh external infections was set at 200 per week to initiate the pandemic. It was also started again on 10th January 2021, where a start value of total current cases was estimated at 800,000, based on the ONS population survey and ZOE-app reports and historic total infected cases were estimated at 8 million based on the 15.9% serology values at the start of January, plus estimated immunity from the 1.3 million vaccinations given in December adjusted for assumed effectiveness. Figures 3a and b show that the model results track the recorded death data for both 2020 and the first two months of 2021 closely; the R squared values between model predictions and data was greater than 0.95 for both 2020 and 2021.
Figure 2. Population at risk of infection, hospitalisation and death by age
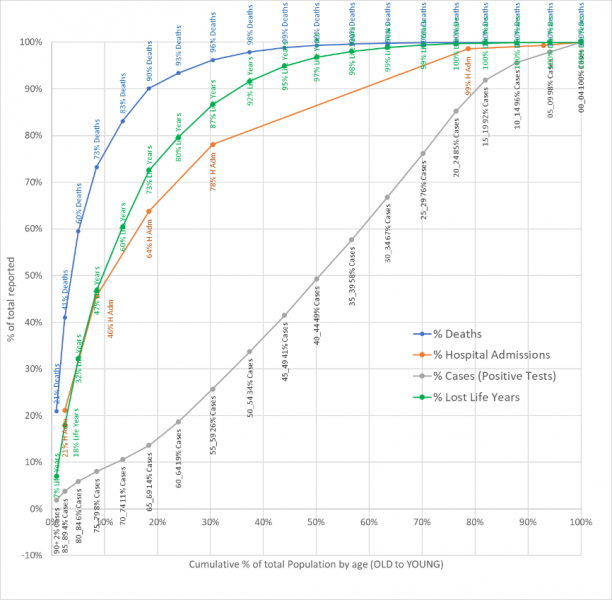
Figure 3. Actual reported deaths vs. Model predicted a) start 1st Jan 2020 b) start 3rd Jan 2021
 |
 |
The model was then run forward to estimate the number of deaths expected in the period March to August 2021 under four different scenarios for the timing of easing restrictions. Due to the lag between infection and deaths, changes in social restriction at the beginning of March do not have an impact until the end of March.
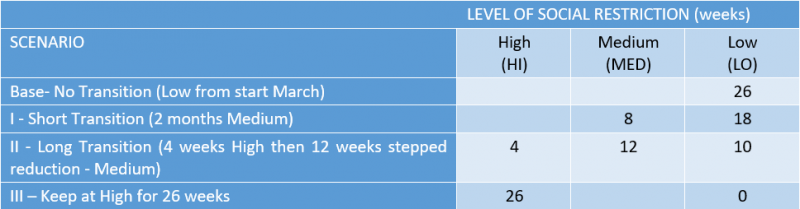
The four Scenarios for different speeds of lifting Social Restrictions over the next 6 months are shown in Table 3. Scenario II (Long Transition) is an approximation to the current government strategy (as of mid-March) – Appendix 1 gives details. The outcomes in terms of likely life-years gained relative to a case of immediate moving to LO restrictions were calculated.
Table 3. Scenarios for different speeds in reducing social restrictions
To calculate life years lost from deaths over the period from March under different scenarios we calculated and applied an average loss of remaining years of life from those aged over 65 of 8.1 years and for those aged under 65 of 27 years. These were full life expectancy years lost with no account made for any life-shortening due to comorbidities or quality of life impairments due to disabilities. In previous work, we have shown such adjustments might be of the order of 50%. (20).
Variations to the base case
There is significant uncertainty about several factors that affect the spread of the virus. No strong policy conclusions should be made based on a single best guess for these factors. So we considered several variations and sensitivities to our base case setting of key parameters.
i. Seasonality: We considered the impact of assuming that March may be closer to winter than summer in terms of the seasonal effect on R
ii. Virus Variants: We allowed for all R-values to be increased by 10% and simulations with the infectious period to be twice as long, at 14 days.
iii. Vaccine: We allowed for vaccine effectiveness to be lower at 50% and 15% (for doses 1 and 2) against the base case of 65% and 20% and a slower rollout reducing to 2,000,000/week.
iv. The worst-case scenario is included using a combination of the above variants being simultaneously applied.
v. An upside scenario was evaluated with the vaccine being more effective and the vaccination rate increasing.
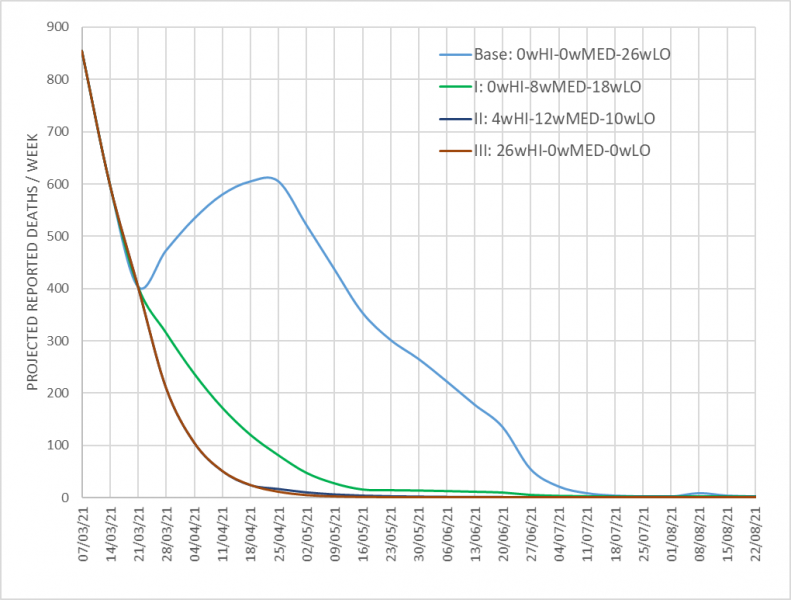
Figure 4 shows central estimates of deaths recorded under different scenarios listed in Table 3 for easing restrictions and using the base case assumptions over seasonality, vaccine rollout and its effectiveness. Table 2 showed how the assumptions for R varies with restrictions and season. These simulations adjust the susceptible population week by week based on vaccine rollout and immunity assumed to be acquired from the history of infections.
Table 4 shows estimates of hospitalisations, deaths, life years lost, and GDP lost from restrictions for the four scenarios. For months when LO restrictions are in force GDP is lower by 2% as a result of those restrictions; this is relative to an assumed path where annual GDP for England is £1.9 trillion and weekly GDP is £37 billion. For months with MED restrictions, the level of GDP is lower by 5% and when restrictions are HI it is lower by 10%.
Figure 4. Future deaths over next 6 month for different scenarios
Using as a base an assumed immediate move to LO restrictions (from March) we can calculate extra lost years of life and extra lost incomes. The ratio of the two is the final column – this is a measure of lost GDP (or incomes) per life-year saved. We stress that the immediate easing of restrictions is simply the base scenario against which other scenarios are judged; we do not assume it is an optimal strategy.
Table 4. Scenarios for March-August 2021 (the ?wHI-?wMED-?wLO refer to the number of weeks at each level of social restrictions in that scenario)
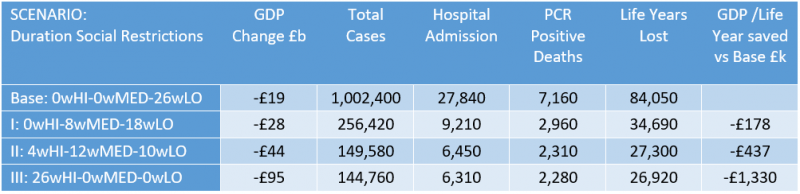
Compared to the base of the immediate ending of most restrictions (that is an immediate level of LO restrictions from the start of March, which starts to affect infections from April) keeping restrictions at the HI level for six months would over the 26 weeks reduce hospital admission by around 21,500 and reduce the number of deaths by 4,900; 57,130 fewer life years are lost. The extra restrictions mean GDP is estimated to be lower by about £76 billion, relative to a base of immediate easing. The (narrowly defined) cost per expected life-year gained is around £1.3 million. Easing restrictions gradually would generate a cost per life-year saved of either around £178,000 or £437,000 (for scenarios I and II).
Non-Covid-19 Health service Impact and Long Covid
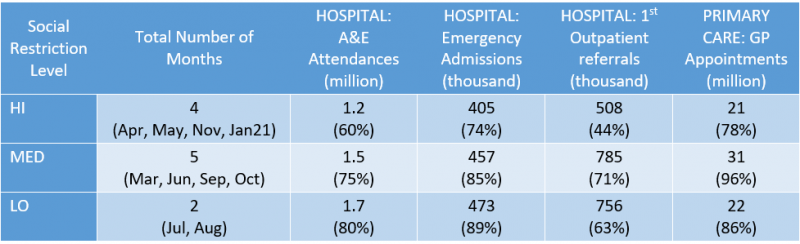
The average monthly level of healthcare provision grouped by level of social restriction is shown in Table 5. In those months where the social restriction was highest, the activity level even in those services with high urgency was well below previous years and lower than other months with lower social restrictions. Even if some part of this could be a direct consequence of managing the pandemic, a part may be due to the levels of social restrictions. Faster easing of these social restrictions might accelerate dealing with the significant backlog of cases.
But against that possible benefit of greater provision of health care if restrictions are eased more rapidly is the cost, beyond lives lost, of lingering health problems for those who survive Covid. How many people are affected by Long Covid, and crucially for how long, is something about which there is huge uncertainty. The National Institute for Health Research in its March 2021 report “Living with Covid 19” reports that for those who were admitted to hospital, between 50% and 89% have at least one enduring symptom after two months.
Table 5. Average monthly activity during pandemic months in 2020 allocated to their levels of social restriction (% is this year as % of average activity in the same months in the previous 2 years)
It is very hard to know whether the extra costs of Long Covid from a more rapid easing of restrictions is larger than or smaller than possible health benefits of restrictions being eased faster that increases access to medical care for non-Covid conditions.
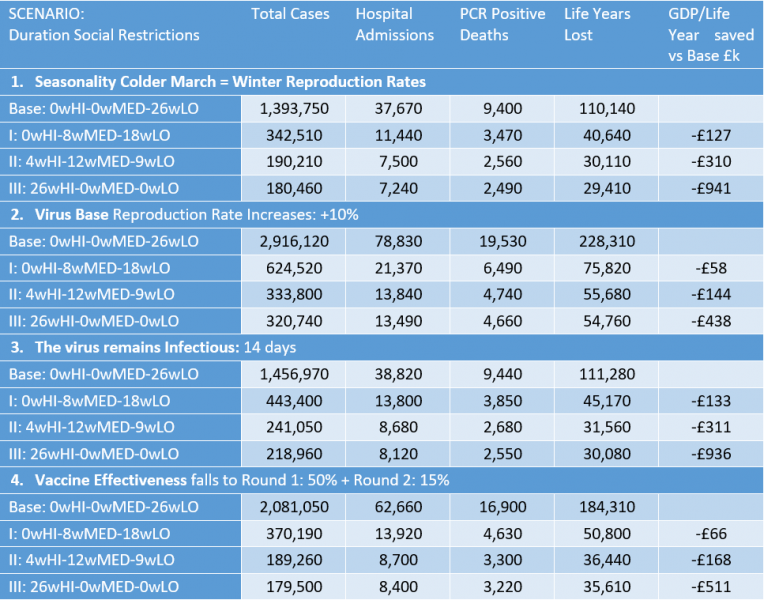
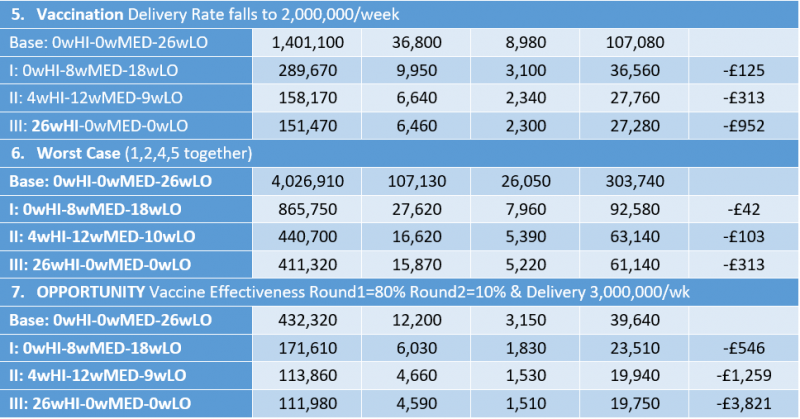
Results from using more adverse assumptions are shown in Table 6. The final alternative scenario (and the only one that is less adverse than the base case) is where vaccine effectiveness is higher. There is considerable upside potential if vaccine effectiveness is higher and if delivery is speeded up. This suggests that at those higher levels of effectiveness the immediate removal of social restrictions would lead to less than half as many deaths.
Table 6. Sensitivity analysis (the ?wHI-?wMED-?wLO refer to the number of weeks at each level of social restrictions in that scenario)
Easing restrictions comes at a cost – more people will be infected and more die than if restrictions are kept in place. But keeping restrictions at the level they were in February 2021 (with all schools and universities effectively shut; non-essential shops closed; restaurants, bars and most entertainment venues empty; travel heavily restricted and social distancing in place wherever feasible) also generates great costs. We have taken a narrow estimate of those costs looking only at lost incomes (that is GDP) that come only when restrictions are in place. We use that to calculate a narrow (and likely understated) cost per potential life-year saved for various policy scenarios. The cost per life-year saved of more gradual easing of restrictions relative to a strategy of rapidly easing restrictions depends very much on just how gradually restrictions are eased and also on a range of factors reflecting, amongst other things, seasonality, the effectiveness of vaccines and how quickly they are rolled out. There is uncertainty about all those factors; that is why we consider several alternative sets of assumptions and these give a fairly wide range for the trade-offs between costs and benefits of different easing strategies. These trade-offs are summarised by the implied cost per life-year saved of slower easing of restrictions. Tables 4 and 6 show that those range from £1.3 million per life-year saved to a little under £50,000 per life-year saved.
The rule used in the National Health Service for the effectiveness of medical treatments is that cost per life-year saved from treatment should be no higher than £30,000. Based on that rule the expected costs of a very slow easing of restrictions over the next 6 months seems higher than its likely benefits. Some government departments use an acceptable resource cost per extra healthy year of life saved at a higher level of £60,000. Even on that basis a somewhat faster easing of restrictions than current government plans seem to imply looks warranted.
Easing restrictions faster generates risks and it may need to be reversed. But there are inevitably risks with any strategy. If one considered that any reversal of an easing of restrictions was itself hugely costly then clearly a more cautious pace of easing is warranted. But to attach a huge weight to any reversal has some unwelcome implications. It is certainly possible that later this year new mutations of the virus might come to the UK (21) and if they are especially virulent/life-threatening, tighter restrictions than those that have been in place in February could become warranted. Yet to tighten restrictions to the level that could become warranted simply to avoid ever having to tighten restrictions again would be a bizarre strategy that itself entails huge inherent risks.
The current strategy of relatively slow easing comes at a cost in terms of GDP reduction of up to £400,000/ life-year − over 10 times higher than the normal public health expenditure limit used to evaluate health resources spent against Quality Adjusted Life Years saved. This should be taken into account in any future policy decisions.
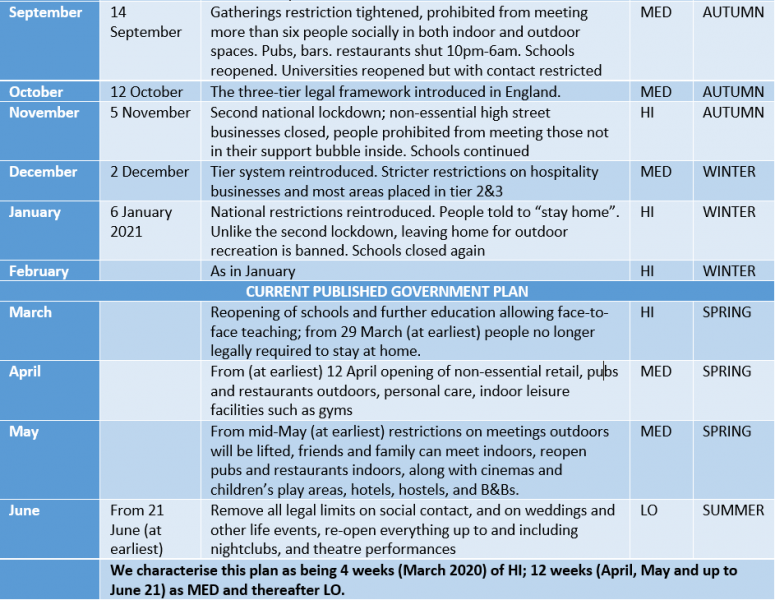
Appendix 1: PANDEMIC POLICY TIMELINE AND ASSOCIATED LEVELS OF SOCIAL RESTRICTION AND SEASON
Appendix 2: FACTORS APPLIED IN MODEL
1. Lilith K Whittles, Natsuko Imai, Edward S Knock, Pablo N Perez-Guzman, Raphael Sonabend, Azra Ghani, Neil M Ferguson, Marc Baguelin and Anne Cori. “Unlocking” Roadmap Scenarios for England v2“, Imperial College COVID-19 Response Team, February 2021. Available at:
https://assets.publishing.service.gov.uk/government/uploads/system/uploads/attachment_data/file/963440/S1129__Unlocking__Roadmap_Scenarios_for_England_.pdf
2. IFS (2021): “The crisis in lost learning calls for a massive national policy response, February 2021”, available at: https://www.ifs.org.uk/publications/15291
3. Peter Lambert and John Van Reenan (2021) “A major wave of UK business closures by April 2021? The scale of the problem and what can be done” Covid-19 Analysis Series No.016, January 2021. The Centre for Economic Performance, The London School of Economics.
4. Katharina Janke, Kevin Lee, Carol Propper, Kalvinder Shields and Michael A. Shields (2020) “Macroeconomic Conditions and Health in Britain: Aggregation, Dynamics and Local Area Heterogeneity”, IZA Discussion Paper 13091, March.
5. Growing backlog of planned surgery due to covid-19 BMJ 2021; 372 doi: https://doi.org/10.1136/bmj.n339 (Published 09 February 2021) Cite this as: BMJ 2021;372:n339 (https://www.bmj.com/content/372/bmj.n339)
6. Indirect acute effects of the COVID-19 pandemic on physical and mental health in the UK: a population-based study KE Mansfield, R Mathur, J Tazare, AD Henderson, AR Mulick, H Carreira et al February 18, 2021 Lancet DOI:https://doi.org/10.1016/S2589-7500(21)00017-0
https://www.thelancet.com/journals/landig/article/PIIS2589-7500(21)00017-0/fulltext
7. Cancer services during COVID-19: 40,000 fewer people starting treatment February 2, 2021 K Roberts Cancer Research UK https://scienceblog.cancerresearchuk.org/2021/02/02/cancer-services-during-covid-19-40000-fewer-people-starting-treatment/.
8. Employment and unemployment – How does work affect our health The Health Foundation https://www.health.org.uk/news-and-comment/charts-and-infographics/unemployment
9. SAGE 80 minutes: Coronavirus (COVID-19) response, 11 February 2021 https://www.gov.uk/government/publications/sage-80-minutes-coronavirus-covid-19-response-11-february-2021/sage-80-minutes-coronavirus-covid-19-response-11-february-2021
10. Sage SPI-M-O: Summary of modelling on scenarios for easing restrictions 7th February 2021 https://assets.publishing.service.gov.uk/government/uploads/system/uploads/attachment_data/file/963400/S1116_SPI-M-O_Summary_of_modelling_on_scenario_for_easing_restrictions.pdf
11. Oxford coronavirus vaccine shows sustained protection of 76% during the 3-month interval until the second dose – Oxford University News https://www.ox.ac.uk/news/2021-02-02-oxford-coronavirus-vaccine-shows-sustained-protection-76-during-3-month-interval
12. UK COVID-19 vaccine uptake plan Policy Paper Published 13 February 2021 https://www.gov.uk/government/publications/covid-19-vaccination-uptake-plan/uk-covid-19-vaccine-uptake-plan
13. Hemmes JH, Winkler KC and Kool SM (1960) “Virus survival as a seasonal factor in influenza and poliomyelitis”. Nature 188, 430-431
14. The R-value and growth rate in the UK The latest reproduction number (R) and growth rate of coronavirus (COVID-19) in the UK. https://www.gov.uk/guidance/the-r-number-in-the-uk.
15. Office for National Statistics (OBNS) Coronavirus (COVID-19) Infection Survey, UK: 26 February 2021, https://www.ons.gov.uk/peoplepopulationandcommunity/healthandsocialcare/conditionsanddiseases/bulletins/coronaviruscovid19infectionsurveypilot/march2021
16. E Knock, LK Whittles, JA Lees, NM Ferguson, M Baguelin et al (2020) “The 2020 SARS-CoV-2 epidemic in England: key epidemiological drivers and impact of interventions” 22 December 2020, MRC Centre for Global Infectious Disease, Report 41. https://www.imperial.ac.uk/mrc-global-infectious-disease-analysis/covid-19/report-41-rtm/
17. GOV.UK Coronavirus (COVID-19) in the UK Healthcare in England,
https://coronavirus.data.gov.uk/details/healthcare?areaType=nation&areaName=England
18. GOV.UK Coronavirus (COVID-19) in the UK Deaths in England,
https://coronavirus.data.gov.uk/details/deaths?areaType=nation&areaName=England
19. ONS Deaths registered weekly in England and Wales, provisional: week ending 19 February 2021, https://www.ons.gov.uk/peoplepopulationandcommunity/birthsdeathsandmarriages/deaths/bulletins/deathsregisteredweeklyinenglandandwalesprovisional/weekending5february2021
20. Miles, D; Stedman, M and Heald, A (2020) “Living with Covid-19: balancing costs against benefits in the face of the virus” National Institute Economic Review, Issue 253, Cambridge University Press.
21. Dawood AA. Mutated COVID-19 may foretell a great risk for mankind in the future. New Microbes New Infect. 2020; 35:100673. doi: 10.1016/j.nmni.2020.100673.
Corresponding Author: David K. Miles, Imperial College Business School, London; Email: d.miles@imperial.ac.uk
The Faculty of Biology, Medicine and Health and Manchester Academic Health Sciences Centre, University of Manchester; Department of Diabetes and Endocrinology, Salford.
Res Consortium, Andover, Hampshire, UK.