
We quantify the variability of risk weights (RW) across banks. Risk weights define banks minimum capital requirements and – together with their capital level – their capital ratios, e.g. CET1 ratios or other solvency ratios. In line with the Basel regulatory capital framework, RW should adequately mirror the risk of the obligations. One meaningful indicator of the underlying risk is the share of nonperforming loans (NPLs) in a given portfolio and our dataset provides the NPL ratio on portfolio level. Using a granular and public EU-wide dataset, we show that a good portion of RW variability can be explained by portfolio- and destination-specific risk indicators as intended by regulation. Contrary to the intention of banking regulation, we find statistically significant and economically important differences with regard to the country where a bank is headquartered and marginally statistically significant effects that banks with low common equity tier 1 employ low RW after controlling for risk. The paper sets forth evidence that implementation standards differ from jurisdiction to jurisdiction.
1. Introduction
The denominator of banks’ solvency ratios are risk-weighted assets. As solvency ratios are the core part of modern banking regulation, risk-weighting of assets is crucial to banking supervision since the earliest days of the Basel approach.
Basel II permitted banks to use internal risk models to quantify their capital requirements for credit risk (the so-called internal ratings-based (IRB) approach) instead of the risk weight table under Basel I. Banks hence began to employ such models and, upon supervisory approval, use them to calculate their capital requirements. As an alternative, Basel II allowed banks to employ a simpler standardized approach for calculating the risk inherent in their exposures – an option mainly smaller bank choose.
With the permission to use internal risk estimates, regulators aimed at increasing risk sensitivity of capital requirements. However, banks’ incentives to use “artificially low” internal estimates and differences in banks’ and supervisory standards regarding the implementation of these models are two concerns that need to be addressed.
Several studies examining whether supervisors were able to prevent banks from embellishing capital ratios found discrepancies in risk weights across banks and jurisdictions.3 Therefore, international bodies like the Basel Committee on Banking Supervision (BCBS) and the European Banking Authority (EBA) responded by strengthening their focus on the topic. A number of studies also showed that many banks that rely on internal models for calculating regulatory capital overstate their capital ratios by reducing the risk weights (Vallascas and Hagendorff, 2013; Mariathasan and Merrouche, 2014; Behn et al., 2016; Bruno et al., 2016). Such practices would have grave consequences for banking regulation, which largely relies on capital requirements. For this reason, some researchers (e.g. Haldane, 2012) argue that banking regulation should become less complex, a view that has attracted growing support recently (BCBS, 2016b). With the transition to IFRS 9, internal credit risk models will also be used to determine credit risk provisions. Against this backdrop, the comparability of banks’ internal model outcomes will be even more relevant.
We set out to investigate the main determinants of RW heterogeneity. We focus on the question to which extent differences in RW can be explained by factors that relate to different credit risk – as intended by regulation – and to which extent to unintended factors, like size and capitalization of the bank or the location of the headquarter of the bank (and thus its main supervisor).
2. Regulatory undertakings and macroprudential policy measures are addressing risk weight heterogeneity
In response to the growing literature on RW heterogeneity, regulatory reviews addressed this issue, e.g. the Regulatory Consistency Assessment Programme (RCAP) exercise of the Basel Committee on Banking Supervision, the EBA’s review of consistency of risk-weighted assets exercise and the ECB’s Targeted Review of Internal Models (TRIM) exercise.
In addition, as part of its review of consistency of risk-weighted assets, the EBA (2017a) published a report presenting the results of the supervisory benchmarking exercise for residential mortgages, SME retail, SME corporate and corporate-other portfolios covering 114 institutions in 17 EU countries. According to this report, the country of the reporting bank and the respective countries of the counterparties are important drivers of RW variability. This confirms that RW variability may be due to not only the underlying risk but also to bank and supervisory practices.
In addition to these supervisory reviews, macroprudential supervision took action to establish RW floors in Belgium, Croatia, Finland, Ireland,Luxembourg, Norway, Poland, Romania, Slovenia, Sweden and the United Kingdom. These RW floors either apply on a bank average basis or on an individual loan basis – typically for the asset class of retail mortgages (see ESRB, 2017, for an overview of macroprudential measures). Both, the large and growing body of literature and supervisory as well as macroprudential action, attest to the importance of the IRB RW topic.
3. Step-by-step exploration of risk weight heterogeneity in Europe
Our analysis is based on the datasets from the EBA transparency exercises. This public database comprises bank-specific data of over 130 banks, at the highest level of consolidation, from 24 countries in the EU and the European Economic Area (EEA) for six reference dates representing around 70% of total EU banking assets (European Banking Authority, 2015). A considerable advantage of the dataset is its granularity – exposures and RW are broken down by banks, asset classes, the destination of the credit, default status and calculation method (IRB vs. standardized approach) as well as time. This granularity allows us to compare portfolio-by-portfolio RW determined by a number of factors.
Given that the data are also used in EBA stress tests, both the banks’ own and supervisory quality control ensures a high standard of data quality. Needless to say, errors might occur in a dataset that large. To ensure that outliers do not affect our estimates, we exclude observations where RW exceed 370% or where the exposure (of a particular bank to a particular destination in a particular asset class and period) is missing or below EUR 5 million. In general, we consider the data quality to be high.
a. RW comparison based on the standardized and the IRB approach shows substantial differences
The first important determinant of the level of RW that we consider is whether the calculation is based on the standardized approach (StA) or the IRB approach. The upper panel of Chart 1 below shows kernel density estimates for RW for retail and corporate clients as calculated under the StA or the IRB approach. The lower panel of Chart 1 presents a breakdown by the country of the consolidating entity (i.e. the country where a bank is headquartered; in the following referred to as “HQ country”). While StA RW are concentrated around 35%, 75% and 100%, IRB RW populate a broad range of values, all as intended by regulation. We infer that IRB RW are substantially lower than StA RW. Moreover, in some countries there is no or hardly any overlap between both distributions. StA RW exhibit a very similar distribution, but IRB RW vary substantially from country to country. For example, Ireland has the highest median RW with a relatively high variation as reflected by the long box plots, while Denmark and Luxembourg have the lowest median IRB RW.
Chart 1: Distribution of RW for corporate and retail exposures
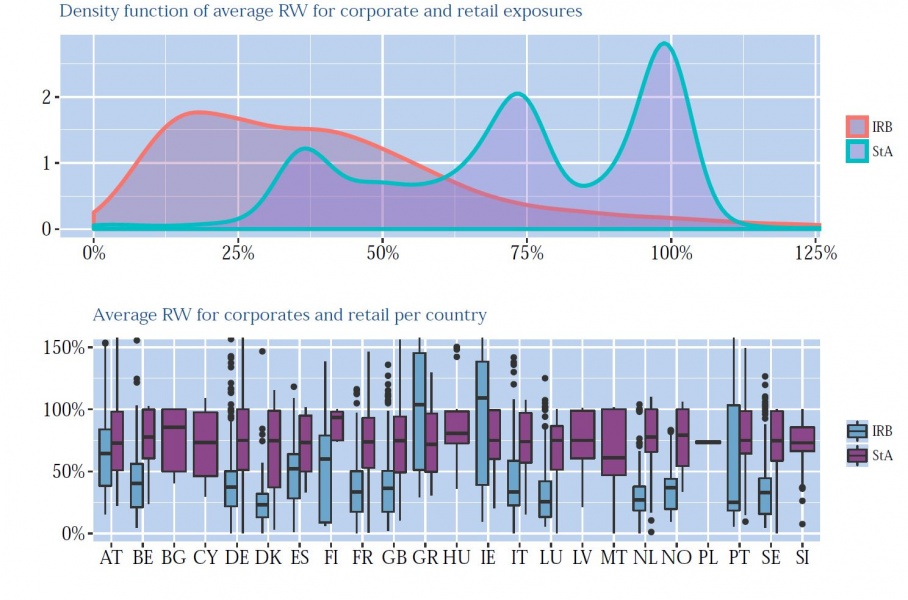
Source: EBA Transparency Exercise data, author’s calculations.
However, several caveats apply to this comparison of StA RW and IRB RW, which makes a more detailed comparison difficult. For one thing, under the IRB approach, banks calculate expected loss and deduct any excess of this amount over provisions from capital. In addition, the definition of asset classes differs, which likewise makes a more detailed comparison problematic. Given the absence of heterogeneity in StA RW and the above-mentioned lack of their comparability with IRB RW, we decide to focus on IRB RW only. An important takeaway is that, everything else equal, a bank with a higher share of IRB exposures will tend to have substantially reduced RWA. The extent to which a bank uses the IRB approach or StA is therefore crucial to the RW level.
b. Determinants of IRB risk weights
From Chart 1 lower panel we inferred that there are large country differences between IRB RW. First, we investigate whether these differences can be explained by differences in the underlying risk. To that end, we estimate a panel model that includes country, bank and portfolio-specific factors as control variables. More precisely we use
i) the asset class, as credit to an institution tends to be less risky than to a small corporates,
ii) a set of macroeconomic variables like recent GDP growth and unemployment specific to the destination of the credit, as countries hit harder by the crisis tend to have higher default risk or uncertainty on their collateral value,
iii) the ratio of non-performing loans (NPL ratio) in that portfolio4 which is an excellent indicator of the riskiness of the particular portfolio and is available on the same level of granularity as RW (bank-asset class-time and destination basis),
iv) further portfolio-specific factors, e.g. whether the credit is to a foreign country, the relevance of the particular market (asset class and destination) to the bank and the NPL ratio of the whole asset class of that bank, i.e. irrespective of destination.
Even though these destination-specific and portfolio-specific risk factors considered so far already explain a fair share (54%) of RW variability, we might be missing further destination specific factors, e.g. whether the destination country has a real estate property register. Also, there might be effects across all exposures over time. To account for these, we add dummy variables for each destination country and time point, which capture all remaining effects common to a destination or a time point.
So far, we have considered only factors that reflect intended RW variability as these relate to different levels of risk of the credits granted. We now analyze whether – after having controlled for risk – different implementation standards and supervisory practices (unintended risk weight heterogeneity) also play a role. For this purpose, we add dummies for each country where the bank is headquartered granting the loan (“HQ effects”). In an ideal world with equal implementation standards, these HQ fixed effects would not matter, i.e. they would be statistically zero. What should matter however is who receives the credit (destination effects introduced earlier), but not who is granting it (HQ effects). While the explained variance rises only marginally (from 56% to 57%), the HQ effects are important5: for most countries we find no significant HQ effects, but for some countries6, there are statistically significant and economically important effects, which is in line with Turk-Ariss (2017) and the EBA (2017a).
The effects are large in Denmark, Sweden and Italy, with low RW due to the HQ of the bank being in these countries, whereas the opposite is true for Ireland, the United Kingdom, Portugal and Austria. As a case in point, the expected IRB RW of a bank headquartered in Italy is 18.3 percentage points lower than the IRB RW of a Portuguese bank with the same destination, asset class and macroeconomic environment. These economically important effects would change the CET1 ratio by several percentage points – depending on the share of IRB capital requirements in total minimum capital requirements.
Chart 2: IRB risk weights for corporate exposures (left) and retail exposures secured by real estate (right)
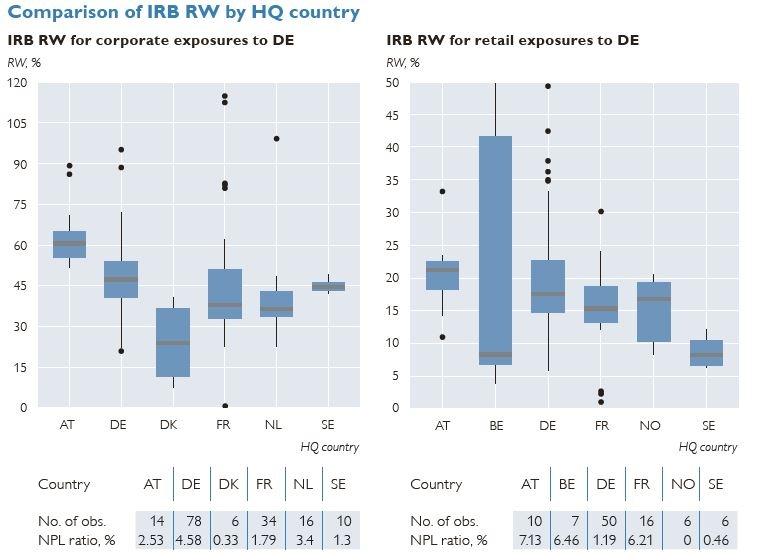
Source: EBA Transparency Exercise data, author’s calculations.
To better illustrate this heterogeneity between HQ countries, Chart 2 depicts RW pertaining to the same asset class and the same destination (Germany) of all banks headquartered in selected countries7. We see that in some cases RW variability is more pronounced between countries than within one country. In other cases, the medians of the distribution still differ widely. While Chart 2 illustrates the heterogeneity across HQ countries, the results in a regression are sharper as the regression allows us to identify HQ effects also after controlling for portfolio-specific NPL ratios etc. As discussed, NPL ratios are a good indicator of the probabilities of default but less so of the underlying collateral.
c. Evidence for other unintended risk weight heterogeneity
In addition to different implementation standards, we look at other forms of unintended risk weight heterogeneity. First, banks with a lower CET1 ratio (e.g. due to an idiosyncratic risk shock) have a greater incentive to push for low RW to artificially increase their CET1 ratio and thereby avoid regulatory and market sanctions. To test this hypothesis, we conduct a two-stage least squares (2SLS) estimation by using the “leverage ratio”8 as an instrument variable (IV) for the CET1 ratio. In light of the model output, we do not reject our hypothesis that banks with a low CET1 ratio push for low RW, which results in artificial increases of their CET1 ratios. However, this effect is only marginally significant (p<0.1).
Second, we also test whether large banks are better able to outmaneuver supervisors by increasing the complexity of their models. Large banks tend to have lower RW, but this general observation does not control for asset class composition and other risk indicators discussed above. In our context, we can control for these factors. We add total credit exposure of each bank and/or its log to the regression. We find no statistically significant effect supporting this hypothesis.
4. The effects of changing HQ countries on banks’ capital ratios
We quantify the model results by assessing how capital ratios – the ratios between capital and risk-weighted assets – would change if we only changed the country where banks are headquartered but kept everything else equal. For this hypothetical prediction exercise, we select the largest banks from every country according to their total credit exposure (both in IRB and StA) and use the estimation results obtained in the previous section to calculate the hypothetical capital ratios. Clearly, these calculations are hypothetical in several respects and should be understood only alongside these caveats: for one thing, we use the point estimates irrespective of statistical significance (e.g. there is also an effect AT vs. IE). For another, we assume that the prediction error is additive and independent of HQ effects. Also, these simulation should not be misunderstood as a “what-if” bank A would move its HQ to country B, as risk models that are already improved are unlikely to change abruptly. In short, these calculations are meant to illustrate the magnitude of the regression coefficients. The estimates should definitely be taken with a grain of salt: parameter uncertainty alone causes these CET1 ratios to fluctuate on average +/–85 basis points in a 25%–75% confidence band.
Table 1 shows the hypothetical capital ratios for the largest banks in all countries, with the main diagonal representing the actual capital ratios as at June 2016 and the caveats mentioned above. The off-diagonal elements, which often deviate from the actual ratios, are driven by two factors: (1) the HQ dummy coefficients, and (2) the share of a bank’s IRB risk exposure amount in its total minimum capital requirements. While the first factor determines the size of the change to a single RW, the second determines the degree to which a bank’s minimum capital requirements are affected. The effects are economically large.9
Table 1: Hypothetical CET1 ratios of selected Banks
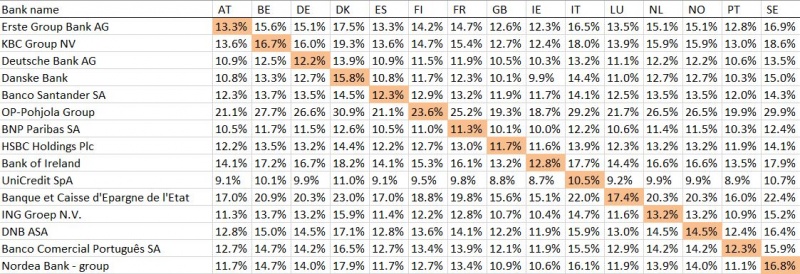
Source: author’s calculations.
5. Summary and conclusions
We analyze RW variability in the EU banking sector, using a granular dataset and a panel model approach. Our focus is on the question whether RW can be approximated by observable risk indicators (intended risk weight heterogeneity) or whether there is evidence for unintended risk weight heterogeneity. The latter would reflect differences in banks’ and supervisory implementation standards and in banks’ propensity to use artificially low internal estimates across jurisdictions. In a stepwise procedure, we show that a good portion of RW variability can be explained by portfolio- and destination-specific risk indicators such as macroeconomic indicators and NPL ratios. Such variability is in line with regulators’ intentions. We then also study unintended risk weight heterogeneity by analyzing the effects on RW of (1) bank size, (2) bank capitalization, (3) the headquarter country reflecting supervisory practice and implementation standards.
We find that, first, it is not statistically significant that large banks are better able to push RW down (after controlling for the underlying credit risks). Second, it is of marginal statistical significance that banks with low CET1 ratios employ RW that are lower than would be expected from the underlying credit risk. Third, there are statistically significant and economically important differences relating to the country where the bank is headquartered. This provides evidence that standards are implemented differently from jurisdiction to jurisdiction, a finding that is robust to a range of alternative specifications including tree-based methods.
We conclude that recent efforts by supervisors to lower RW variability are important for market participants, most notably the EBA benchmarking exercise and the ECB’s TRIM exercise. With a view to ensuring a level playing field, the measures focusing specifically on the euro area should be extended to encompass also non-euro area countries in order to reduce unwarranted RW variability. Many of the countries with large (negative) HQ effects, i.e. low RW after controlling for risk, have already implemented macroprudential measures that specifically address the issue of low RW. As a case in point, Sweden’s financial supervisory authority requires banks to hold systemic risk buffers, to maintain minimum RW and to comply with high capital charges under Pillar 2. In addition, our results support regulatory floors for model outputs as also envisaged under Basel IV and efforts by supervisors to harmonize banks’ Pillar III requirements.
Our findings also help inform the ongoing policy debate about the complexity of regulation. Complex rules require a (potentially too) great effort from supervisors to enforce standards consistently and monitor those subject to the rules. It would only be fair that the costs of these efforts were borne by those calling for such complex rules.
BCBS. 2013. Regulatory consistency assessment programme (RCAP) – Analysis of risk-weighted assets for credit risk in the banking book.
BCBS. 2014. Capital floors: the design of a framework based on standardized approaches.
BCBS. 2016a. Reducing variation in credit risk-weighted assets – constraints on the use of internal model approaches.
BCBS. 2016b. Finalising Basel III: Coherence, calibration and complexity. Keynote speech by Stefan Ingves at the second Conference on Banking Development, Stability and Sustainability. 2 December 2016. Santiago, Chile.
Barakova, I. and A. Palvia. 2014. Do banks’ internal Basel risk estimates reflect risk? In: Journal of Financial Stability 13. 167–179.
Begley, T. A., A. Purnanandam and K. Zheng. 2017. The Strategic Under-Reporting of Bank Risk. In: Review of Financial Studies 30(10). 3376–3415.
Behn, M., R. Haselmann and V. Vig. 2016. The limits of model-based regulation. ECB Working Paper Series 1928.
Beltratti, A. and G. Paladino. 2016. Basel II and regulatory arbitrage. Evidence from financial crisis. In: Journal of Empirical Finance 39. 180–196.
Bruno, B., G. Nocera and A. Resti. 2016. Are risk-based capital requirements detrimental to corporate lending? Evidence from Europe. CEPR Discussion Paper 12007.
Döme, S. and S. Kerbl. 2017. Comparability of Basel risk weights in the EU banking sector, Oesterreichische Nationalbank, Financial Stability Report, Vol. 34, pp.68-89.
European Banking Authority. 2013. Interim results update of the EBA review of the consistency of risk-weighted assets. 5 August 2013.
European Banking Authority. 2015. Report – 2015 EU-wide transparency exercise. 25 November 2015.
European Banking Authority. 2017a. Results from the 2016 High Default Portfolios (HDP) Exercise. EBA Report BS 2017 027.
European Banking Authority. 2017b. Results from the 2016 Market Risk Benchmarking Exercise. EBA Report BS 2017 031.
European Central Bank. 2017. Guide for the Targeted Review of Internal Models (TRIM) – Counterparty Credit Risk. Banking Supervision. February.
European Systemic Risk Board. 2017. National Policy – Other measures.
https://www.esrb.europa.eu/national_policy/other/html/index.en.html (retrieved on August 17, 2017).
Fraisse, H., M. Le and D. Thesmar. 2015. The Real Effects of Bank Capital Requirements. HEC Paris Research Paper FIN-2013-988.
Haldane, A. G. 2012. The Dog and the Frisbee. Speech at the Federal Reserve Bank of Kansas City’s 366th economic policy symposium “The changing policy landscape.” Jackson Hole, Wyoming. 31 August.
Hastie, T., R. Tibshirani and J. Friedman. 2009. The Elements of Statistical Learning. Springer Series in Statistics. New York: Springer.
Kerbl S. and M. Sigmund. 2009. Cyclicality of Regulatory Capital Requirements: First Evidence from Austria. In: Financial Stability Report 18. Vienna: OeNB. 97–106.
Mariathasan, M. and O. Merrouche. 2014. The manipulation of Basel risk-weights. In: Journal of Financial Intermediation 23. 300–321.
Plosser, M. C. and J. A. C. Santos. 2014. Banks’ Incentives and the Quality of Internal Risk Models. Federal Reserve Bank of New York Staff Reports 704. December.
Turk-Ariss. R. 2017. Heterogeneity of Bank Risk Weights in the EU: Evidence by Asset Class and Country of Counterparty Exposure. IMF Working Paper 17/137.
Vallascas, F. and J. Hagendorff. 2013. The Risk Sensitivity of Capital Requirements: Evidence from an International Sample of Large Banks. In: Review of Finance 17(6). 1947–1988.
Oesterreichische Nationalbank, Financial Stability and Macroprudential Supervision Division, zsofia.doeme@oenb.at and stefan.kerbl@oenb.at. The views expressed in this paper are exclusively those of the authors and do not necessarily reflect those of the OeNB or the Eurosystem. The authors would like to thank Markus Behn (ECB) for helpful comments and valuable suggestions.
A more detailed version of this article was published in the Financial Stability Report 34 of the Oesterreichische Nationalbank, see Döme and Kerbl (2017).
For example, Behn et al. (2016) and BCBS (2013) provide an overview of the literature on risk weight heterogeneity.
Strictly, we have the ratio of defaulted loans. In this paper, “nonperforming” and “defaulted” are used synonymously. There is a slight difference between NPLs and defaulted loans. What we call NPL ratio here is in fact the share of defaulted loans (as included in our dataset). We consider the availability of the NPL ratio on such a granular level as a key feature of the database and its statistical exploitation.
The probability that all HQ effects are equal to zero can be rejected at any probability level (F-statistic: 228.5 on 16 and 7670 degrees of freedom). The R2 of using solely HQ effects and no other regressors would be 32%. We conduct further statistical tests and robustness checks that validate this conclusion (see Döme and Kerbl, 2017).
Some of these identified countries have already taken macroprudential measures targeting banks’ RW (see http://www.eba.europa.eu/risk-analysis-and-data/eu-wide-transparency-exercise/2017 for an overview).
Germany was chosen as a destination because a large number of banks from different HQ countries actively grant loans to Germany, which enables us to draw this comparison. The HQ countries were chosen based on their HQ regression dummy coefficient.
As “leverage ratio” we use the ratio of tier 1 capital over total credit exposures.
We additionally validate this finding by training a random-forest and a boosted regression tree to our data as well as a large set of different regression setups (see Döme and Kerbl, 2017).
