Economic convergence has been one of the explicit goals of the EU from its very beginning. The prospect of higher living standards has undeniably been a major attraction of EU membership. Conversely, economic divergence may undermine support for the European project and complicate the common monetary policy in the euro area. In this policy note, we first summarise the key findings of an analysis of national and regional convergence across the EU. In particular, we show that initially poorer European countries and regions have, in general and over the long term, made progress in catching-up with the income levels of their richer peers, even though convergence has not been a smooth process. The relative performance of countries and regions in the EU is also illustrated. We then shed some light on the extent to which the Covid-19 crisis and the ensuing recovery might impact the functioning of the EU “convergence machine”, before drawing some implications in terms of economic policy.
In a recent article (Bisciari et al., 2020), we assess the achievements of the EU with respect to real/income convergence, in terms of GDP per capita (expressed in purchasing power standards or PPS), at both the national and regional levels.
Our analysis distinguishes itself from other studies in this field in a number of ways. First, it covers all EU28 member states (still including the UK) and their regions, except for Luxemburg, Ireland, Malta and Cyprus where GDP figures are distorted by disproportionally large financial sectors and/or multinational corporate activities. Second, a long-term perspective is adopted, as far as data availability allows it. The national-level analysis goes back to 1960 for the “old” EU15 member states and to 1995 for “newer” members. At the regional level, data on about 200 EU regions is used from 1996 onwards. The focus is on large regions (Territorial Level 2, TL2) as defined by the OECD and also commonly employed by the IMF (see IMF, 2019). These regions correspond to countries’ first tier of sub-national government, i.e. Länder in Germany, Regions in Italy, Provinces in the Netherlands, etc. Finally, we extend twelve metropolitan or capital regions to encompass their main commuting zones in order to attenuate the “commuting bias” (since commuters contribute to those regions’ GDP but not to their population head count). These include notably the regions containing London, Berlin, Amsterdam, Vienna, Prague and Brussels. We refer to our whole regional sample as “TL2-corrected regions”.
Evidence of overall convergence across the EU28…
We find evidence of relatively strong convergence of incomes (GDP per capita in PPS) across countries and large regions in the EU28 over the longer term. For the EU28, “sigma convergence” is reflected by the decline in the dispersion of per capita GDP both at the national and regional level. This is observed both in the decrease of the coefficient of variation of EU incomes and the Theil index (see hereafter). Also in the smaller sample of the EU15, disparities in EU Member States’ per capita incomes declined between 1960 and 2008, though periods of faster convergence alternated with periods of slower convergence or even divergence.
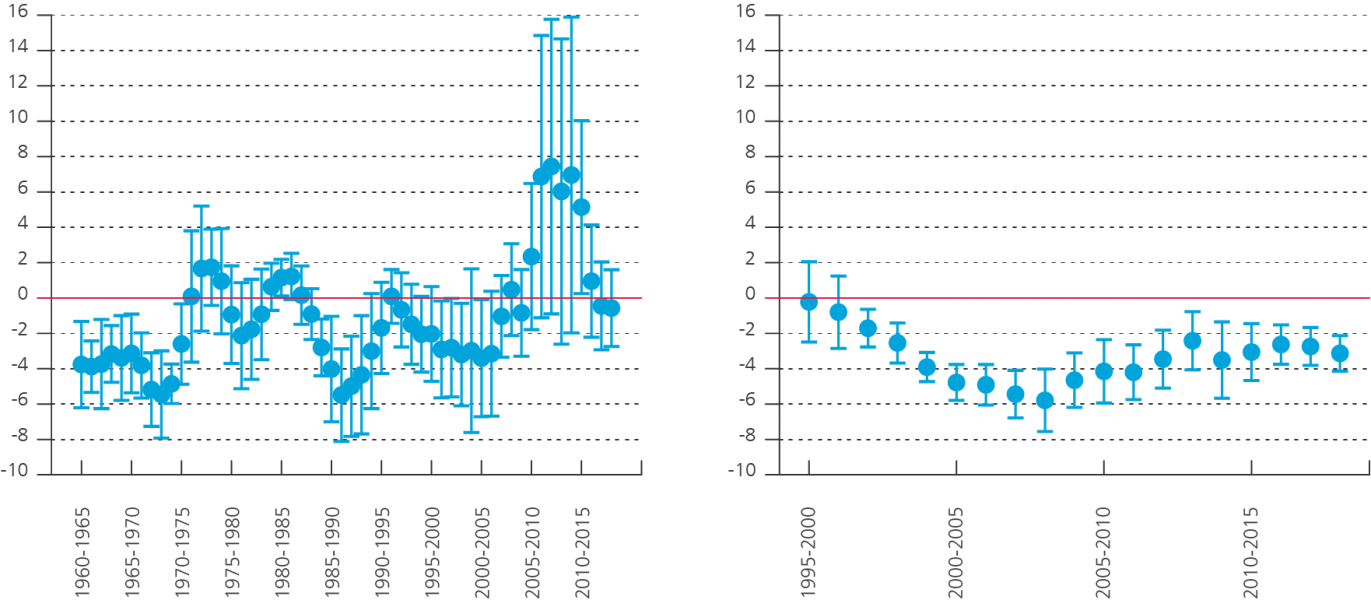
Further investigation at the national level confirms the existence of (unconditional) “beta convergence”, with beta referring to the slope of a simple linear regression of growth rates on initial incomes (and a negative beta indicating convergence). Hence, initially poorer countries tend to grow faster than richer ones, across the EU28 and, most of the time, across the EU15 (Chart 1). This result is also found at the regional level, as evidenced by the negative slope of the best linear fit in Chart 3.
Chart 1. Convergence across EU member states has not been a smooth process
(beta coefficients in % and their 95 % confidence intervals, estimated from rolling OLS regressions for 5-year-ahead growth in GDP per capita in PPS)
| EU15 | EU28 |
 |
|
Source: EC (Ameco).
Throughout the note, EU28 and EU15 exclude CY, IE, LU and MT.
…but convergence has not been a smooth process
However, as Chart 1 illustrates, the convergence process has not always been smooth. While the EU “convergence machine” has worked most of the time and for most regions, sometimes and for some places, it has sputtered. Convergence has been strongest during high-growth periods, during the early stages of EU integration among the old Member States, and just before and following the accession of the Central-Eastern European (CEE) countries. Crisis periods were marked by slowing convergence (in the EU28) or even divergence (in the EU15).
The global financial crisis and the ensuing European sovereign debt crisis heralded a period of severe economic underperformance in much of Southern Europe, undermining overall convergence. This is echoed by an increase in the coefficient of variation in the EU15 and a stagnation of the coefficient of variation in the EU28. Only after 2014 sigma convergence seems to have resumed. In the left-hand panel of Chart 1, the beta coefficients take positive values in the crisis years, although they are not statistically significant. Positive beta coefficients are also observed in the aftermath of the oil crisis and the collapse of the Bretton Woods system, and following the ERM crisis.
Convergence across the EU28 is driven by countries and not by regions
The dispersion in the per capita incomes of the 201 TL2-corrected EU28 regions we consider is found to have decreased between 1996 and 2018, but only due to the decline in the income dispersion across countries. Indeed, the income disparities within countries have slightly increased over that period (Chart 2).
Chart 2. Dispersion of regional incomes across the EU has decreased due to the decline in dispersion between countries
(population-weighted Theil index of GDP per capita in PPS and its decomposition into country and regional components, EU28 TL2-corrected regions)
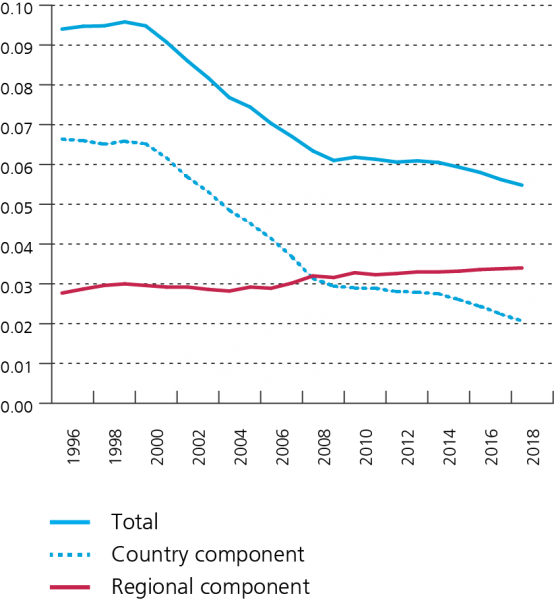
Source: EC (Ardeco).
Catching-up of Central and Eastern European capital regions has contributed most to convergence
Thanks to the process of income convergence between the EU28 countries, also regional incomes exhibit overall (unconditional) beta convergence over the years 1996-2018. This is evident from the overall negative relation between regions’ initial level of GDP per capita and their GDP per capita growth over that period (Chart 3).
Based on their economic performance, regions can be divided into four groups (corresponding to the four quadrants in Chart 3): those that have been “catching up” (initially poorer than the EU average, but with above-average growth); “pulling away” (initially richer and growing faster than the average); “cooling off” (initially richer but growing more slowly than the average); and “lagging behind” (initially poorer and growing more slowly than the average). An important driver of overall convergence is the performance of the CEE regions, which have been mostly catching up. All capital regions in CEE have done exceptionally well in that they grew faster than what one would expect based on their initial incomes (i.e. they are found above the regression line). Most Southern European regions, on the other hand, have failed to keep up with the EU and have been either lagging behind or cooling off more than expected (below the regression line). North-Western European regions tended to have above- or close-to-average incomes in 1996. They are found in all four performance categories.
Chart 3. Over the long term, regional incomes exhibit unconditional beta convergence
(change in GDP per capita in PPS over 1996-2018 versus GDP per capita in PPS in 1996, both relative to the EU28 average, TL2-corrected regions)
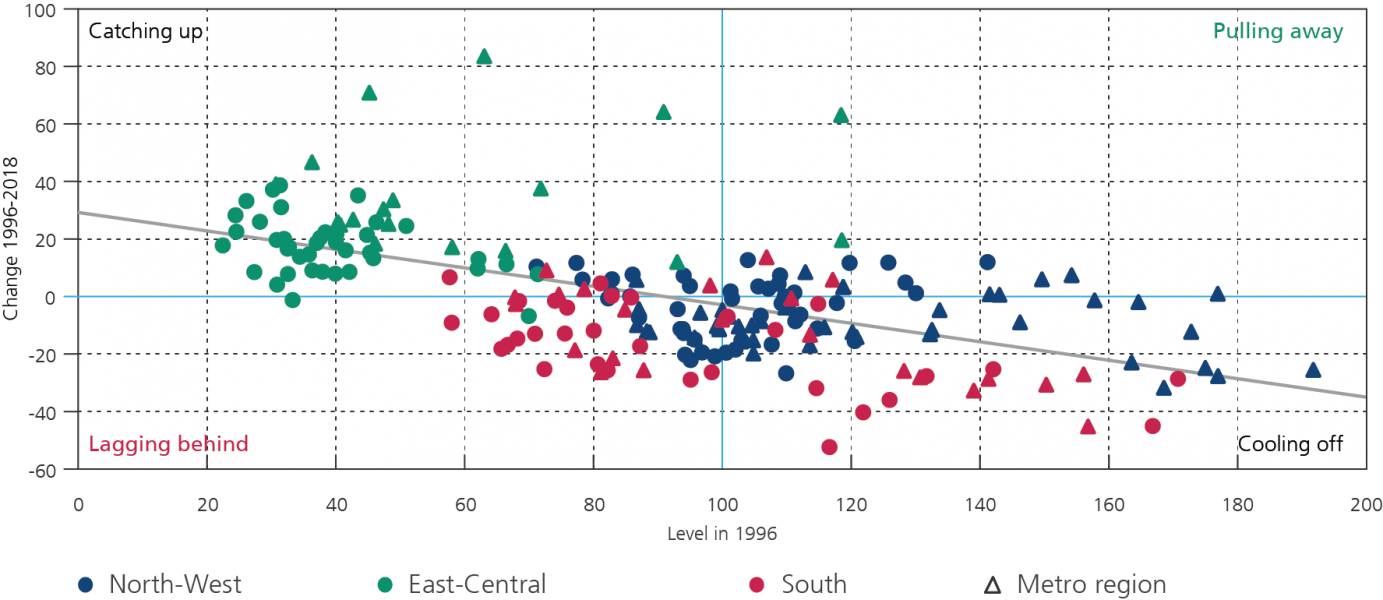
Source: EC (Ardeco).
In most EU countries, regions show heterogenous patterns of economic development, with capital regions typically growing faster than other regions
Chart 4 illustrates regions’ heterogenous patterns of development, even within countries. Well-known examples of regional divides include Western vs Eastern Germany, Northern vs Southern Italy and Northern vs Southern Belgium.
Capital regions tend to stand out, not only in the catching-up countries of CEE but also in many other countries. For example, Copenhagen, North Holland (Amsterdam), Helsinki and Ile-de-France (Paris) belong to the pulling-away category. All other continental French regions are either lagging behind or cooling off (more than expected). Similarly, all UK regions have grown less rapidly than the EU but London has been more resilient. This may have contributed to a “geography of discontent” (Dijkstra et al., 2019) and played a role in the results of the Brexit referendum of June 2016.
Cross-sectional and panel regressions performed on our sample of 201 TL2-corrected regions confirm that capital regions – and, to a lesser extent, regions containing a metropole of more than 500,000 inhabitants – have grown faster than average, thereby contributing to regional convergence across EU countries but also to within-country disparities. Agglomeration effects, such as concentration of higher-productivity activities and innovation, have likely played a role here.
Chart 4. In most EU countries, regions display heterogenous patterns of economic development
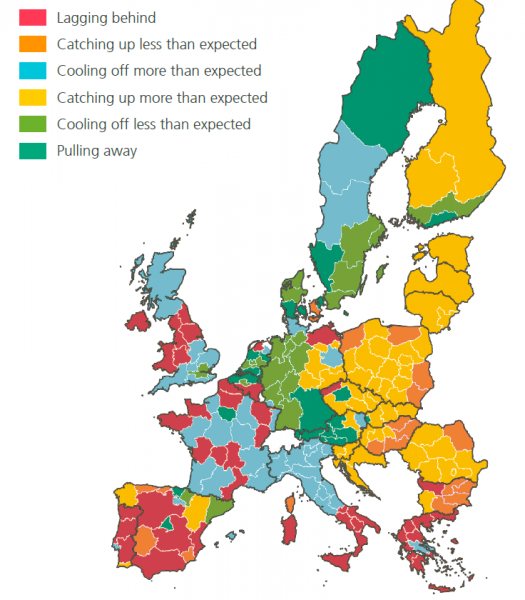
Source: EC (Ardeco).
At the time of writing up our study, the then available data (up to 2018) suggested the convergence machine had regained some speed recently. A data update shows that convergence was indeed strong in 2019. Since early 2020, the world has been facing the tragic human costs and dire economic consequences of the Covid-19 crisis and what IMF Chief Economist Gita Gopinath has called the “Great lockdown” (IMF, 2020). As regards the EU, the crisis first affected Italy and subsequently spread to all other EU countries. While all economic sectors have been impacted, transport, hospitality and tourism have been particularly hit, with severe consequences for countries relying most on tourism activities such as Italy, Spain, Portugal, Greece and Croatia. Moreover, Italy and Greece have less fiscal space available to fight the economic crisis due to their already high public debt stocks. These countries already found themselves below EU average income levels in 2019, and we might expect them to diverge further over 2020 and 2021.
With the caveat in mind that current economic forecasts are surrounded by extreme uncertainty (given the many unknowns about Covid-19’s further trajectory and countries’ policy responses), we use the GDP per capita growth projections of the latest EC Spring 2020 Forecast to provide a first assessment of how EU convergence might evolve over 2019-2021.
Chart 5. The Covid-19 crisis and recovery are currently not expected to prevent further convergence across the EU28 but divergence among the EU15 cannot be excluded
(GDP per capita in PPS, expected change over 2019-2021 versus level in 2019 relative to the EU average)
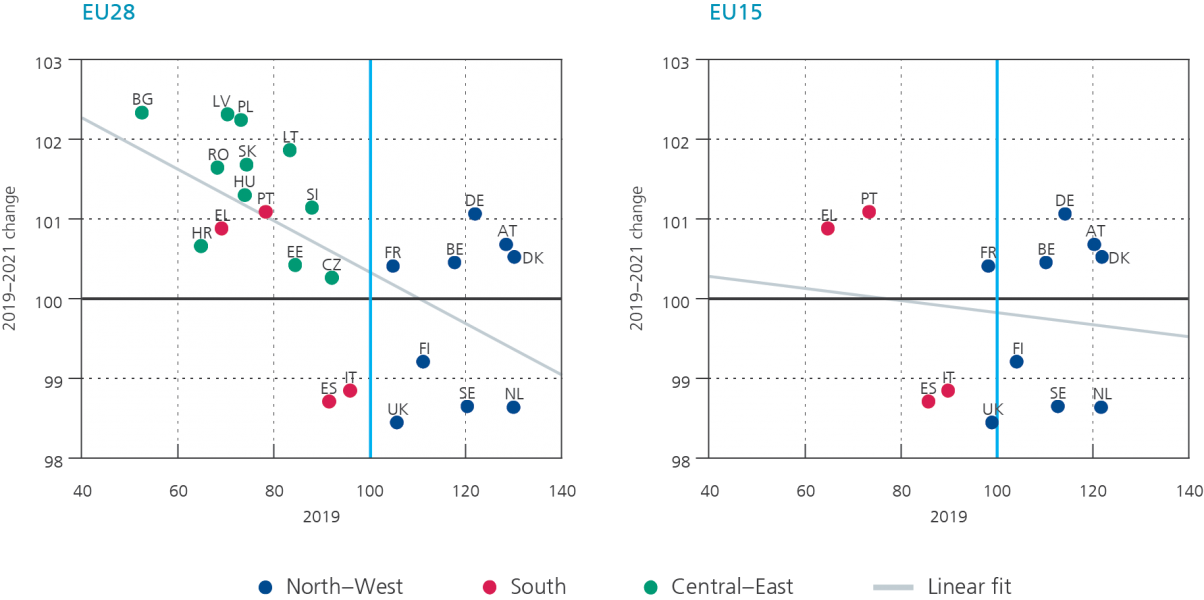
Source: EC (Ameco, May 2020).
The negative slope of the linear fit in the left-hand part of Chart 5 suggests that, based on the EC Spring outlook, we may expect national convergence across the EU28 to continue. This result is explained by the fact that all CEE economies are projected to continue catching up and that in some North-Western countries, GDP per capita is forecasted not to recover its 2019 level by 2021.
If the CEE countries are excluded and only the EU15 countries are considered (right-hand side of Chart 5), the slope of the linear fit between income growth over 2019-2021 and initial income levels in 2019 is much flatter and no longer statistically significant. This is in part due to the expected lagging behind of Italy and Spain. In the end, there may well be economic divergence across the EU15 over 2019-2021, either if Greece and Portugal are more severely hit and/or take longer to recover than is currently expected by the EC, or if the Netherlands and Sweden are less severely hit and/or enjoy a stronger than expected recovery.
At the time of finalising this note, no post-Covid update of the regional forecast by the EC was available. Making an educated guess on the impact of the Covid-19 crisis on regional convergence is all the more difficult because of the various forces at play. As also noted by the OECD (2020), factors include, among others:
According to the OECD (2020), the regions where more than 40 % of jobs are potentially at risk include touristic destinations. In terms of convergence, this would further depress the economic performance of regions that are already lagging behind, like Crete, and the South Aegean and Ionian Islands, while it would also hurt catching-up regions such as Algarve or richer, cooling-off regions like the Balearic Islands. Capital regions too are found to have a larger share of jobs potentially at risk in the short term than other regions in the same country, because the confinement measures weigh particularly hard on retail (other than food and pharmacies) and wholesale trade, hospitality, and personal services (hairdressers, etc.), which all tend to account for larger employment shares in these densely populated areas. If pulling-away regions like Paris, Madrid or Prague are hard hit, this may actually “help” the convergence process across the EU. If rapidly catching-up regions like Vilnius or Bucharest are struck, then convergence would be penalised.
However, capital regions also tend to have a more diverse economy and a larger pool of skilled labour. This may help them in adapting to shocks and could facilitate the bounce-back of their economies. At the same time, capital regions often have the lowest shares of jobs at risk of automation (a process that may accelerate in the aftermath of the Covid-19 crisis).
Based on the findings of our research, some lessons can be drawn for economic policy.
First, convergence in the run-up to the global financial crisis and the European sovereign debt crisis proved to be unsustainable in some Southern EU Member States, pointing to the importance of avoiding excessive imbalances and ensuing boom and bust cycles. Completion of the EU integration process and further improvements in the design of the European project, including the completion of the Banking Union and the Capital Markets Union, may also be needed.
Second, even if further convergence is expected in the EU28, thanks to the fast catching-up and greater resilience to the Covid-19 crisis of CEE Member States, divergence is a real possibility in the EU15 and the euro area in the period 2019-2021. Southern Member States are facing particularly severe economic and social fallouts from the Covid-19 crisis. This requires strong European solidarity. Meanwhile, these and other EU Member States should continue to tackle their structural weaknesses, with a view of increasing potential growth. In that context, our research also finds that investing in physical and human capital can improve growth performance at both the national and regional level.
Third, the observation that, in most EU countries, regions display heterogeneous patterns of development suggests a need for “place-sensitive regional policies”, tailor-made to the specific situation of each region (as recommended by, among others, Iammarino et al., 2019). Indeed, optimal policy instruments arguably differ for regions that are lagging behind or catching up. They may also differ between capital, metropolitan and non-metropolitan regions, as well as urban versus rural regions (see Garcilazo and Oliveira Martins, 2020). To this end, there is a role for policies at different levels of power. Next to national and regional authorities, the EU can play a role by boosting the efficiency of its cohesion policy, which is one of the issues for discussion in the Multiannual Financial Framework 2021-2027.
Convergence was recognised as one of the main objectives when the EU was created. In order for the European project to be successful and earn the support of its citizens, no country or region should be left behind.
Bisciari P., D. Essers and E. Vincent (2020), “Does the EU convergence machine still works?”, National Bank of Belgium Economic Review, https://www.nbb.be/en/articles/does-eu-convergence-machine-still-work-0
Dijkstra L., H. Poelman and P. Veneri (2019), The EU-OECD definition of a functional urban area, OECD Regional Development Working Papers 2019/11.
Dijkstra L., H. Poelman and A. Rodrí guez-Pose (2019), “The geography of EU discontent”, Regional Studies, DOI: 10.1080/00343404.2019.1654603.
EC (2020), European economic forecast, Spring 2020, institutional paper 125, May.
Garcilazo J.-E. and J. Oliveira Martins (2020), “New trends in regional policy: place-base component and structural policies”, in Fischer M.M. and P. Nijkamp (eds), Handbook of Regional Science, Springer-Verlags GmbH Germany, DOI: 10.1007/978-3-642-36203-3_139-1.
Iammarino S., A. Rodriguez-Pose and M. Storper (2019), “Regional inequality in Europe: evidence, theory and policy implications”, Journal of Economic Geography, 19(2), 273-292.
IMF (2019), “Closer together or further apart? Subnational regional disparities and adjustment in advanced economies”, World Economic Outlook, October, chapter 2.
IMF (2020), “The Great Lockdown”, World Economic Outlook, April, chapter 1.
OECD (2020), Coronavirus (COVID_19) From pandemic to recovery: Local employment and economic development, OECD Centre for Entrepreneurship, SMEs, Regions and Cities, 27 April.