The risk asset reaction to the coronavirus shock has been of an order of magnitude similar to the GFC, although more recently risky assets have regained a substantial part of their initial losses. The important question for judging the market reaction is not whether this will be a V-, U- or L-shaped downturn and recovery, but whether the overall macro impact will itself be of an order of magnitude similar to the GFC. Global economic activity is not simply slowing or contracting – it is deliberately being frozen and halted. Doing this at the global level is unprecedented. The near-term decline in measured activity will be worse than during the GFC. There has just never been such a systematic attempt to shut down activity on such a scale before. Making sense of the macro implications here is not an exercise in minutiae. What we need is to understand the orders of magnitude involved – distinguishing between the impact being “5x” and not just “x”, both on the downside and upside.
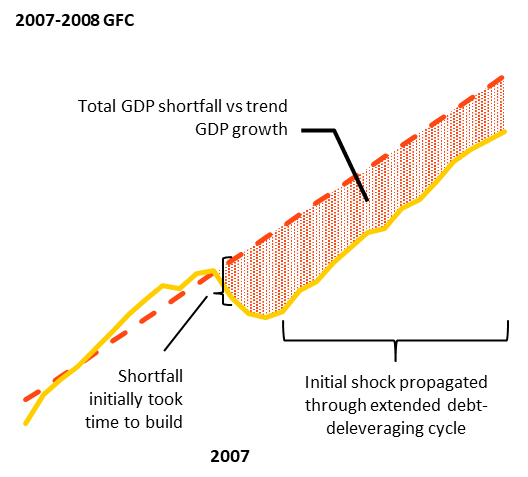
Yet it would be a mistake to extrapolate this impact to the response of risk assets. What matters to long-term asset valuations is not the impact on profits and revenues from such a growth shortfall over a quarter or two – it’s the impact over several quarters and years, in our view. And that’s why the propagation matters. The stylized charts below sketch out how we believe this shock should be assessed and put into the context of the GFC. This starts by distinguishing between the 1) shock and 2) its propagation. Both are very different from the GFC. In 2008, the shock’s spark was in the financial system and the impact on real activity was indirect and more uncertain. The main growth consequence of the GFC was not the shock itself – the recession – but the propagation: a major decline in activity relative to its pre-shock trend caused by large-scale debt deleveraging and the unwind of imbalances over many years. The cumulative post-GFC growth shortfall in the US totalled about 50% of pre-crisis GDP level – and most of it came well after the initial shock. See the chart below. If we accounted for the permanent downshift to potential growth, the shortfall would be on a different scale altogether.
Yet as we sketch out in the right chart below, most of the damage in 2020 and beyond is likely to come from the shock itself: about 5% through Q3 relative to its pre-shock 2019 trend, based on our median estimate of a Reuters News poll trimming some of the extremes – more than twice the initial shock in the GFC. But this is a very different global downturn. It emanates directly from the real side of the economy and is very visible, large and sudden. Given its nature, the typical business cycle-approach to tracking recessions and recoveries doesn’t work in this situation. Past quarterly activity dynamics provide no information to help shape estimates of what will happen in the next few quarters.
Moreover, this shock has structural implications that go beyond the cyclical. It could lead to permanent changes in consumer and corporate behavior that would imply sectoral adjustments. These changes don’t have to destroy aggregate economic activity, but similar to the impact of technological innovation they will create winners and losers.
We lay out the orders of magnitude involved based on the current – and quickly changing – consensus numbers below.
A significant shock
Hypothetical hit to U.S. trend GDP in coming years compared with the GFC experience
 |
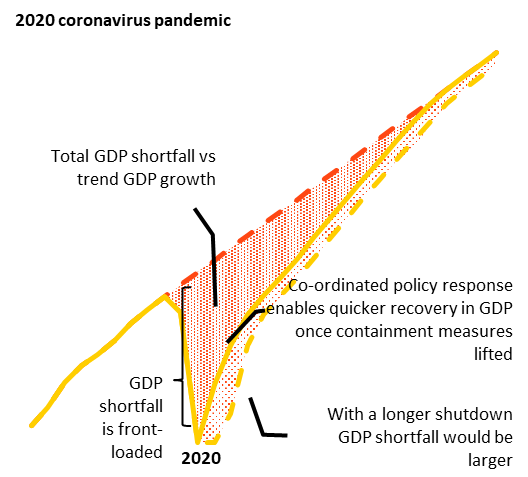 |
Sources: BlackRock Investment Institute, with data from Haver Analytics, April 2020. Notes: These stylized charts show how GDP can evolve relative to trend after a shock. The dotted lines show what trend GDP would have looked if there had been no shock. We compare with the 2007-2008 global financial crisis to the current coronavirus shock. In 2007-2008, the initial shock – 2.3% of GDP from Q3 2008 to Q1 2009 – was not as large as the current one we expect. The GFC shock propagated through debt deleveraging that served as a longer-term drag on pre-trend potential growth. The chart on the right shows that the GDP shortfall from this shock is front-loaded, and if containment measures are lifted there can be a quicker recovery with limited permanent damage to the pre-shock growth trend. For illustrative purposes only. There is no guarantee that any forecasts made will come to pass. The hypothetical scenario is subject to signification limitations, in particular that this is an evolving situation and we are still trying to understand the potential for more extensive activity shutdowns due to the virus.
In 2020, the initial propagation is not about amplification through the financial system. In fact, the financial system was in relatively robust shape heading into this shock and household balance sheets healthier. Instead, the propagation is directly linked to the evolution of the virus itself and how long containment measures need to be kept in place. There is much uncertainty around the pathways of containment measures, including the risk of multiple outbreak waves. This is clear from the wide range of current forecasts for annualized quarterly GDP changes in the chart on the left below. This is why risk asset volatility will likely remain high – and we remain tactically cautious for now.
Economic forecasters typically play catch up with reality when the business cycle turns south. This may be true again this time. But what is also remarkable is how quickly forecasts have adjusted – and the sheer magnitude of the contraction already assumed. All of the estimates below are already assuming that this will be the worst quarter in history. The numbers are staggering. On an annualized basis, our adjusted range of estimates from a Reuters News poll – trimming outliers – sees real GDP contracting between 15% and 65% in Q2. Such a range only underscores the sheer uncertainty – see the charts and chart notes below. Prior to this, the worst quarter in modern history was -10% in 1958. Most of these forecasts assume a rebound in Q3. That would require hard containment measures not extending much beyond three months. But it is also important to realize that, given the speed of decline in Q2, it doesn’t take too much to engineer a mechanical rebound – and a sharp one. Once activity is stopped, even a small fraction of activity coming back online is enough to generate a sizable growth bounce.
But what ultimately matters for the valuation of risk assets and for longer term investors is the cumulative impact of the shock. And given the size of the near-term shock, it is easy to lose sight of scale. If income-bridging and debt-forbearance policies can be effectively implemented to help prevent financial stresses from creating permanent damage (see further below), the cumulative impact of the coronavirus shock – the median estimate is for a 15% shortfall to 2019 GDP – will be a fraction of the 50% shortfall suffered in the years after the GFC, in our view. See the chart on the right below.
The freezing of economic activity could create permanent damage – and the risks are larger the longer the freezing lasts. This permanent damage could come from the destruction of organizational capital due to companies disappearing and a sharp severing of relationships between employees and employers. An extended interruption could morph into a financial crisis-type propagation if it were to lead to an unprecedented wave of corporate insolvencies, putting pressure on the banking system. That is why policy is key: a broad range of policy measures are needed to bridge cash flow pressures by backstopping household incomes and SMEs. These have come together more quickly in major economies than EM. Successful execution of these income-bridging measures is critical – not just promising funds but delivering them in a timely way. Coordination with monetary policy is needed – and happening – to limit any increase in long-term interest rates that would result from such a rapid build-up of debt. We discuss this more further below.
The bottom line: The initial risk asset response – equities down 30-40% across the world – has been on an order of magnitude similar to the GFC. The cumulative impact of the macro shock is still expected to fall well short of that suffered after the GFC, assuming that it can be contained in a reasonable timeframe. Even with a record-sized contraction over one or two quarters, the shortfall may only be a fraction of that caused by the GFC.
Putting a historic U.S. contraction in context
Hypothetical U.S. GDP decline in annualized quarterly changes and the overall shortfall from 2019 levels, 2020-2023
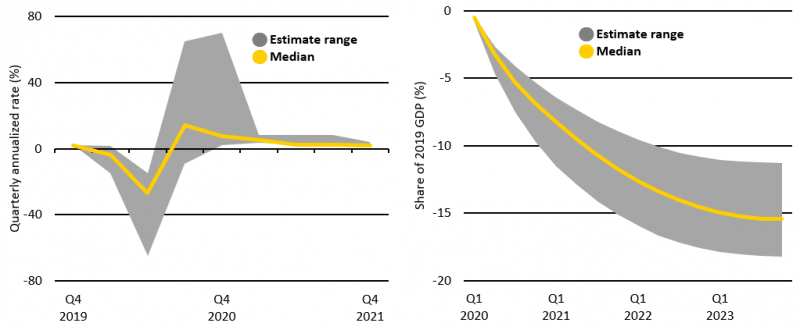
Sources: BlackRock Investment Institute and Reuters News, with data from Haver Analytics, April 2020. Notes: These charts show hypothetical U.S. GDP quarterly annualized changes through Q1 2021 and the total shortfall of U.S. GDP relative to 2019 levels over the next three years based on a Reuters poll of economists. We use the Reuters poll of economists published on 3 April 2020 but trim the overall sample by taking the estimates within the 20th and 80th percentiles to reduce extreme outliers or stale forecasts. We derive our range of estimates and median from this adjusted sample of 41 forecasts out of the original 54 forecasts. There is no guarantee that any forecasts made will come to pass. These hypothetical scenarios are subject to significant limitations given the uncertainties surrounding the virus outbreak.
We are expecting a deep but relatively short global downturn due to the coronavirus shock. Even with a sharp rebound in the second half of the year, there can be no mistaking the very sizeable drop in income taking place right now.
The resulting cumulative shortfall in income will likely total in the trillions of dollars for major economies by the end of this year. That is why fighting the macro shock likely requires fiscal and financial support of a bigger magnitude than in 2008/09. The size of the required government bailouts might also have to be larger than during the GFC if governments directly rescue non-financial companies rather than banks, who tend to be more leveraged and where capital injections are thus more powerful. We estimate that the required bridging policies for the U.S. alone will total at least $2 trillion in fiscal spending and a further $1-2 trillion in loan guarantees (see the second chart below), which could increase debt-to-GDP to 130-140%. See the analysis further below.
The decline in activity initially depends on the length and extent of the social shutdown needed to slow down the virus spread to a level consistent with the capacity of the healthcare systems. There is a trade-off between draconian distancing and the slowing of the virus outbreak. And there are two main factors in assessing the potential economic fallout. The first: the capacity of the system to treat the severely ill, which varies materially between countries. These differences could mean that lockdowns will be lifted on different timescales. The second: the setup of existing financial safety nets, the new programs introduced by policymakers and the private sector’s pre-virus financial buffers. Together these two factors will determine a large part of each country’s economic resilience. A sharp rebound in economic activity in the second half of the year requires not only success in containing the virus itself, but also limiting job losses and corporate insolvencies – and any resulting financial stress.
There are other downward pressures on growth. The plunge in oil prices is likely to hurt investment, especially in the U.S., on top of the coronavirus shock. And corporates were among the most leveraged of economic actors going into it. But the big focus is on services and consumers given their large role in activity and the direct hit from the broad shutdowns. Across developed markets (DM), we could easily see declines in consumer spending of around 5-10% in a bad-case scenario (that many services see declines to just 25-50% or less of normal activity during the shutdowns). This is more than double the decline seen during the GFC.
Postponing an auto or furniture purchase could lead to pent-up demand later. But much of the discretionary spending on leisure, travel and transportation will be permanently lost. Data on DM consumption baskets suggests the share of lost spending could be large: a basket of social consumption items – mainly services such as holidays, restaurants, transport and recreational services – accounts for between a fifth to a quarter of total consumption in the U.S. and Europe. See the chart below.
Service sector strife
Shares of consumption baskets most vulnerable to social distancing measures
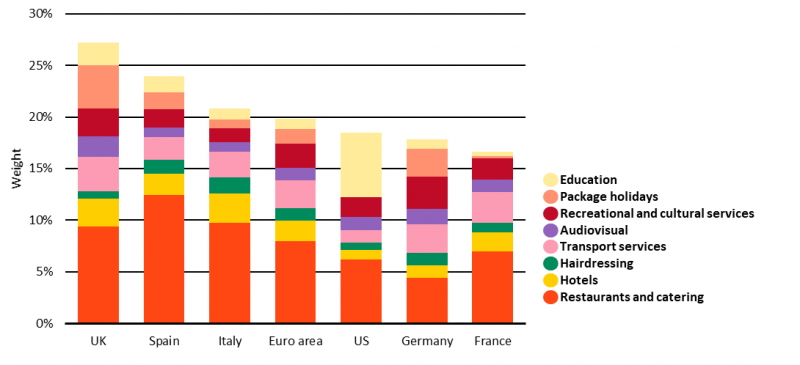
Sources: BlackRock Investment Institute, with data from Haver Analytics, April 2020. Notes: The chart shows the share of consumption baskets in DM economies that are most vulnerable to social distancing measures. For the U.S, the weights are from the Consumer Price Index for All Urban Consumers (CPI-U) categories. For the other economies, the Harmonised Index of Consumer Prices is used.
Filling the gap
Global fiscal measures as a percentage of GDP, 2020
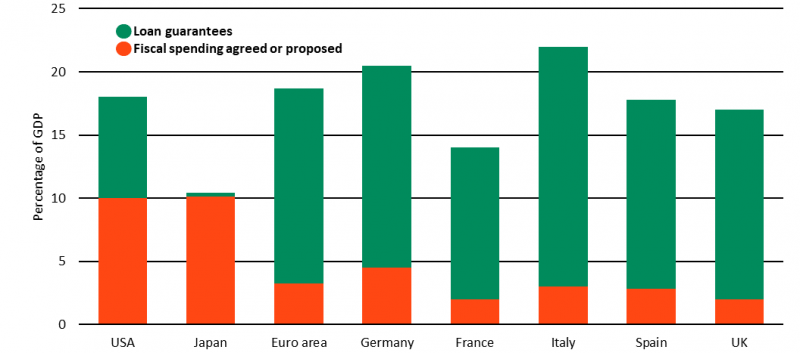
Source: BlackRock Investment Institute, with data from Refinitiv Datastream, April 2020. Notes: The chart shows actual and expected fiscal spending measures and actual loan guarantees across certain developed market economies.
The goal of the policy response is not to stimulate spending because consumers don’t lack the willingness to spend in this emergency but are instead prevented from doing so. The broader policy response is to plug the revenues and cash flow holes that could otherwise lead to a cascade of defaults.
The scale needed is large. For example, in the U.S. the shortfall in U.S. dollar terms could total $1.5 trillion for 2020. Moreover, there are several reasons why the fiscal policy response needs to exceed the amount of cumulative income loss. First, government programs will likely not be sufficiently targeted to the households or companies that urgently need support. Second, the private sector saving rate has historically increased materially during downturns – and we would not expect the coronavirus crisis to be different. Third, any delay in the policy response will cause a negative multiplier effect that the government will need to offset. Over the past few weeks, policymakers have realized the scale of containment measures necessary and the resulting economic damage they might entail. This has prompted ever-increasing pledges of fiscal support, with some striking examples of effective coordination between fiscal and monetary policy, such as in the UK, Australia and Canada.
Many central banks have either explicitly committed to open-ended bond purchases or signalled that existing proposals could be expanded. And many central banks have introduced credit easing measures that target the sectors most affected by the pandemic, especially SMEs. Alongside these measures to alleviate some of the macroeconomic impact, central banks have also targeted market pricing dysfunction and a sharp tightening in financial conditions with a wall of liquidity and raft of facilities to ease affected markets, especially in the U.S. and related to U.S. dollar funding in the rest of the world.
The accompanying fiscal response has also been ambitious. With the U.S. fiscal package now in place, we expect total DM fiscal support is likely to top the GFC and be among the largest in peacetime – yet in a very compressed timeframe. See the chart above. Fiscal measures have focused on making up part of the lost income or credit flow to households and businesses affected by the disruptions. For example, the UK has taken the step to cover 80% of the wage bill of workers in sectors affected by the pandemic, including the self-employed. Germany has proposed measures to make up the pay shortfall from short-time working shifts covering an expected 2.5 million workers – compared with 1.5 million during the GFC. The European Union is now planning to mimic Germany’s program with something similar for all 27 member countries and fund it with €100 billion of borrowing. In the U.S., the main thrust of the $2 trillion measures covers expanded unemployment insurance covering up to 100% of lost income, loans to small businesses to enable them to retain workers, and direct payments to households. This includes $50 billion to help the most severely hit large firms and sectors, such as airlines.
Direct fiscal spending support in the order of 10% of GDP – as illustrated above – seem necessary, and more may be needed over time. So in many countries, we need to assume either a significant losses on the loan guarantees. Otherwise more direct spending support will be required.
The sheer size of the fiscal support measures is stark: between 5-10% of GDP in combined deficit spending, transfers and other measures for the U.S. and Europe. This has major implications not just for debt trajectories and interest rates but also the excess global savings that has been an important factor driving the decline in interest rates. This is a clear challenge to the interplay between global saving and interest rates over the past few decades. A structural rise in risk aversion has played an important role in pushing interest rates down as investors favor the perceived safety of highly liquid government bonds. Such a safety premium has magnified the drop in rates and compressed the term premia in long-term bonds. The coming surge in bond issuance could reduce this glut of savings and remove it as a factor still keeping bond term premia in negative territory. With uncertainty so high in the near-term, risk aversion and the demand for perceived safe assets will remain high. But a surge in debt levels could prompt a more fundamental reassessment of the perceived safety qualities of some government bonds.
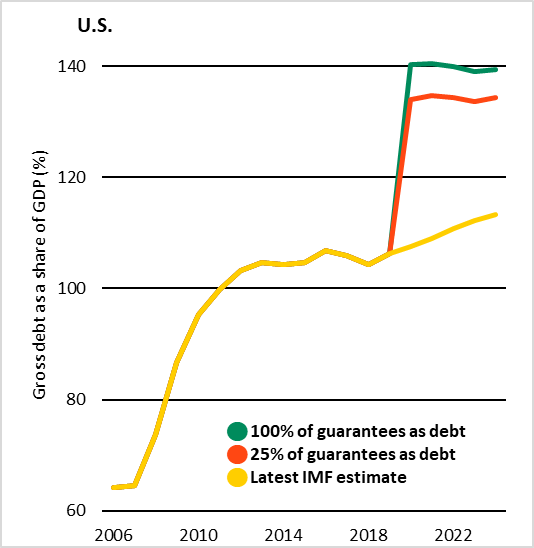
Based on the median estimates of the likely GDP shortfall together with these fiscal measures (including the automatic stabilizers from lower tax revenue and higher welfare spending), we can easily see the debt-to-GDP ratio of the U.S. rise to 130-140% and that of the euro area’s biggest economies climb to 100-120%. See the charts below. We take pledged fiscal spending and make some simplified assumptions about which debt guarantees that governments may end up covering as a share of their current promises and what it would mean for debt levels – even if such estimates are inherently uncertain right now.
That is why central banks may need to implement policies capping long-term yields given the potential for higher debt issuance to push up long-term interest rates. We have previously outlined how such a coordinated policy could work – see Dealing with the next downturn from August 2019. This is taking shape across major economies. Without appropriate coordination with monetary policy, rising debt levels and a reduced safety premium will likely put upward pressure on government bond yields. Academic studies (including Gamber & Seliski 2019, Laubach 2009 and Gale & Orszag 2004) have suggested that – all else equal – a 1 percentage point increase in the projected debt-to-GDP ratio has historically been associated with an increase of about 3 basis points in the forward 10-year real Treasury yield. If the U.S. debt jumps to about 130% of GDP from the current 100% of GDP, all else equal, this would put about 100 basis points of upward pressure on the 10-year real Treasury yield over the next few years. Last year, our estimate of the term premium – and update of the method we used in our November 2017 publication on the safety premium – in long-term U.S. Treasury yields averaged about -50 basis points, hitting new lows. If this term premium were to climb, it would add to the upward pressure on long-term yields. It is unclear how much of these upward pressures will materialize, but it is a risk that central banks will need to actively manage by leaning against unwarranted back up in yields through their asset purchase programs.
Funding the fiscal support
U.S. and major euro area-economy debt-to-GDP ratios under different assumptions, 2006-2023
 |
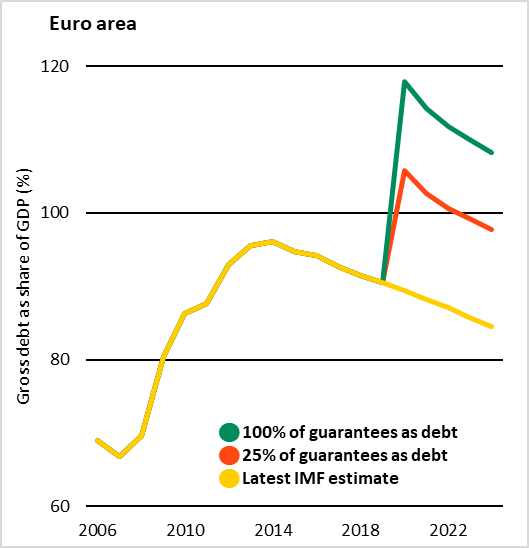 |
Source: BlackRock Investment Institute, IMF, Congressional Budget Office and European Commission, with data from Haver Analytics, April 2020. Notes: This chart shows our projection for the debt-to-GDP ratios for the U.S. and euro area top four economies (Germany, France, Italy and Spain) where 100% of loan guarantees announced so far are counted as gross debt (green line) and where 25% of loan guarantees are counted as gross debt (red line). The yellow line shows the IMF’s projections from October 2019. There is no guarantee that any forecasts made will come to pass.
BlackRock disclosure
This material is reprinted with permission of BlackRock. This material is intended for professional and institutional clients only. The opinions expressed in this reprint are not intended to be relied upon as a forecast, research or investment advice, and is not a recommendation, offer or solicitation to buy or sell any securities or to adopt any investment strategy.
The opinions expressed are as of April 2020 and may change as subsequent conditions vary. The information and opinions contained in this material are derived from proprietary and nonproprietary sources deemed by BlackRock to be reliable, are not necessarily all-inclusive and are not guaranteed as to accuracy. As such, no warranty of accuracy or reliability is given and no responsibility arising in any other way for errors and omissions (including responsibility to any person by reason of negligence) is accepted by BlackRock, its officers, employees or agents. This material may contain ’forward looking’ information that is not purely historical in nature. Such information may include, among other things, projections and forecasts. There is no guarantee that any forecasts made will come to pass. Reliance upon information in this material is at the sole discretion of the reader. You can access the original article here.
Capital at risk: The value of investments and the income from them can fall as well as rise and are not guaranteed. The investor may not get back the amount originally invested.
Past performance is not a reliable indicator of current or future results and should not be the sole factor of consideration when selecting a product or strategy. Changes in the rates of exchange between currencies may cause the value of investments to diminish or increase. Fluctuation may be particularly marked in the case of a higher volatility fund and the value of an investment may fall suddenly and substantially. Levels and basis of taxation may change from time to time.
©2020 BlackRock, Inc. All Rights Reserved. BlackRock® is a registered trademark of BlackRock, Inc., or its subsidiaries in the United States and elsewhere. All other trademarks are those of their respective owners
Authors:
Elga Bartsch – Head of Macro Research, BlackRock Investment Institute
Jean Boivin – Head, BlackRock Investment Institute
Philipp Hildebrand – Vice Chairman, BlackRock
Contributors: Nicholas Fawcett – Macro research, BlackRock Investment Institute
Liutauras Petrucionis – Macro research, BlackRock Investment Institute
Tara Sharma – Investment strategy, BlackRock Investment Institute