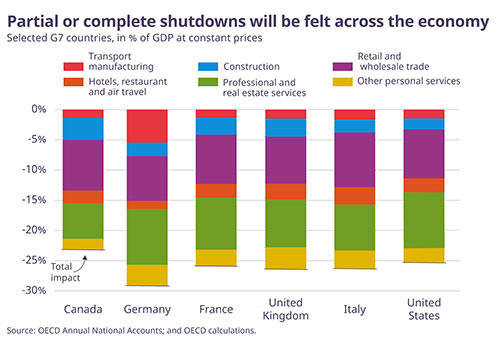
IMF Managing Director Georgieva predicts “a global recession in 2020 at least as bad as the Global Financial Crisis or worse” – but expects a recovery in 2021.2 Recently published expert and market forecasts for euro area growth in 2020 range from ‑1.6% (ifo)3 to -9.9% (Morgan Stanley)4 while forecasts published earlier by international organizations are no longer valid. In G7 countries, output initially fell by roughly one quarter as a direct impact of the shutdown according to OECD calculation, which translates into up to 2% for each month that the crisis continues, and around 5% of GDP for each quarter. The IMF’s estimates even show a monthly loss of 3% of annual GDP.
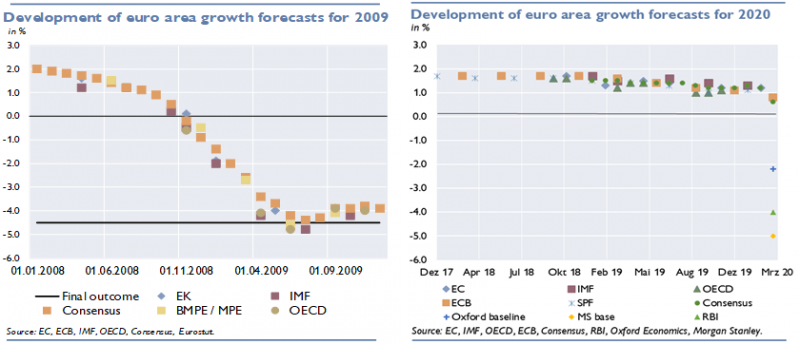
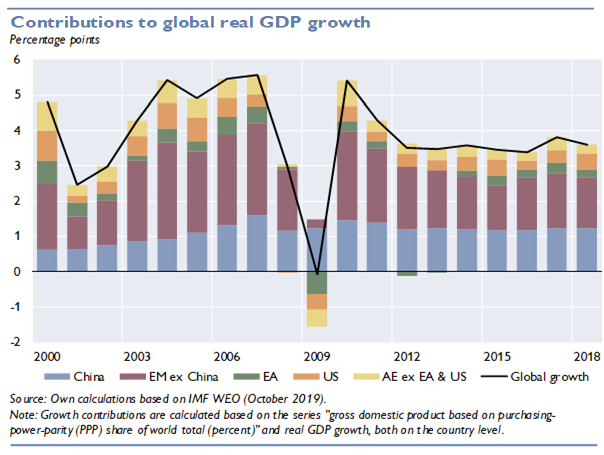
In the 2009 recession, official forecasters were slow to adjust, with their projections failing to converge toward the final outcome (‑4.5%) before mid-year. This time, adjustment is much faster. Although difficult to compare, the two crises share some similarities: strong impact on manufacturing and finance, high relevance of trade, all euro area countries affected (yet not equally vulnerable), strong government reaction. Nonetheless, there are significant differences: this time the crisis unfolds much faster; services play a central part alongside manufacturing; finance is only an amplifier, not a trigger, with the focus being on shadow banking and corporate debt; banks may, however, play a role as shock absorbers, as they are better capitalized now; China may not drive the post-crisis recovery of the world economy this time; emerging and developing economies are probably more vulnerable; on a positive note, EMU may benefit from a crisis framework with safety nets.
The Spanish flue of 1918/19 triggered a recession similar in magnitude to the 2009 recession yet is hardly comparable to the current pandemic, given the economic stimulus created by continued war production then and progress made in public health since.
Published forecasts of official institutions are unavoidably behind the curve due to their longer publication intervals and their rather cautious approach given the responsibility that comes with their authority. So far, only two official institutes (OECD and ECB) have provided forecasts for the euro area economy after the COVID-19 outbreak in Europe. The OECD estimated (on March 2) a weak GDP growth of +0.8% in 2020 but highlighted the possibility of a recession in its broader contagion scenario (no figures displayed). Yet, OECD Secretary General Angel Gurria also called the pandemic the “greatest economic, financial and social shock of the 21st century.” The ECB too officially forecast +0.8% (on March 5), implying a rather modest downward revision partly due to early cut-off dates.
Economic actors seeking guidance in rapidly changing crisis times, however, must resort to predictions available from local think tanks or market institutes. Among the German economic expert institutes, the ifw was first to release an update (on March 11), expecting negative growth of -1.0% for the euro area in 2020. The ifo (on March 19) already projected as much as ‑1.6%, and the Austrian IHS followed with -2.0% (on March 26). The ifo published a scenario forecast for Germany (on March 22), according to which economic output could shrink by a range of ‑7.2 to ‑11.2; or by a range of ‑10.0 to ‑20.6 percentage points compared to the baseline, depending on whether the partial standstill of the economy lasts two or three months, respectively.5
Recent market-produced forecasts point toward an even deeper fall into negative territory. Market forecasters typically provide two or three scenarios with deviating assumptions reflecting the high degree of prevailing uncertainty. Most importantly, those scenarios differ in the assumption on how long the shutdown will last, determining the shape of the curve (V, U or L). At present, even the baseline forecasts are rather pessimistic. For 2020, Raiffeisen Bank International (March 18) projects a decline of ‑4%. Oxford Economics (March 20) anticipates ‑2.2% in its baseline and ‑3.2% in its downside scenario. Morgan Stanly Research goes even further, seeing annual GDP declining by ‑1.5% in its ‘bull case’, by ‑5.0% in its base case, and by -9.9% in its ‘bear case’. The three cases are distinguished by the length of the recession (one, two or three quarters).
Multiple channels of crisis transmission
Earlier forecasts (OECD) saw the crisis rather as a supply-side phenomenon, pointing to the special role of China regarding global supply chains, travel and commodity markets. More recent forecasts built on the even larger effects of shutdowns of up to two-thirds of services and industries all over the world, implying a huge demand-and-supply impact; whose combined nature is yet to be better understood (Fornaro and Wolf, 2020).6 Additionally, the most unpleasant cases also price in the financial disruption, above all, due to pervasive uncertainty putting almost all investment decisions on hold. In contrast, government and central bank action is acknowledged to slow down the decline and to preserve a minimum level of trust and liquidity in the economy. However, the demand-supporting component of the measures will not be fully effective in boosting the recovery until the health crisis is over. This highlights the unprecedented degree of uncertainty of the current crisis. In 2009 there was a lot of uncertainty about the magnitude of legacy assets buried in the balance sheets of key financial institutions, which at least left room for expert intuition. This time, however, economic policymakers are caught off guard, given the non-economic sources of the crisis.
First indicators
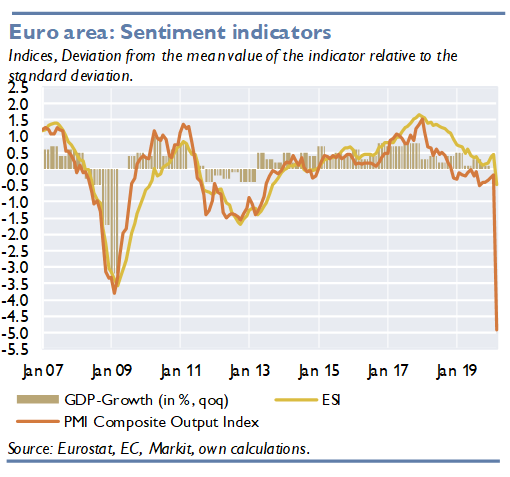
The Composite PMI for the euro area for March shows an extraordinary drop (flash release from March 24). Also, the Economic Sentiment Indicator (ESI) fell dramatically in the euro area (-8.9 points down to 94.5). Due to the outbreak of COVID-19, the data collection period stopped earlier than usual, and only approximately 15% of the consumer responses were collected after the strict confinement measures taken by the countries. Still, consumer confidence went below its long-term average for the first time in over five years.
An OECD analysis indicates that the magnitude of the initial direct impact of the measures to contain the epidemic is more severe than the contraction during the Global Financial Crisis (GFC).7 Their sectoral analysis suggests a decline in the level of output of between one-fifth to one-quarter in many economies, with consumers’ expenditure potentially dropping by around one-third. This estimate reflects neither any additional indirect impacts nor offsetting factors. The forecast developments correspond to a decline in annual GDP growth of up to 2 percentage points for each month of continued strict containment, and between 4 and 6 percentage points for each quarter of shutdown. IMF Director Thomsen expects the closure of nonessential services to account for about one-third of output.8 Hence, each month translates into a 3% drop in annual GDP, not considering other disruptions and spillovers to the rest of the economy. Bruegel, however, estimates that governments aim at absorbing up to 80% of the shock.9
Even if the COVID-19 crisis is hard to compare with the Global Financial Crisis (GFC), some lessons can be learned from such a comparison.
In the GFC case, a seemingly negligible turmoil in what was considered to be a rather remote segment of the U.S. mortgage market turned into a global financial and economic crisis from 2007 to 2008. After the fall of Lehman Brothers – a major U.S. investment bank – in September 2008 the ‘turmoil’ quickly turned into a run on international money markets.
A slump in global confidence and a compression of international trade flows followed. The financial sector and industrial sector were hit particularly hard. Industrial production as well as capacity utilization shrank throughout the currency area. All countries experienced a shrinkage of GDP in 2009. The unemployment rate rose; led by lay-offs in the industrial sector.
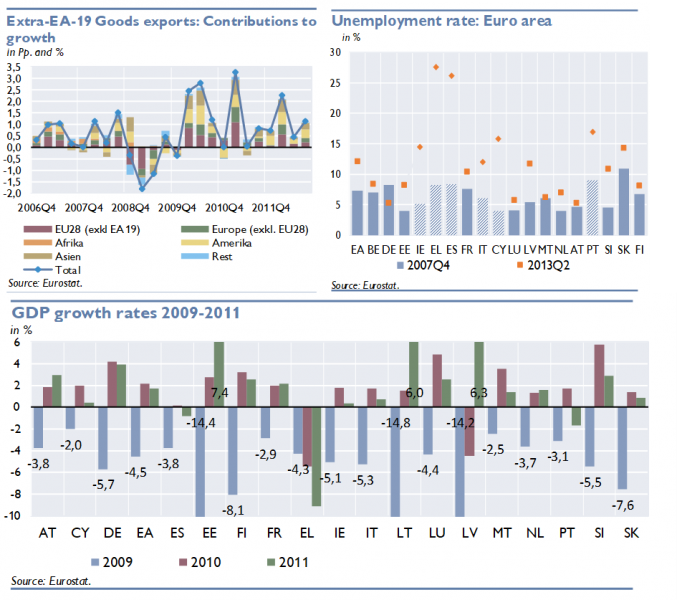
The crisis of 2009 was characterized by three key aspects:
It took long before forecasters captured the extent of the slowdown. U.S. house prices had started to decline in late 2006 but the trigger-event for the crisis becoming global (the collapse of Lehman Brothers) did not come until September 2009.
The 2008 winter forecast round was the first forecast round to see the euro area growth entering negative territory. Thereafter, forecasts did not converge toward the final figure (-4.5%) until summer 2009, shortly before half-year data were becoming available.
The Spanish flue is another often quoted benchmark for a COVID-19 recession. This pandemic of 2018/19 claimed a death toll of roughly 2% of the global population. Barro et al. (2020)10 estimate that the Spanish flu death rate corresponds to 6% decline of GDP. Interestingly, the results are correlated with a country’s real per capita GDP, implying a stronger impact on developing countries. However, comparison of the two pandemics has its limits since public health is in a much better shape today and since medical innovation allows for more effective treatment today than in the poor times after WW I, when many economies were sustained by war production (Reinhart, 2020).11
Key differences between 2008 and 2020 at a glance
| Sector | 2008 | 2020 | Illustration |
| Banking | • Highly leveraged • High profitability before the crisis • Sovereign-bank loop prolonged crisis in the EA |
• Smaller leverage in the EA • Existing resolution plans • Low profitability before the crisis • Sovereign-bank loop? |
|
| Shadow- banking |
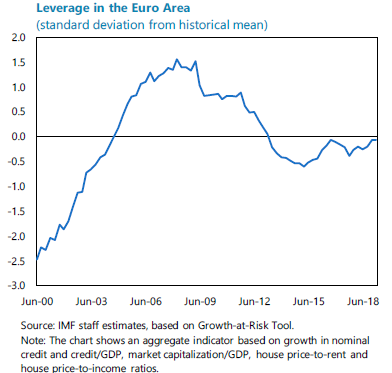
• Fueled the housing bubble in the U.S. • Run on shadow banking triggered crisis • Transmitted to the EA via money markets • Low degree of inter-connectedness in the EA (5.6% in 2006) |
• Considerably larger in the EA • Interconnectedness appears to be somewhat larger (8% in 2017) |
Total assets of the euro area financial sector (ratio to nominal GDP; March 1999‑June 2019)14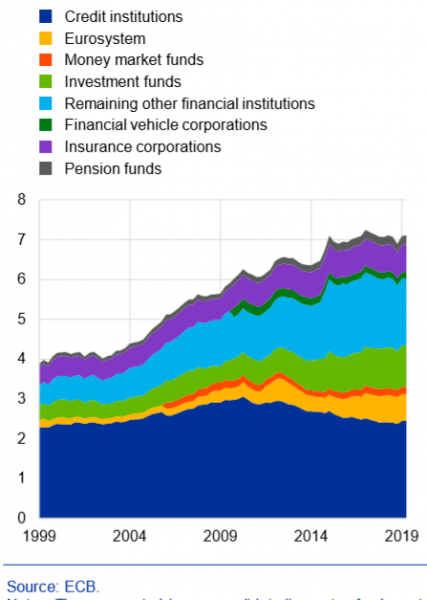 |
Inter-
national
trade• Considerable slump in world and extra-EU trade
• First trade credit cut-off
• Then driven by a slump in demand• Considerably larger slump to be expected
• Driven by more factors:
• (Larger initial) Fall in demand
• More non-tariff measures
• Revolving and unpredictable interruptions of value chains
WTO: World trade barometer15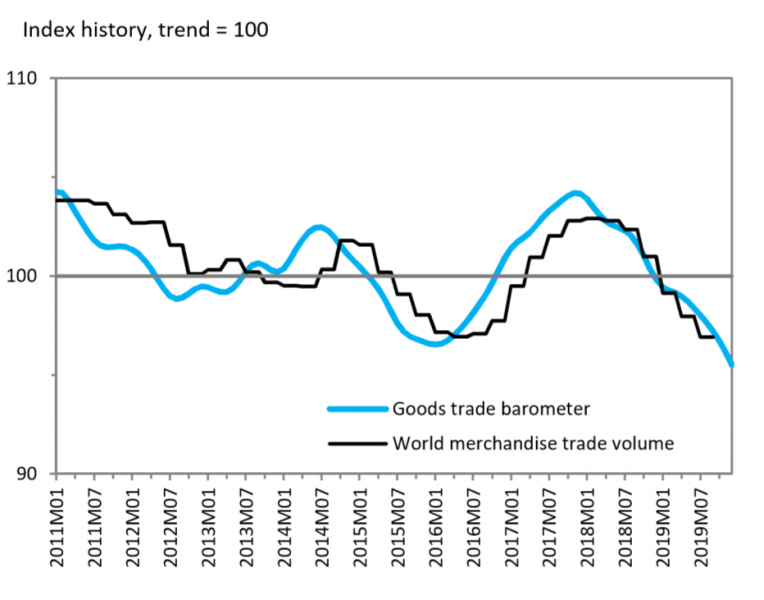
Manu-
facturing• Hit first and hardest, most of all by the decline in international trade• Affected by the decline in trade and the interruption of value chains
• Later by workers caring for schoolchildren, being affected or locked out
• Ultimately affected by drop in consumer demand due to lost income and forgone consumption opportunities 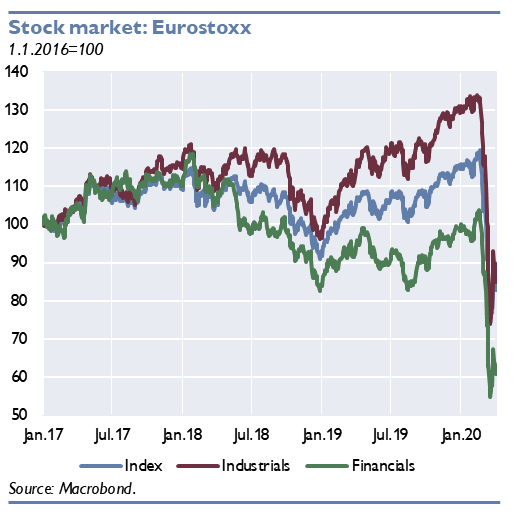 Services• Hit only in second round
• Public sector of crisis economies hit hard-est• Immediately and excessively hit by lockdowns (PMI dropping more than manufacturing)
• Some sectors (e.g. tourism) typically highly leveraged
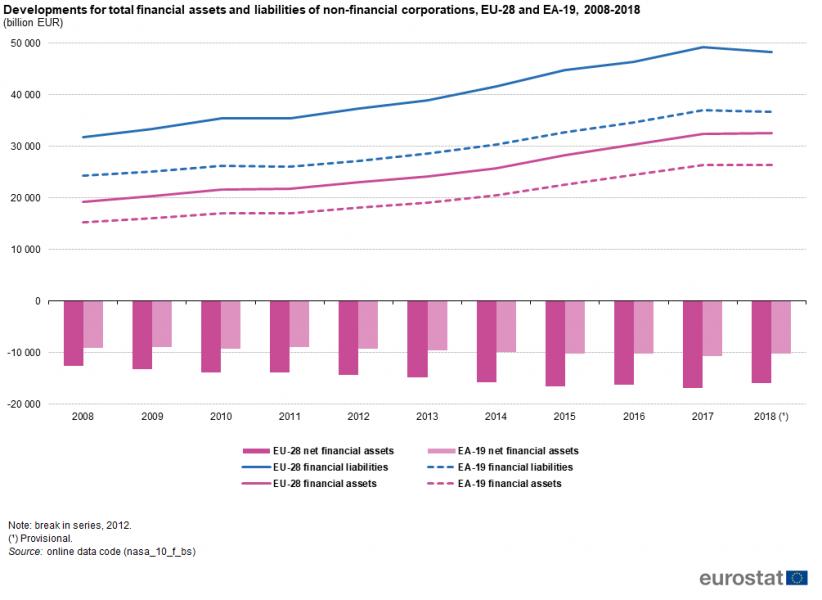
• No catch-up consumption to be expected 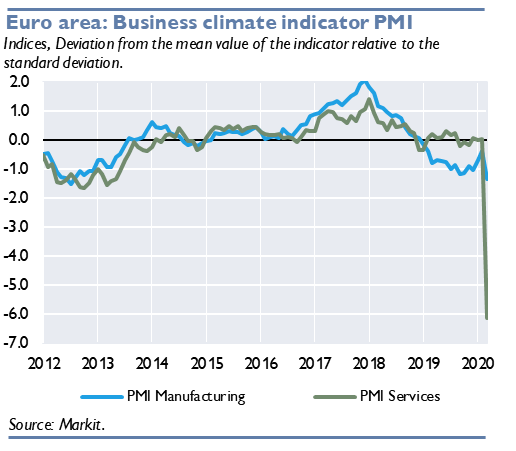 Corporate
sector • Relatively mildly leveraged• Historically high leverage
• Shale oil producers already overly indebted → oil price slump, chain reaction?
Emerging
markets• Broadly stable thought crisis
• U.S. dollar shortage at beginning of crisis
• China boosted global recovery in 2009/2010• EM even more effected by health crisis?
• Dollar shortage
• Total debt of devel-oping countries highest ever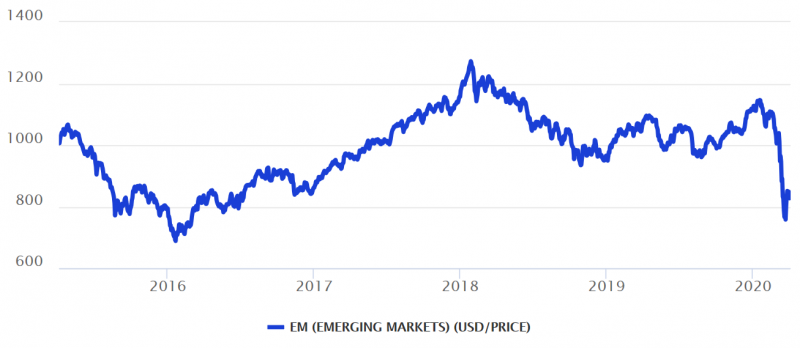
17Sovereigns • Caused double-dip recession
• Initially no collective crisis management framework• Italy: home bias even stronger
• ESM & OMT exist
• Rising yields on safe assets – troubling sign?
The length and the shape of the current recession (V or U, or even L) depends on the answers to following questions:
Opinions expressed by the authors do not necessarily reflect the official viewpoint of the Oesterreichische Nationalbank or of the Eurosystem.
We acknowledge the contribution of Anna Raggl (OeNB) to a previous version of this note.
Morgan Stanley Research, Global Weekly COVID-19 Impact Update: March 20, 2020.
https://voxeu.org/article/coronavirus-and-macroeconomic-policy
https://blogs.imf.org/2020/03/30/europes-covid-19-crisis-and-the-funds-response/
https://www.bruegel.org/2020/04/will-the-economic-strategy-work/
Barro, R., J. Ursua and J. Weng. 2020. The Coronavirus and the Great Influenza Epidemic – Lessons from the “Spanish Flu” for the Coronavirus’s Potential Effects on Mortality and Economic Activity. CESifo Working Paper No. 8166.
Reinhart, C. 2020. This time truly is different. Project Syndicate, 23 March.
https://unctad.org/en/PublicationsLibrary/gds_tdr2019_update_coronavirus.pdf?user=1653
Source: https://www.suerf.orgwww.IMF.org/~/media/Files/Publications/CR/2019/1EUREA2019001.ashx
Source: https://www.suerf.orgwww.ECB.europa.eu/pub/fie/html/ecb.fie202003~197074785e.en.html#toc14
Source: https://www.WTO.org/english/news_e/news20_e/wtoi_17feb20_e.pdf
Source: Eurostat
Source: MSCI Emerging Markets Index