We expect the ECB to adjust its inflation target to include housing costs. But implementation will take years for a modest impact: 15bp if done now, and just 4bp on average.
The case for inclusion: Owner-occupied housing (OOH) costs were not traditionally included in consumer price indices, given a lack of consensus on how to measure them, and separate out the cost of housing services from the cost of purchasing an asset. However, owner-occupied housing costs are a substantial portion of consumer expenditure, and a number of jurisdictions – including the US, UK, Germany and Japan – now include them in inflation indices.
Modest monetary policy impact: Putting OOH into HICP will increase the procyclicality of inflation, implying higher inflation volatility and greater national divergence. But we see a modest near-term impact on inflation and so monetary policy, for two reasons. First, our estimate suggests that OOH would add a relatively modest 15bp to HICP today, perhaps less if the contribution is weighted for national share of owner occupation. Second, experience suggests that years of more technical work will be required before inclusion. More generally, over the cycle we see HICP with OOH as just 4bp higher on average than HICP without, so putting the OOH into HICP won’t put the oomph into inflation.
Bar Italy, housing has recovered since the crisis… Looking at the euro area as a whole, house prices have been rising steadily since late 2013 – up more than 20% by 3Q19. At the front of the peloton are Spain (+39.6%), Germany (+38.3%) and the Netherlands (+31.4%). France and Belgium, while recording more moderate gains, all also saw some appreciation, with cumulative nominal house price increases of 15.3% and 7.6%, respectively. The exception over this period has been Italy, where prices fell until 2016, and since then have been more or less flat (or even slightly down), with 3Q19 marking the first quarter since end-2016 with positive growth.
House prices recover…
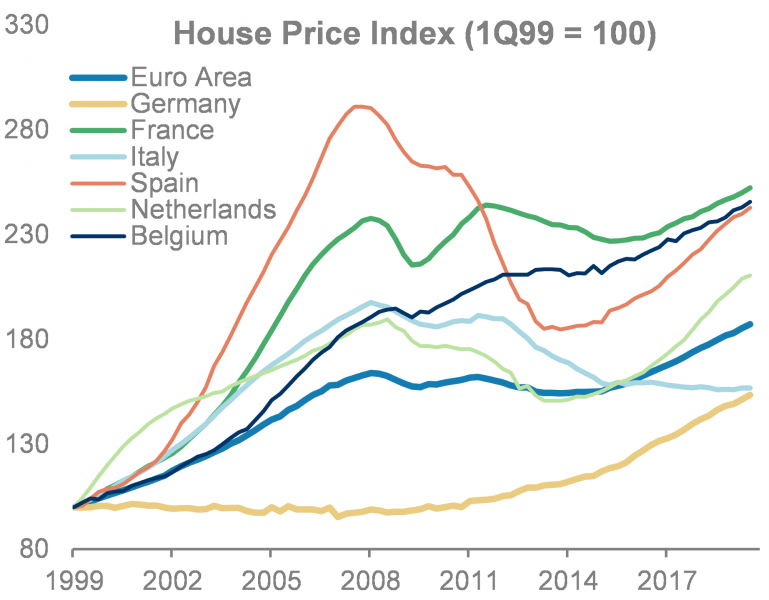
Source: Eurostat, Morgan Stanley Research
…with no major sign of cooling: While growth has been slowing since 2018, house price growth has not softened sharply. At the euro area level, house prices continue to expand at more than 4%Y. Despite this resilience, when looking at country-level statistics, one can find some divergence. France and Belgium have not seen much of a change, while Germany, the Netherlands and Spain saw some slowing. To be clear, house prices continue to grow strongly in those places but, for example, in the Netherlands, house price growth slowed from 9.3%Y in 1Q18 to 6.3%Y, while in Germany and Spain it slowed by 1-2pp to around 5%Y.
… at a relatively good pace
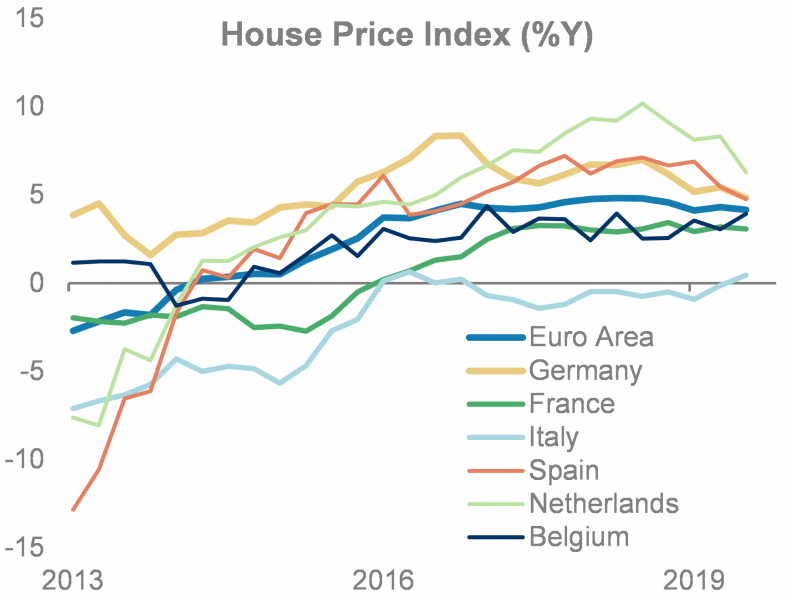
Source: Eurostat, Morgan Stanley Research
Rents rising at a steady pace… Compared to house prices, the increase in rents – as measured by HICP – since the start of this economic recovery looks more modest, but follows a similar dynamic. In the euro area, rents have risen by an average 1.2% per annum since 2014, with no major volatility, with a slight acceleration to 1.5%Y in recent quarters. Within the largest six economies, the Netherlands remains the pacesetter with punchier gains – an average 2.6% rise per annum since 2014 – while Germany saw an average rise in rents of around 1.5% per annum during the same period. In Spain rents have been accelerating – now rising at around 1.5%Y – but they only started rising in 2016, with the first years of recovery actually seeing declining rents.
Rent increases at a steady pace…
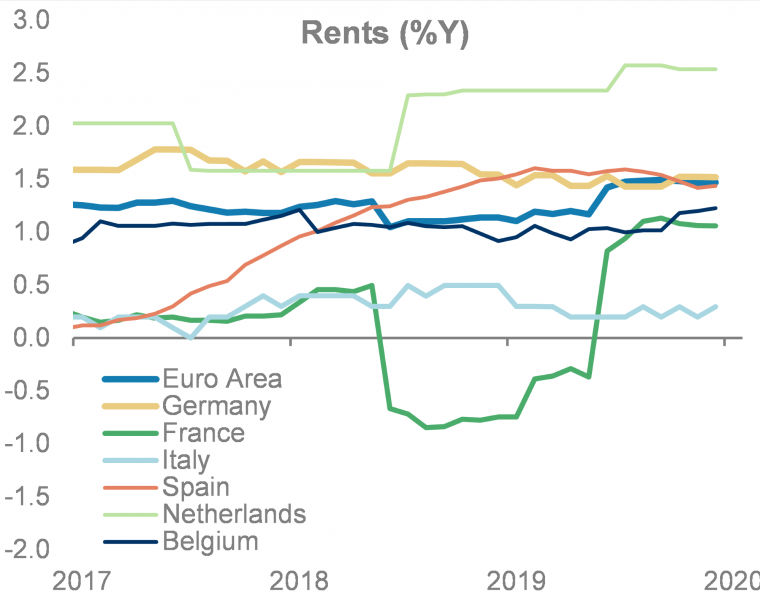
Source: Eurostat, Morgan Stanley Research
…but much slower than owner-occupied housing costs: Typically rent increases, which track all rents including many rents subject to administrative controls, are much less procyclical than house prices, which reflect housing transactions. This is reflected in owner-occupied housing (OOH) costs – which are produced by Eurostat on the basis of data provided by member states and are not included in the calculation of euro area inflation – expanding at much faster pace than rents. This OOH index is based on the ’net acquisition’ approach, and measures the change over time in the transaction prices of new dwellings that were purchased for own-use, while excluding secondary transactions of existing dwellings between households. In addition, it tracks the cost of all goods and services that households purchase in their role as owner-occupiers of the dwellings (e.g., insurance, repairs, etc.). In the majority of cases, OOH costs track new house prices, but run at a slightly lower rate. For example, in the euro area as a whole, house prices are expanding at ~4%Y, while OOH costs – calculated as a weighted average of the OOH experimental indices in the largest six economies – are running at 2.5%Y, ~100bp or so faster than rents.
… slower than OOH costs
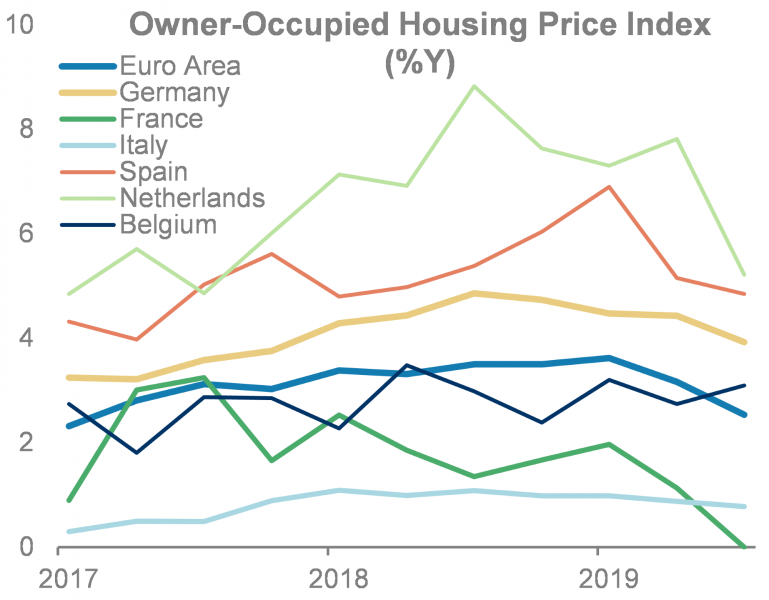
Source: Eurostat, Morgan Stanley Research estimates (euro area)
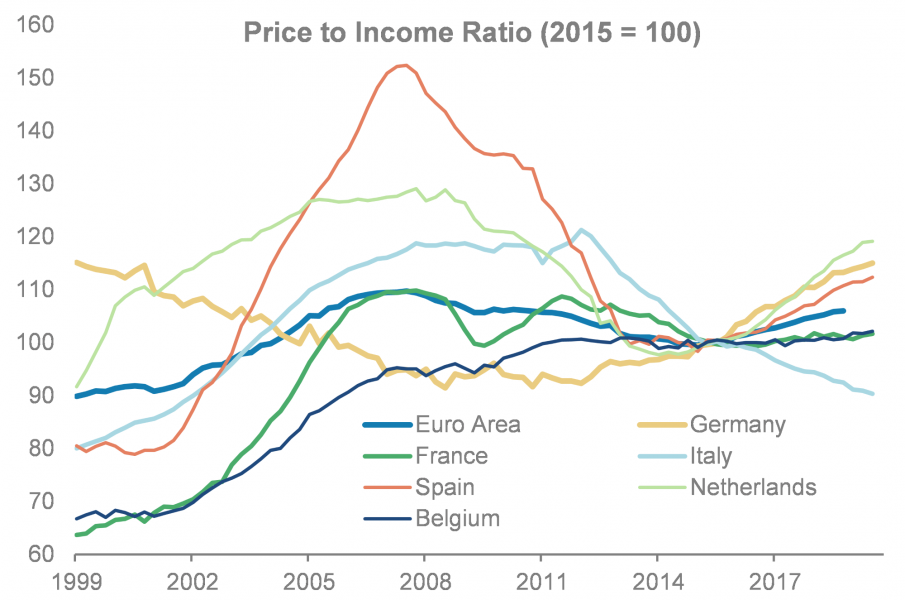
What’s the outlook for house prices? Generally, we are sceptical of claims that house prices will rise faster than other prices in the economy, since on average euro area house prices are currently close to historical highs relative to income and at a record high when measured in real terms – while rates are at a historical low. More generally, we see several factors, which vary by country and time, which drive the longer-term outlook for house prices, including:
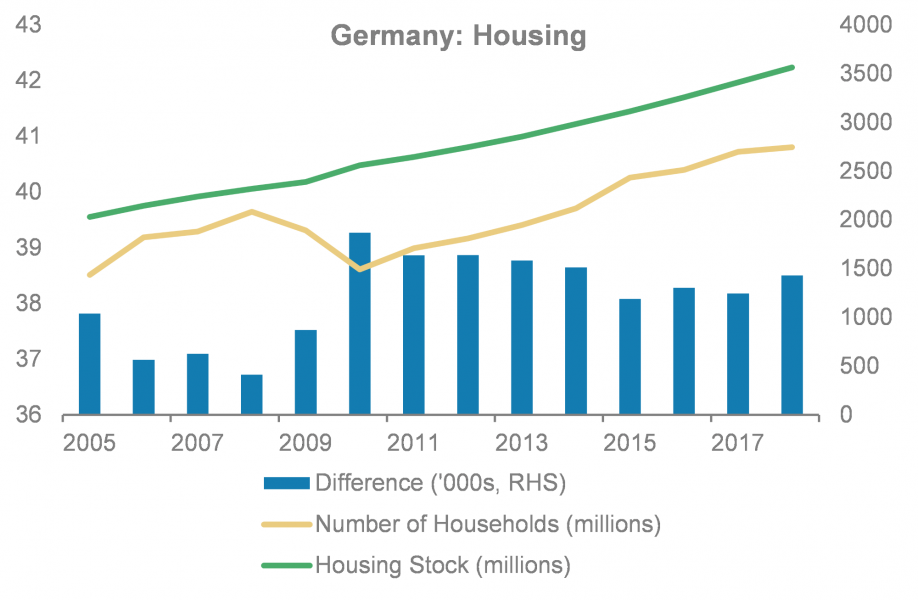
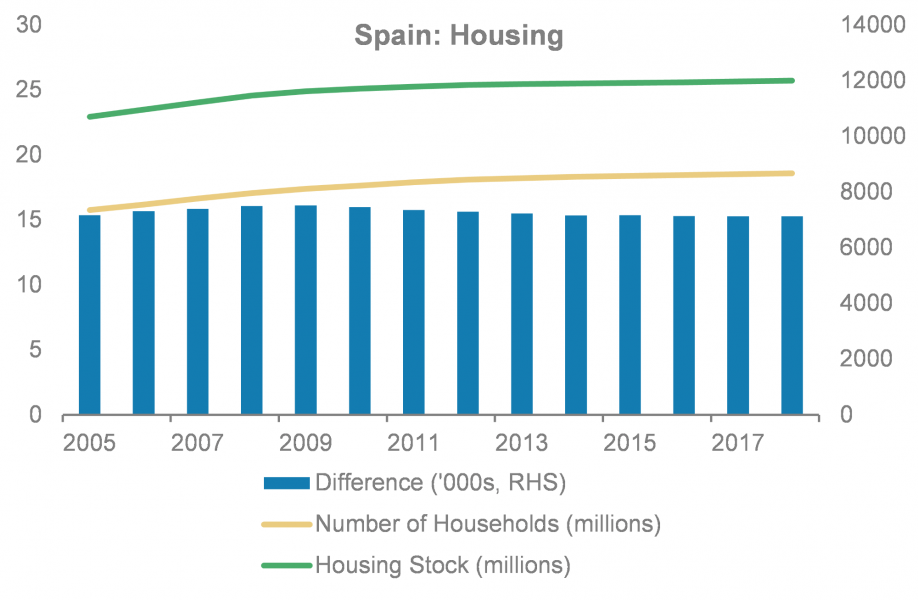
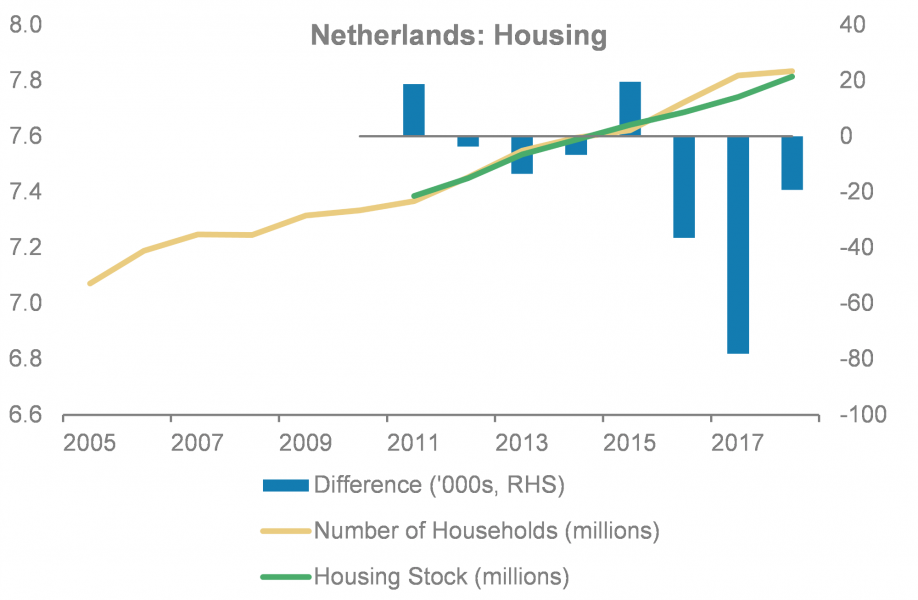
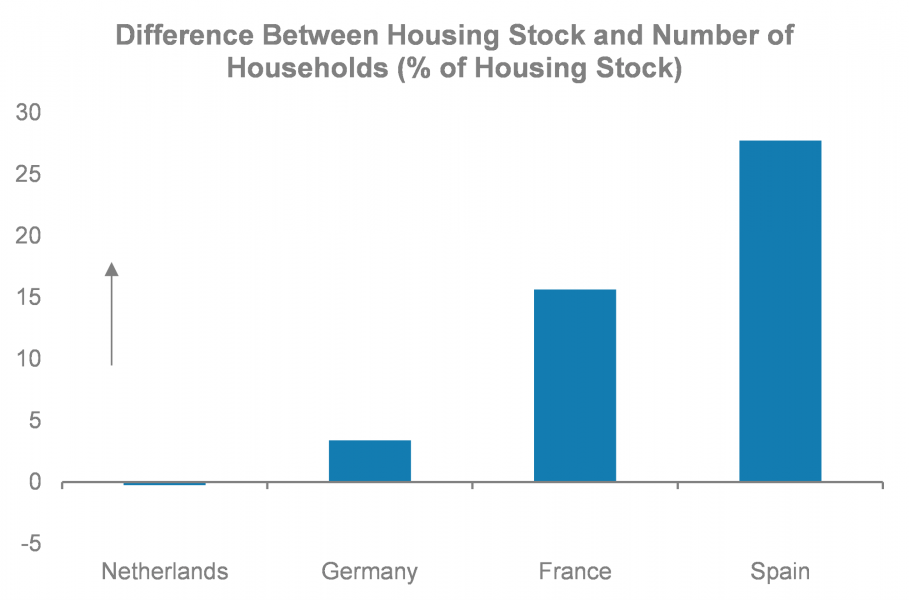
a) The current balance between demand and supply, as reflected by the numbers of households and the stock of housing. Data availability and comparability is an issue, but the data we have suggest that the Netherlands and Germany are more prone to housing price pressures than France or Spain. In the Netherlands there appears to be a shortage of stock relative to the number of households, whereas in Germany that pressure is not as high, with a relatively modest vacancy rate, which would suggest a relatively limited shortfall in supply. This would suggest that the price pressures that we are observing in these countries, while perhaps also supported by the low interest rate environment, are also due to a shortage of supply. In France and Spain – where house prices have risen almost as much as in Germany and the Netherlands – we observe a much larger stock of available housing relative to the number of households – at least at the aggregate national level – suggesting less of an objective basis for upward pressure on prices.
b) The future balance between demand and supply, reflecting the balance between population projections and construction forecasts. Here, we see some longer-term downside, given forecasts of declining population in Spain over the next 20 years; in Italy, where there has not yet been any recovery in house prices so far; and also in Germany, which while still supported in the near term is expected by the UN to see its population decline around 2% from current levels.
| German housing market better supported… | …than in France |
 |
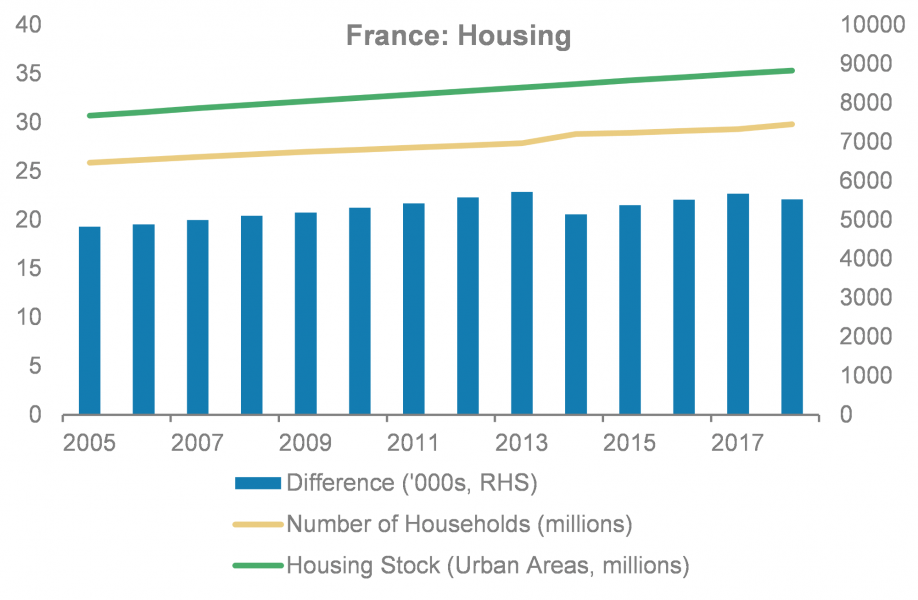 |
| Source: Eurostat, Destatis, Morgan Stanley Research | Source: Eurostat, INSEE, Morgan Stanley Research |
| Large stock of housing still to be digested in Spain | Housing shortages in the Netherlands |
 |
 |
| Source: Eurostat, Spanish Government, Morgan Stanley Research |
Source: Eurostat, CBS, Morgan Stanley Research |
| Housing shortages in Germany and Netherlands underpin rising prices… |
… although falling populations could be a future headwind in some countries |
 |
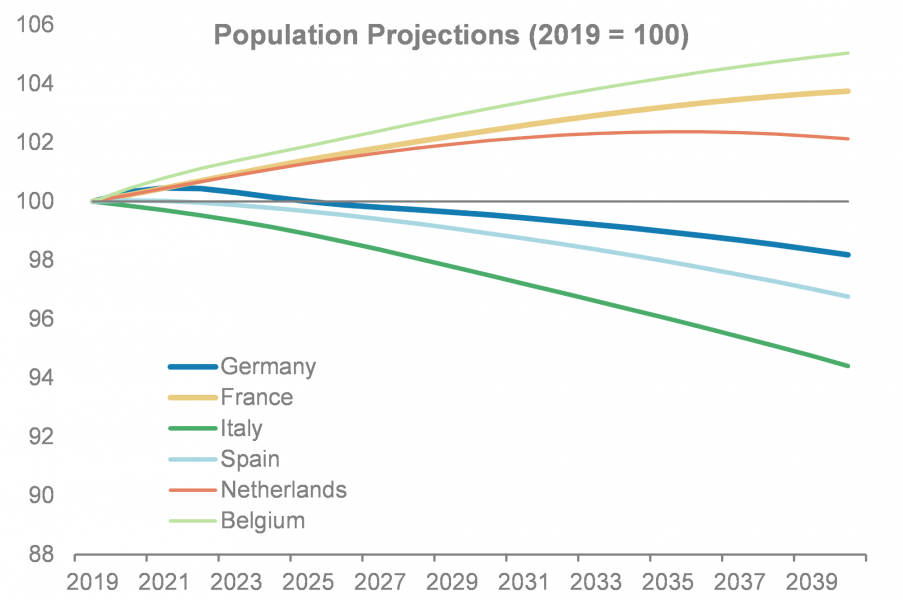 |
| Source: Eurostat, national statistics, Morgan Stanley Research estimate | Source: Eurostat, UN, Morgan Stanley Research |
| Euro area house prices close to record highs relative to income… | … and at a record high when measured in real terms |
 |
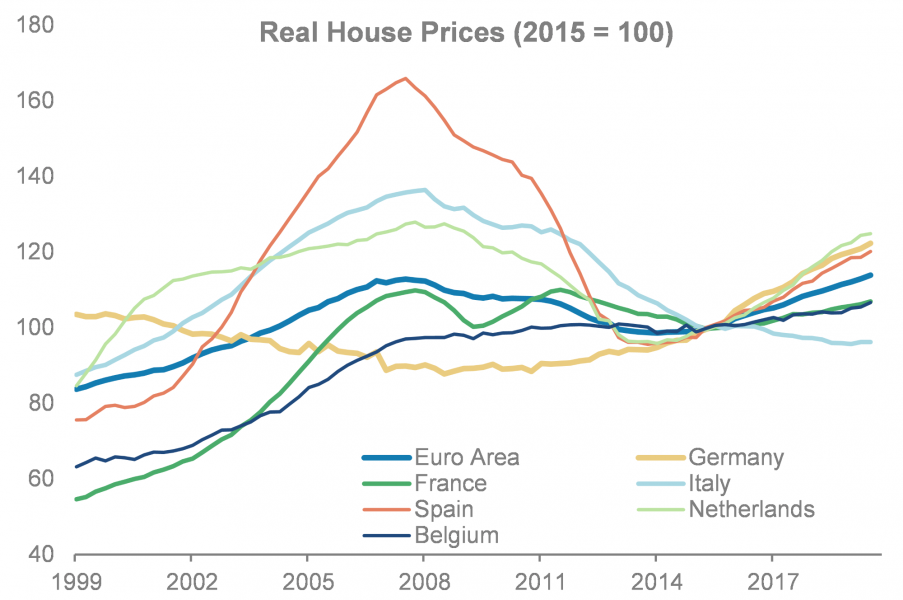 |
| Source: OECD, Morgan Stanley Research | Source: OECD, Morgan Stanley Research |
Our ’homebrew’ estimate: To estimate the impact of the inclusion of owner-occupied housing on inflation, we have devised a ’homebrew’ estimate for various potential HICP-H indices (’-H’ for housing). These projections are based on a bottom-up aggregation of Eurostat’s experimental national OOHPIs (Owner-Occupied Housing Price Indices), accounting for 93% of HICP country weights, together with existing inflation measures. In line with a previous estimate, owner-occupied housing was given a weight of 9% for headline inflation, with the core weight scaled to 13%.
OOHs to give a boost of ~15bp to HICP…
Source: Eurostat, Morgan Stanley Research calculations
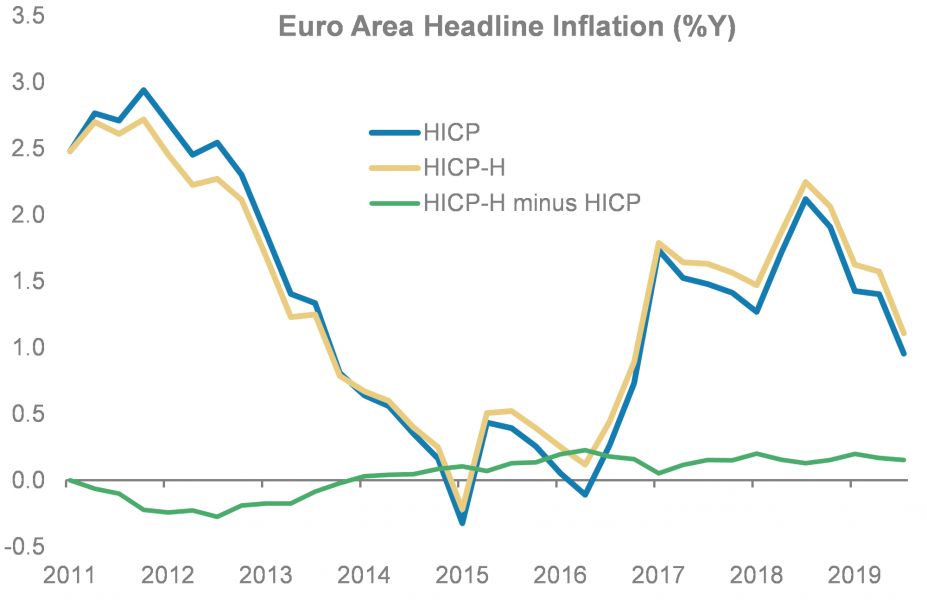
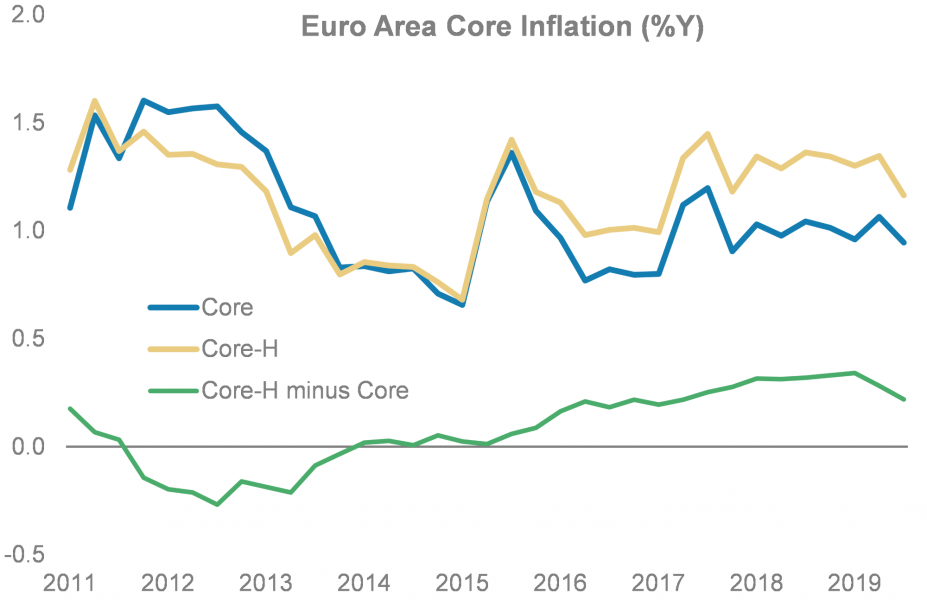
A marginal boost: The findings suggest that headline HICP would have been 15bp higher in 3Q19, the latest available data point for OOHPIs. Core inflation would have been boosted by 22bp. This compares to additions of 20bp for headline and 34bp for core at a recent peak around 1Q19, when the composite OOHP index was running at over 3.6%Y. However, due to the often procyclical and volatile nature of housing costs, their inclusion is not always inflationary. With owner-occupied housing included, headline would have persistently printed lower between 2Q11 and 4Q13, by up to 27bp. The impact broadly washes out over the cycle, with the average headline rate boosted by just 4bp.
… and ~22bp to core
Source: Eurostat, Morgan Stanley Research calculations
Slightly below consensus: Our projections are towards the lower end of – but approximately in the same ballpark as – the estimates quoted by various policy-makers. ECB Chief Economist Philip Lane spoke of a current 20-30bp impact (roughly consistent with our core estimate, but higher than our headline impact), while Bundesbank President Jens Weidmann quoted an impact of around 20bp in individual quarters (which our calculations confirm). However, it is considerably below the 20-50bp range mentioned by Vice Chair Mersch recently.
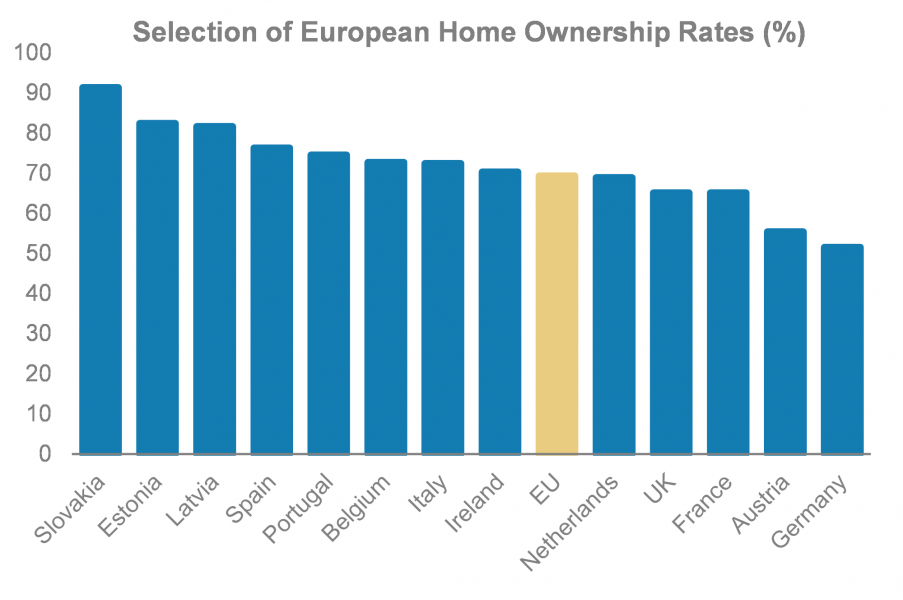
Home ownership differs significantly across Europe
Source: Eurostat, Morgan Stanley Research
Regional differences: Home ownership varies considerably across Europe, with rates as low as 52% in Germany and over 90% in some eastern member states. Making more explicit reference to these regional differences in our calculations would likely introduce a small downside bias, driven by a combination of below-average rates of home ownership and strong OOHP inflation in, e.g., Germany and the Netherlands, as well as a relatively high rate of home ownership in Italy (72%), which has very low OOHP inflation.
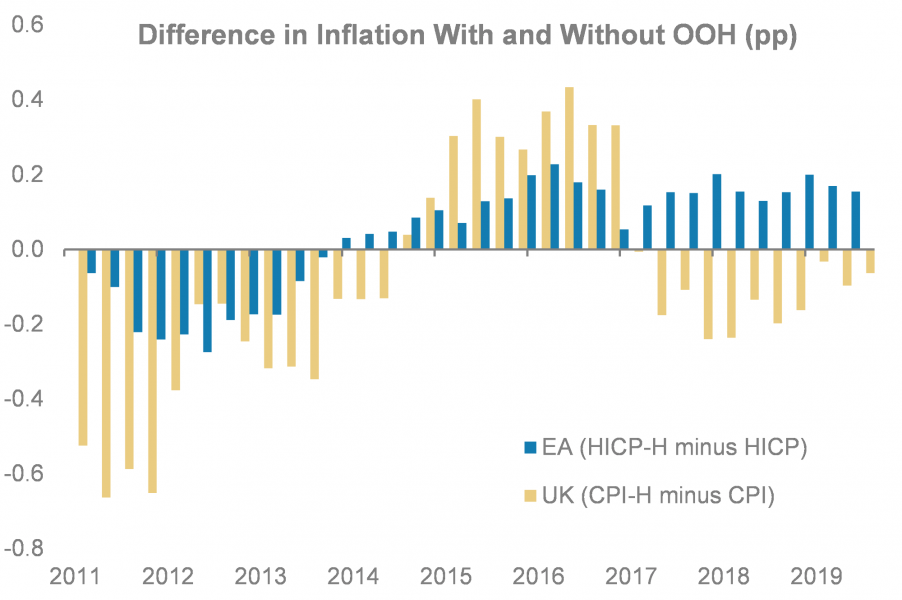
Bottom line: We do not think that inclusion of OOH will have a major impact on monetary policy since it only has a modest impact on realised inflation over the cycle. The evidence here is that over the nine years – including a downturn and an upswing – for which we have euro area data, there has been just a 4bp average gap between HICP and HICP-H, while in the UK over the 23 years for which we have data there has been an even more modest 2bp average gap between CPI and CPIH. Nevertheless, we see some potential consequences for monetary policy over time of HICP-H, i.e., including OOH in the definition of HICP:
a) Greater inflation volatility: We see OOH costs as a procyclical element in inflation, with a substantial weight, and therefore pointing to higher peaks and deeper troughs in inflation. Other things equal, this will tend to point towards a more active ECB, compared to an ECB targeting HICP without OOH.
b) Greater national divergence: In line with the procyclical nature of HICP, we see its inclusion as liable to exacerbate the divergence in inflation between the core, particularly Germany and the Netherlands, with strong house price growth, and the periphery, particularly Italy, with weak house price growth.
c) Greater weight based on the housing market: We would expect the ECB to place more weight on housing markets in its analysis, and would see increased ECB interest in coordination with macropru and fiscal policy to support stability in the housing market.
In addition, we see a chance that market participants may interpret the decision to include OOH in HICP as a sign of a more hawkish ECB, given the perception that it will tend to increase inflation and therefore lead over time to less easy monetary policy – even if in practice it is likely to take several years before OOH can be included in HICP, and at that point the difference between HICP with and without OOH may be negligible.
| Inflation to become more volatile with inclusion of OOH costs |
German-Italian inflation gap to widen with inclusion of OOH costs |
 |
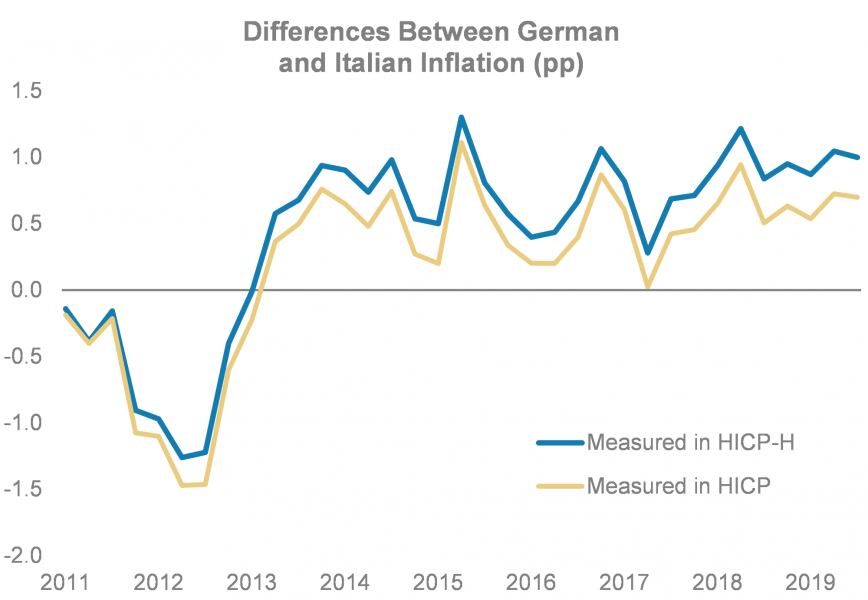 |
| Source: Eurostat, ONS, Morgan Stanley Research estimates | Source: Eurostat, Morgan Stanley Research estimates |
Exploring the existing framework: So far, in the euro area there are limited data on owner-occupied housing (OOH) costs. In 2000, after consultations with the ECB, Eurostat launched a pilot project to encourage member states to compile an OOH index. In the case of HICP, it was decided that the best method for such an index was the so-called net acquisition approach, because it is the method that most closely corresponds to HICP’s purpose, which is to measure the change through time of the total expenditure associated with all actual monetary transactions. The other approaches – the use approach and the payments approach – use imputations and therefore depart from actual monetary transactions and were therefore ruled out.
Overview of different approaches to measuring OOH costs
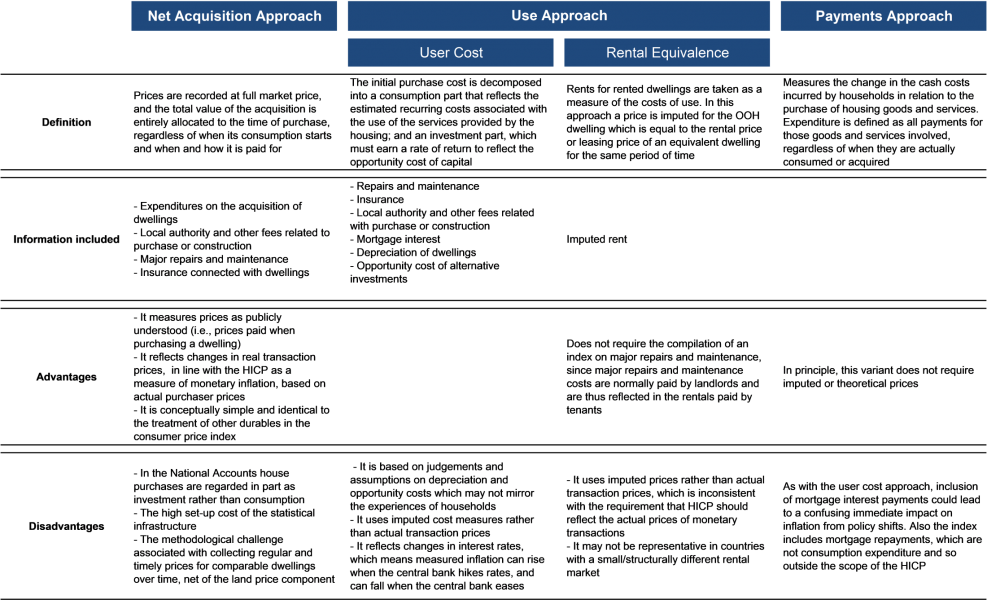
Source: Eurostat, Morgan Stanley Research
Experimental OOH index was already rejected once: The current existing series on OOH costs were already analysed by the European Commission and the ECB once, but then rejected in late 2018 for incorporation in HICP for various reasons:
Potentially a long way to go in practice: We expect the ECB to conclude that OOH should be included in HICP, reflecting the views expressed by several members of the Governing Council, who have recently come out in favour of housing costs being given a bigger weight in inflation, including that of the ECB’s Chief Economist Lane. But after having rejected the available experimental series on OOH as unsuitable for HICP inclusion less than two years ago, we do not think that the ECB will now ignore its defects. Rather, we expect a programme of work to develop a data series which is robust and timely before such a transition can be made. This would either have to collect separate data on the acquisition of land and structures or, alternatively, it could adopt the rental equivalence approach used by most major economies and some within the euro area, such as Germany, the Netherlands and Slovakia. Either way, this points to a major programme of work to develop the systems to generate robust and timely data. Both the UK example and the European experience suggest that this programme of work is likely to take several years.
HICP-H still in need of extra work: The European Commission continues to make preparations for the inclusion of OOH in HICP. But, so far, the guidance on when a more reliable series could be produced is quite vague. Following the 2018 rejection, the European Commission was tasked with developing proposals, but none have yet been made. Moreover, the pace of work to date has been slow: the pilot project of measuring OOH was launched in 2000, the experimental series was only produced in 2015, while the decision not to include the series in HICP was only made in late 2018. As the UK experience suggests, it can take a long time to secure agreement on the definition of OOH, and then to develop a robust and timely data series which can be incorporated into a credible inflation index. The work may be accelerated on the grounds of urgency but we are sceptical that OOH can be included in HICP rapidly.
No consensus on how to measure OOH, although the rental equivalence method is more widely used and in more of the major economies, such as the US, Japan and Germany
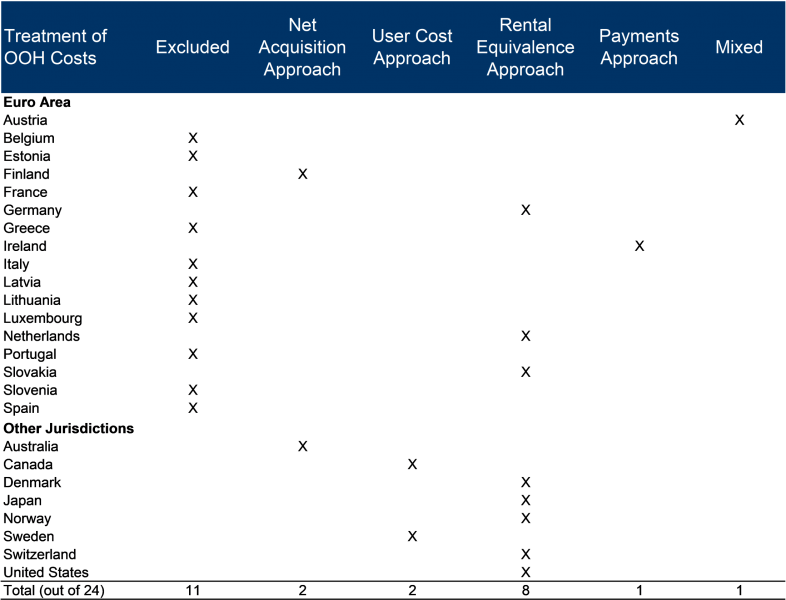
Source: ONS, OECD, Eurostat, Morgan Stanley Research
A halfway house cross-check: Pending completion of the statistical work for HICP to incorporate OOH – in whatever form is deemed appropriate – the ECB could provide information on its estimate of the growth in OOH costs, and get market participants accustomed to what inflation would look like if adjusted for OOH, even as it continued to formally target HICP.
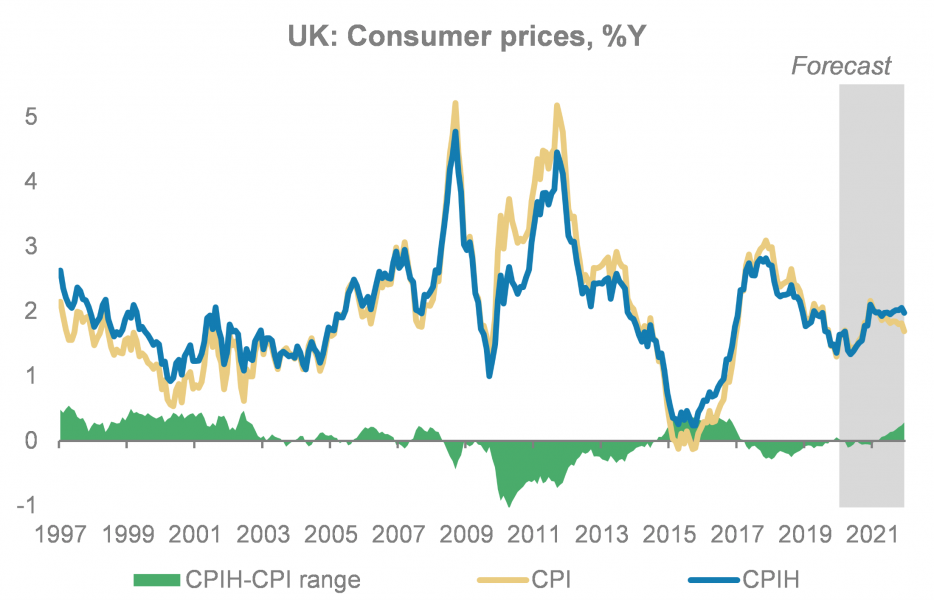
The long and winding road to CPIH: The UK has three different inflation measures: RPI, CPI and CPIH. RPI – still used by the Treasury as the index to which gilt coupon and principal payments are linked to – lost its status as a national statistic in 2013, when CPIH was first introduced, because of statistical flaws which led it to systematically overstate inflation. The difference between CPI – which came into existence in the late 1990s, replaced RPI as the lead measure of inflation in 2003, and which is identical to the Eurostat’s HICP measure – and CPIH is that CPIH includes owner-occupied housing (OOH) costs. The ONS introduced CPIH in 2013 and started publishing it as its lead measure of inflation in July 2017 – seven years after the Consumer Prices Advisory Committee (CPAC) suggested that the ONS should develop OOH cost indices.
A long and winding road: The pathway to including OOH in CPI in the UK
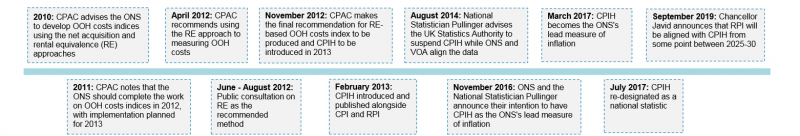
Source: ONS, Morgan Stanley Research
Rents and OOH costs: Similar to the US, the UK takes the rental equivalence approach to measuring OOH costs. Simply put, this approach imputes OOH costs from the rents paid for equivalent rented properties. The ONS stresses that under this approach “a dwelling is treated as a capital good and therefore is assumed not to be ’consumed’ at once, but instead provides a flow of services that are consumed each period” – hence approximating OOH costs with house price inflation would be inaccurate. The data for the OOH price index are sourced from the private rental data from the Valuation Office Agency. The data are stratified regionally, as well as by property type and characteristics. For each stratum, basic aggregates are computed, which are then weighted together to compute the headline OOH price index.
Rental/OOH costs react to housing market changes with a lag, and so does the CPIH-CPI wedge
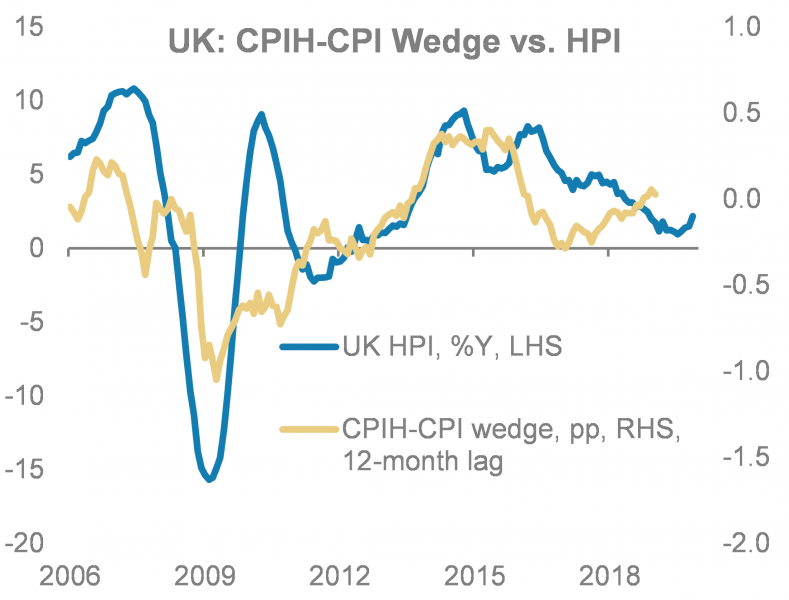
Source: ONS, Morgan Stanley Research
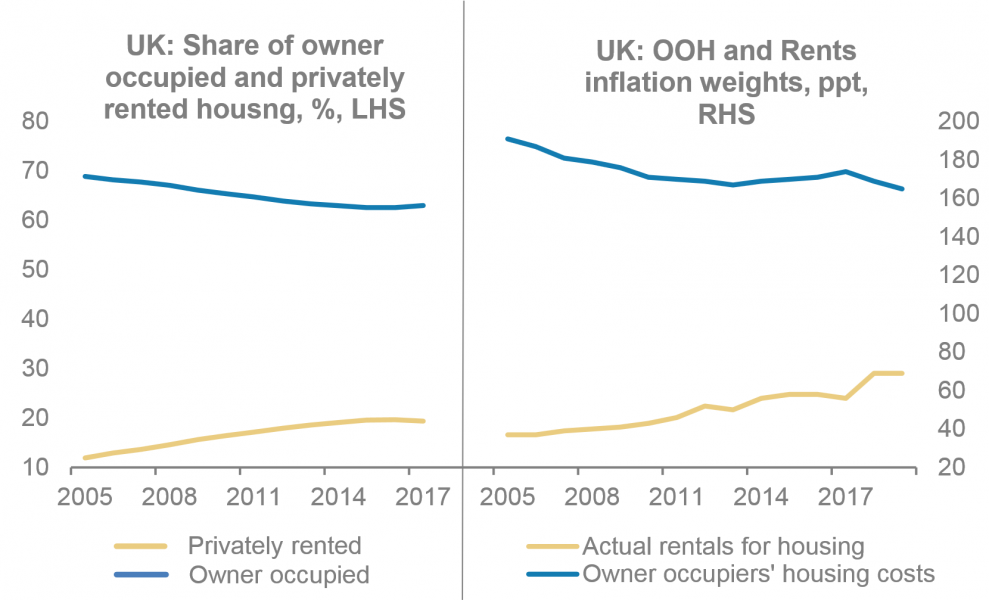
However, as the same data are used to create the Index of Private Housing Rental Prices (IPHRP), it is important to note that the difference between the indices stems from the different weights used to combine the aforementioned basic aggregates. Strata weights for OOH are designed to represent the owner-occupied market and strata weights for IPHRP are designed to represent the private rental market. An area like London, for example, can exhibit relatively large differences between its IPHRP inflation and the all-UK OOH costs inflation, since the mix of rental properties in London differs from the mix of owner-occupied properties in the UK. Weights for both actual rentals for housing and OOH costs categories are computed from expenditure on imputed rentals, published as part of Household Final Consumption Expenditure in the national accounts (Blue Book). Recently, the OOH costs weight has been declining (it stands at 16.5% at the moment), with the actual rentals weight picking up (6.9%), reflecting the fall in home ownership and increase in private renting in the UK.
Actual rentals and OOH costs – similar but not the same
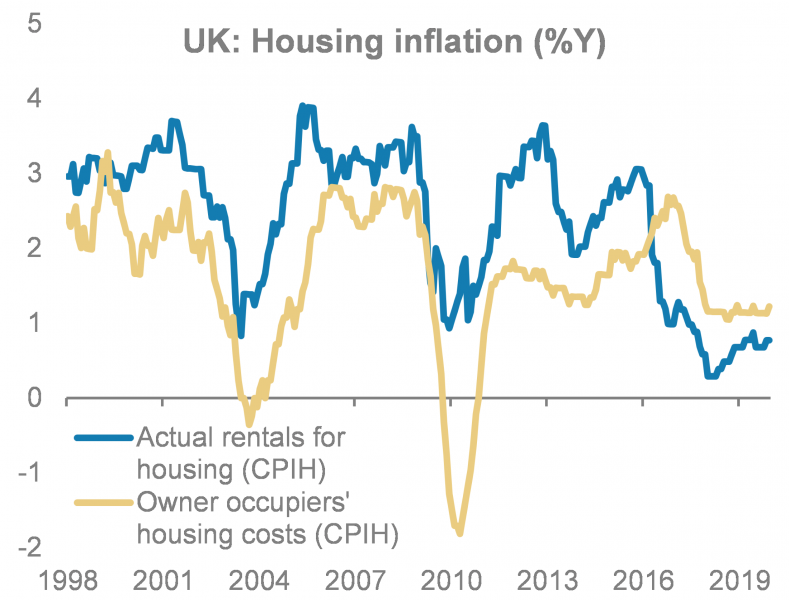
Source: ONS, Morgan Stanley Research
The other wedge: Since 1997, the CPIH-CPI wedge has averaged just 2bp. However, over that period, the wedge has ranged from -1pp to 0.5pp, reacting largely to housing market developments, albeit with a lag. The lag between house and rental prices can be expected, as rental data include the entire stock of rented properties (upon which OOH costs are based), whereas house price inflation is based on only the part of the housing market that is changing as newly marketed properties are bought and sold. For this reason, it could be expected that the HPI series would adjust more quickly to changes in the wider housing market than the IPHRP/OOH series. For example, the -1pp wedge came 14 months after the sharpest house price contraction in the observed period, i.e., the 15.7% drop at the start of 2009. At the moment the wedge stands at just 6bp, and we expect it to pick up in a reaction to the moderate house price recovery we expect in the UK.
Life after RPI: Away from CPI and CPIH, time seems to be running out for the UK’s flawed but legacy inflation measure – RPI. Chancellor Javid is set to start a consultation on aligning RPI with CPIH after the Budget Statement in March, with the change scheduled some time between 2025 and 2030. This move would cement CPIH as the ONS’s preferred measure of inflation and, we think, implies that the Chancellor will set the BoE inflation target in terms of CPIH in due course, making the MPC more sensitive to the housing market.
As CPIH is the ONS’s preferred inflation measure, we focused on its treatment of OOH costs. However, note that RPI treats housing costs differently, capturing mortgage interest costs, depreciation (i.e., the ONS’s HPI-based index covering large-scale repairs), buildings insurance, ground rent and house purchase costs such as estate agents and conveyancing fees. During the latest House of Lords consultation on RPI reform, some statistics experts expressed scepticism about the rental equivalence approach, arguing instead for a mixed approach that captures new dwelling prices and renovation costs (i.e., depreciation as captured by the RPI). However, the MPC’s Broadbent said that “the CPIH’s method was definitely superior to that of the RPI”. With Chancellor Javid deciding to reform RPI to align it with CPIH, the chance of another intervention in housing costs measurements in the UK seems low.
| Variations in the CPIH-CPI wedge, but an average of just 2bp since 1997 |
OOH and IPHRP weights – renting on the rise, ownership in decline |
 |
 |
| Source: ONS, Morgan Stanley Research forecasts | Source: ONS, Morgan Stanley Research |
This article is based on research published for Morgan Stanley Research on February 7, 2020. It is not an offer to buy or sell any security/instruments or to participate in a trading strategy. For important current disclosures that pertain to Morgan Stanley, please refer to Morgan Stanley’s disclosure website: https://www.morganstanley.com/eqr/disclosures/webapp/generalresearch . Copyright 2020 Morgan Stanley.