One much debated question when assessing the early transition period has been whether market liberalisation and reforms should have been fast and radical, or slower and gradual. People living in formerly communist countries have seen their economic, political and social institutions undergo dramatic changes. In the early years of the reform process, they also suffered severe economic recessions. EBRD analysis shows that central and eastern European countries which three decades ago embraced the dominant at the time model of rapid economic liberalisation, deregulation, open borders and globalisation, were more successful in terms of economic and social outcomes when compared to those who tried a more cautious reform approach. Early reformers exploited well their countries’ initial advantages of good levels of secondary education and low cost labour, adopted western technologies, attracted foreign direct investment and achieved high levels of growth and convergence to western income levels. For instance, while by year 2018 incomes of central European countries reached 69% of the G7 level, incomes in the other group achieved only 35% of the G7 level (see Chart 1).
Chart 1. Average per capita income in EBRD countries, in PPP as % of G7
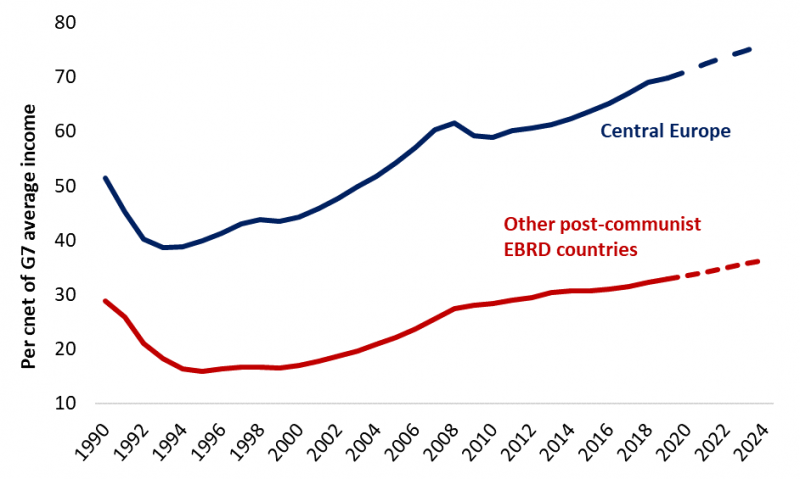
Source: IMF and author’s calculations.
Note: Central Europe includes Estonia, Czech Republic, Croatia, Hungary, Latvia, Lithuania, Poland, Slovak Republic, Slovenia. Other post-communist EBRD countries include Albania, Armenia, Azerbaijan, Belarus, Bosnia and Herzegovina, Bulgaria, Georgia, Kazakhstan, Kyrgyz Republic, Montenegro, North Macedonia, Republic of Moldova, Romania, Russia, Serbia, Tajikistan, Turkmenistan, Ukraine, and Uzbekistan.
The success of reforms has also been reflected in closing of the “happiness gap” with comparable economies over the past three decades. EBRD “Life in Transition” (LiTS) surveys from the early years have identified a “transition happiness gap”, with residents of post-communist countries reporting significantly lower levels of life satisfaction than their counterparts in non-transition countries with similar income levels. However, data from the most recent LiTS survey (2015-16), presented in Chart 2, show that this gap has finally closed, with residents of formerly communist countries now expressing just as much satisfaction with life as their peers in other countries. It seems that there is little difference between early and slow reformers in this respect.
Chart 2. Change in life satisfaction and change in GDP per capita
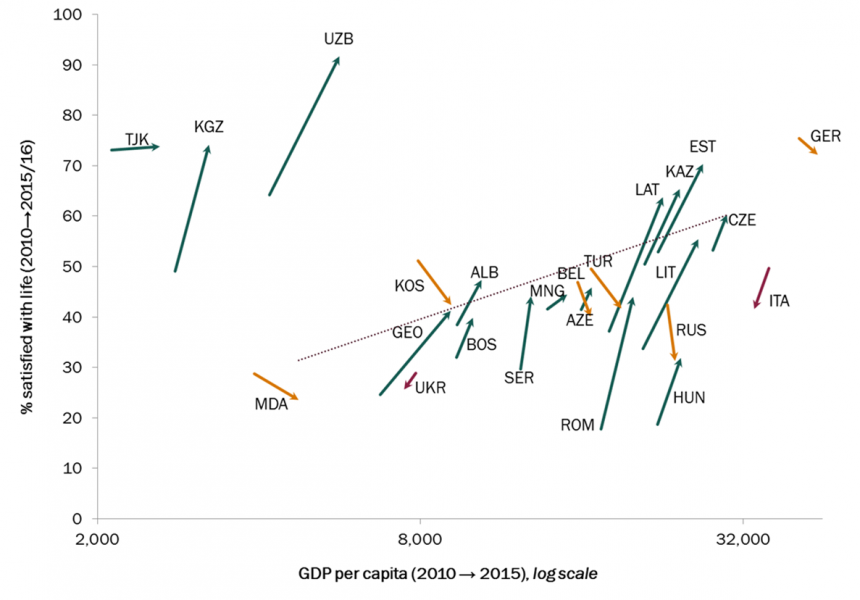
Source: EBRD Transition Report 2016.
Note: The vertical axis shows the percentage of respondents who agree or strongly agree with the statement “All things considered, I am satisfied with my life now”. The horizontal axis shows GDP per capita in purchasing power parity (PPP) terms (based on 2011 US dollars). Arrows show changes in GDP per capita between 2010 and 2015 and changes in the percentage of respondents expressing satisfaction with their life between 2010 and 2015-16. A green arrow indicates that a country is now better off on both counts, a red arrow indicates that it is worse off on both counts, and a yellow arrow indicates that the country has seen positive income growth but registered a decline in satisfaction levels.
The region has achieved an impressive amount of income convergence since the start of the transition process. Furthermore, significant progress has been made in terms of reducing poverty. However, people’s individual experiences of growth and convergence have differed vastly depending on their position on the income ladder. And while residents of post-communist countries have, on average, overcome the dramatic experience of transition, some sections of society have been left behind. People born to families with lower levels of education and income have been more vulnerable to the changes experienced during the transition process, and they are still lagging behind in terms of both objective and subjective well-being.
Only 44 per cent of people in post-communist countries have personally experienced income convergence – that is to say, long-term income growth above the average level in the G7 economies (see Chart 3). The shifts seen in income patterns over the last two-and-a-half decades reflect both broader trends in technology and globalisation as well as experiences unique to the region. The latter include a legacy of the wage decompression and deep recessions seen in the early years of the transition process, and the very fast shift from manufacturing and agriculture-based economies to a more service-oriented model.
Before the start of the transition process, levels of inequality in the region were very low by international standards due an artificial compression of the wage structure and no connection between wages and productivity. Although inequality has increased sharply, it remains moderate in comparison with other parts of the world. Despite this, people are overwhelmingly of the view that inequality levels are high and rising. These perceptions may, to a large extent, be driven by emergence of the very rich, a group that did not exist in the region during its communist era. Moreover, in EBRD regions sources of billionaires’ wealth are much more likely to be tied to commodities (as opposed to IT and other innovation-led sectors) than in other parts of the world (see Chart 4).
Chart 3. Percentiles of the population with income growth above/below the G7 average, 1989-2016
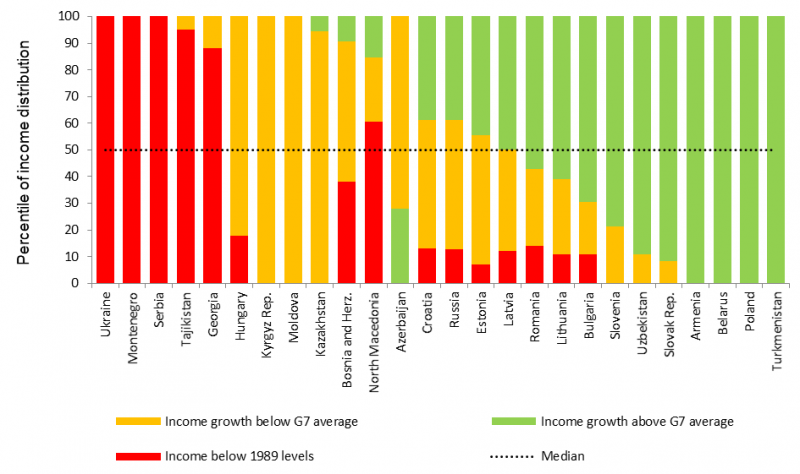
Source: EBRD Transition Report 2016.
Note: Data for each percentile are based on linear extrapolation of averages for each decile.
Chart 4. Sources of billionaires’ wealth
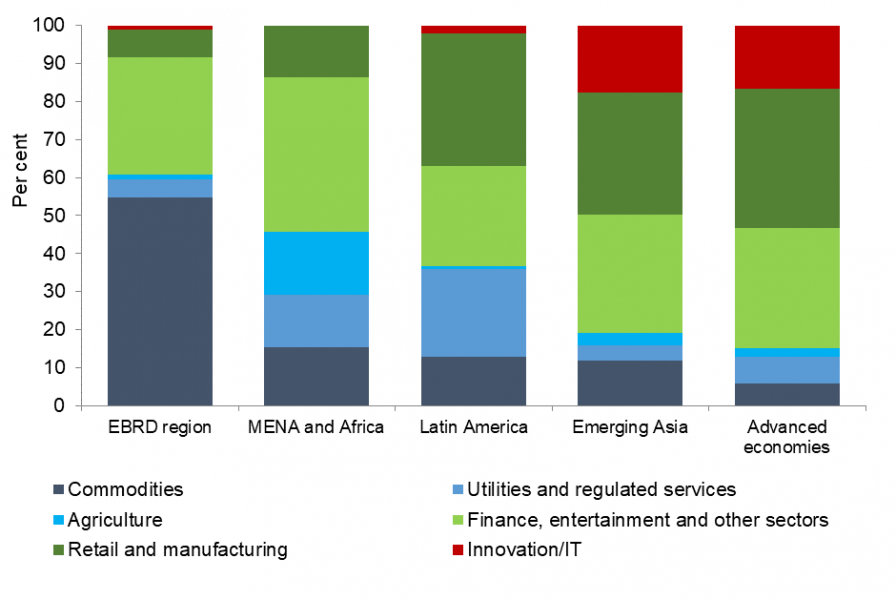
Source: EBRD Transition Report 2016.
Note: Advanced countries are classified using the IMF’s definition. Data relate to 2016. MENA stands for Middle East and North Africa.
One aspect of the growing inequality has been the widening gap in economic fortunes of large cities versus small ones and rural communities (see Chart 5). This process has been significantly influenced by migration and demographic trends. External and within-country migration to more economically prosperous areas has left many smaller communities with rapidly shrinking, ageing and more economically deprived populations.
Chart 5. Average annual GDP growth, 2000-2017 (per cent)
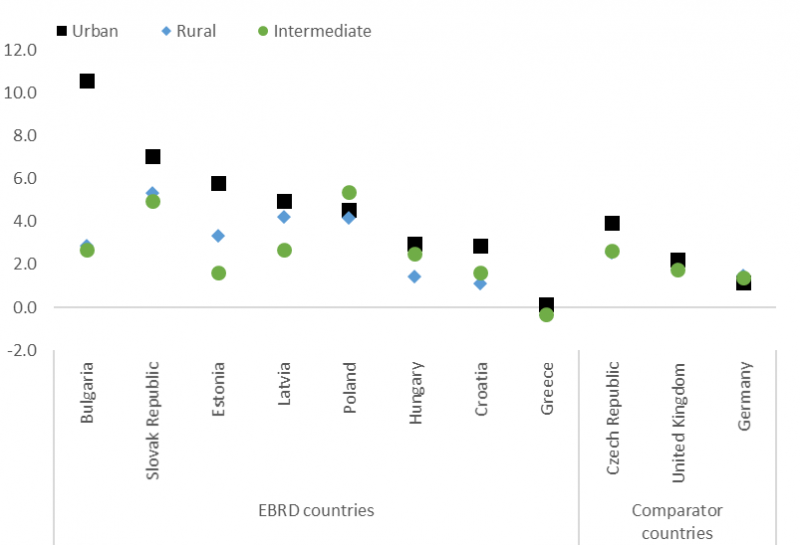
Source: OECD and author’s calculations.
Note: This figure uses 2000-2016 data for Croatia, the Czech Republic, Germany, Latvia and Poland.
While growth has slowed across emerging markets in the last decade, the slowdown in the EBRD region has been sharper than those seen elsewhere. Between 1998 and 2008, average growth in the EBRD region was consistently stronger than that recorded in comparable emerging markets. Since 2009, however, the region has, on average, underperformed similar economies elsewhere in the world.
Even more dramatic has been the change in the growth composition. The socialist economy left a legacy of high levels of education, urbanisation and industrial development. However, under central planning and state ownership, factors of production had been combined very inefficiently. This allowed for a fast catch-up growth in the first two decades of transition. The early rapid market reforms helped improve efficiency of factor use, boost performance and close the productivity gap.
With the economic inefficiencies eliminated, transition countries faced typical middle-income challenges. The changes in the pattern and rate of growth are demonstrated in Chart 6. By the time of the 2008-09 financial crisis, the differential between total factor productivity (TFP) in the EBRD region and TFP in other emerging markets had disappeared. While productivity growth drove the region’s growth prior to 2008, its role has diminished in recent years, when capital accumulation come to the fore.
Chart 6. Decomposition of sources of growth, 1998-2008 and 2008-2016, % per annum
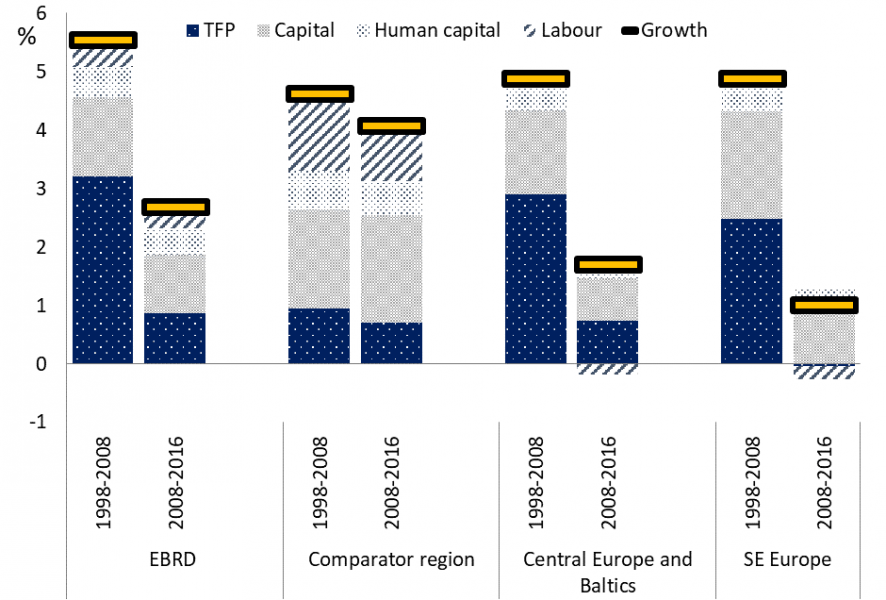
Source: IMF, Penn World Tables, World Bank and author’s calculations.
Note: Simple averages across countries. SE Europe includes Albania, Bulgaria, Cyprus, Greece, Serbia and Romania.
However, in virtually every one of the EBRD’s countries of operations, investment has lagged far behind the levels seen in comparator economies. Indeed, the region’s capital stock is estimated to be 18 per cent lower than what one would expect on the basis of its level of development in economies with similar characteristics.
The economies of EBRD region are now in search of new sources of growth – a growth model that goes beyond the imitation and importing of technology and is instead driven by own innovation. International experience shows that the quality of economic and political institutions is a key enabler of such a growth model.
The future of employment, growth and addressing inequality in emerging Europe will be shaped by the interplay of trends in demographics, migration and automation, as well as the way in which education and social safety nets respond to those trends. The quality of political and economic governance will have a crucial influence on the outcomes.
The economies of emerging Europe find themselves wrestling with population ageing. Ageing in emerging markets – a relatively new phenomenon – is partly a reflection of strong economic development that has brought about higher levels of income and improvements in healthcare for large sections of the population. However, it also represents a major challenge in the sense that demographics are no longer contributing positively to economic growth or income convergence. The demographic picture for the region is encapsulated in the old age dependency ratio. Chart 7 presents this ratio for central Europe and other comparator regions. The UN predicts that the populations of all central and eastern European countries will decline rapidly over the next two to three decades, due to low birth rates and emigration. Their old–age dependency ratios will reach the levels comparable to those of advanced European economies, but at a lower level of economic development. In other words, many of the central and eastern European economies may grow old before they can grow rich.
Chart 7. Old-age dependency ratio (per cent)
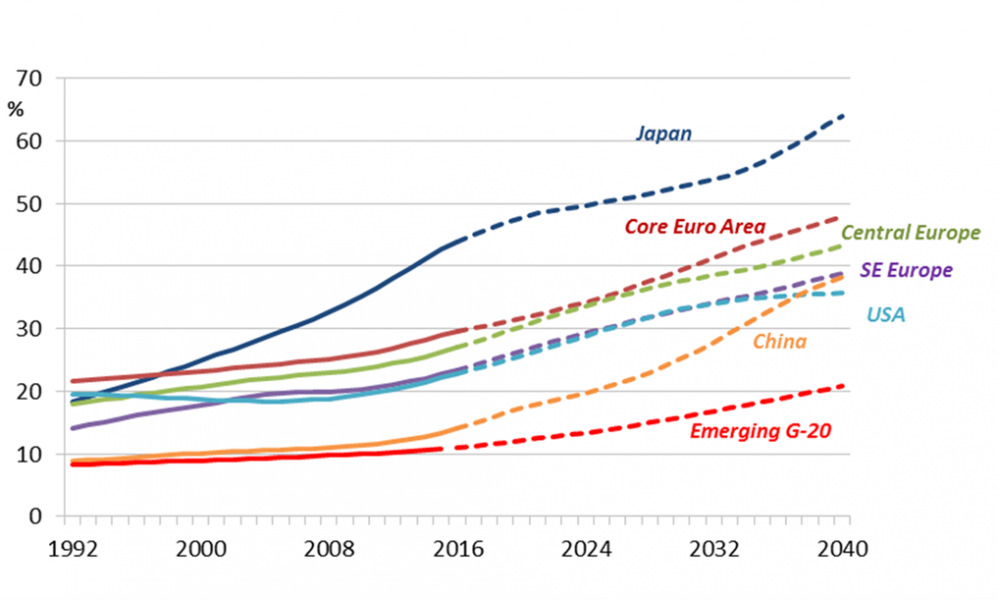
Source: EBRD Transition Report 2018. SE Europe includes Albania, Bosnia and Herzegovina, Bulgaria, Cyprus, Greece, Montenegro, North Macedonia, Romania and Serbia.
Note: The old-age dependency ratio is the number of people aged 65 or over, expressed as a percentage of the number of people between 15 and 64 years of age.
Emigration provides particular demographic challenge, not only because of its magnitude, but also because of the composition of the flows. It is typically the young, more entrepreneurial and more educated who vote with their feet and leave their countries in pursuit of higher living standards and better quality of life elsewhere. As the labour force shrinks and those who remain are on average older, the preferences and the needs of the society change. Policies may become more focused on social care and redistribution rather than long-term objectives. The share of the state’s budget devoted to social care may increase leaving fewer resources for future-oriented policies, such as education and innovation. This creates a vicious spiral of further relative economic stagnation, feeding further demographic decline.
In addition to ageing and emigration, labour force participation rates among older age groups have remained relatively low in emerging Europe, as demonstrated in Chart 8. In the G7 economies, the average labour force participation rate among people aged between 50 and 64 stood at 74 per cent in 2017, up from 68 per cent in 1997. The corresponding rate in new EU member states was only 60 per cent. Participation rate among women is even lower and falls particularly fast after the age of 60 as this is still the retirement age for women in many countries in the region.
New EU member states and the G7 economies have similar labour force participation rates for prime-age men. However, participation rates for men start declining earlier in new EU member states, at around the age of 50, reflecting weaker health of workers and relatively early retirement ages in some countries.
The path that ageing economies need to take is clear: in the absence of a major demographic turnaround, older workers will need to work for longer. Incentives to seek employment are important, but people’s ability to remain productive as they get older may be even more important. Policy responses in two areas can help to boost labour force participation among older people. First, pension and tax systems can be adjusted to encourage longer working lives. And second, improvements in healthcare and lifelong learning opportunities can help workers to remain productive and have longer careers.
Chart 8. Labour force participation rates decline with age faster in the new EU member states than in G7 economies
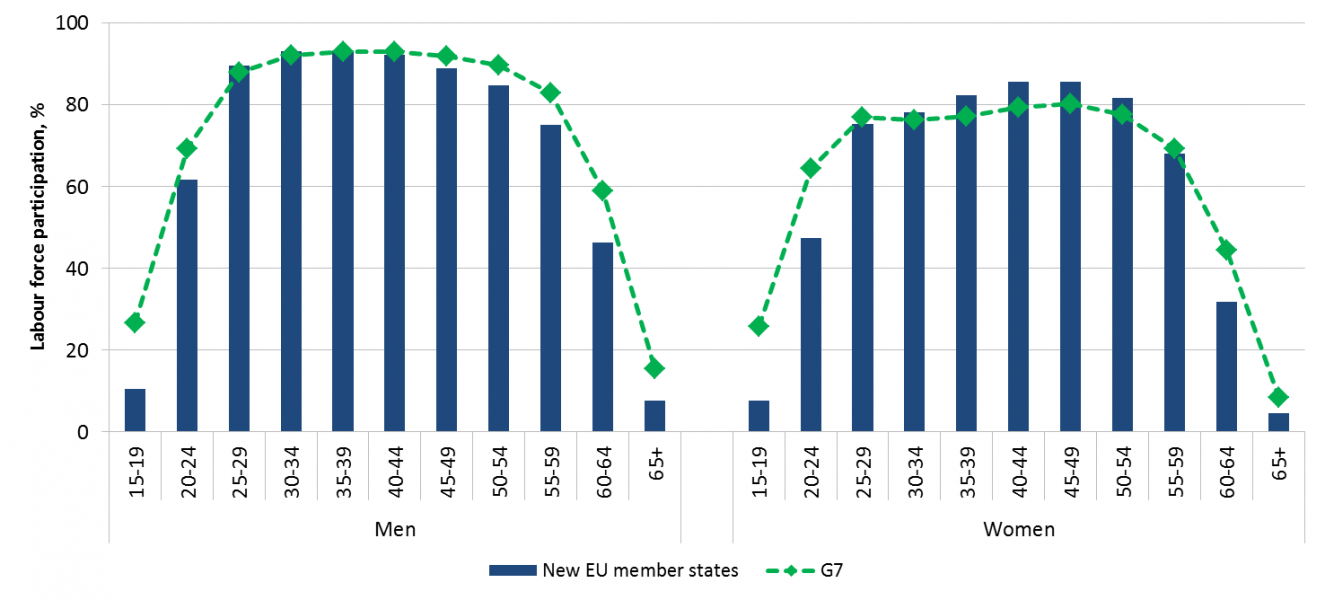
Source: EBRD Transition Report 2018.
Note: Based on data for 2017 or the latest year available.
The role that good health plays in explaining the likelihood of a person being employed or seeking employment can be investigated using data from the Gallup World Poll. The self-assessed health of male respondents in emerging Europe declines sharply after the age of 50 (see Chart 9). In contrast, self-assessed health tends to decline later in life in other emerging markets and the G7 countries.
Chart 9. Self-assessed health declines rapidly with age in the EBRD regions
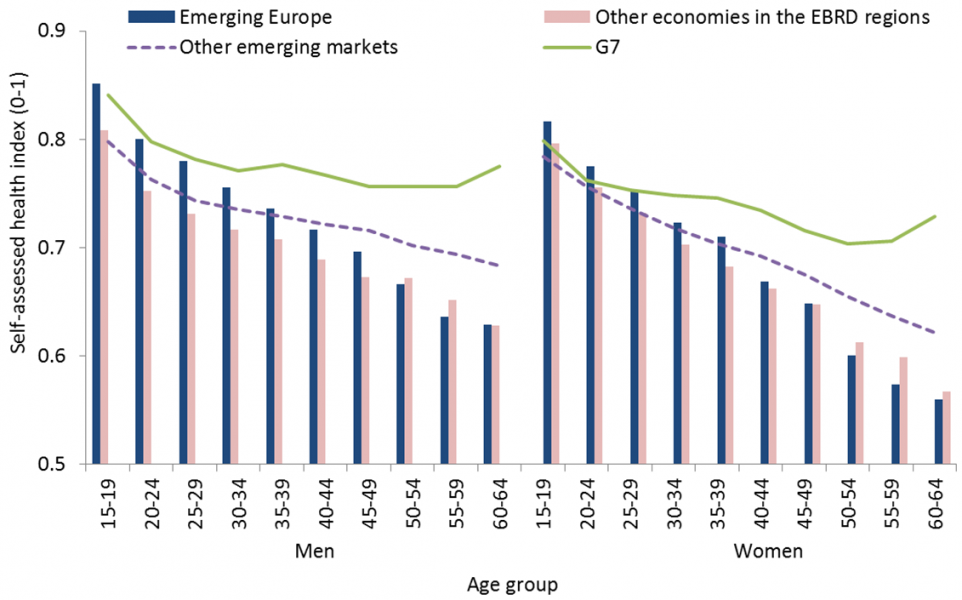
Source: EBRD Transition Report 2018.
Note: “Emerging markets” are defined here as economies with GDP per capita in excess of US$ 1,100 at market exchange rates that are not regarded as advanced on the basis of the IMF’s definition.
More broadly, deteriorating health is strongly linked to people’s decisions not to seek employment. Self-reported health is a major determinant of the decision not to seek employment, even when all other factors are taken into account. Health has a stronger impact on labour force participation among people between the ages of 50 and 65.
Looking beyond the issue of health, low labour force participation rates among older age groups also, to a large extent, reflects the difficulty of acquiring, retaining and updating skills. Older workers tend to find it harder to keep up with technological changes and generally have greater difficulty finding new employment. In the past, workers could often rely on existing skills for the duration of their careers, but that is not necessarily the case these days, with working lives becoming longer and technology changing rapidly.
Studies suggest that learning new skills requires more effort the older you become, reflecting the declining adaptability of the brain. The cost-benefit profile of acquiring new skills after the age of 40 can be improved if the cost of mid-career learning can be lowered. For example, changes could be made to basic educational qualifications (including university degrees) in order to help individuals to learn how to keep learning, rather than trying to provide students with specific skills that will remain relevant for decades. Indeed, research suggests that around half of all acquired skills now lose their relevance within five years in the absence of retraining.
We can gain deeper insight into the skills of workers at different stages in their lives by looking at the results of the OECD’s PIAAC surveys measuring the skills of adults aged 16 to 65. Those surveys were conducted between 2011 and 2014 in 31 countries, including nine economies in the EBRD regions: six post-communist countries (Estonia, Lithuania, Poland, Russia, the Slovak Republic and Slovenia), plus Cyprus, Greece and Turkey. This data suggests that countries in the EBRD regions tend, on average, to perform relatively well in PIAAC tests, particularly in relation to their levels of per capita income. However, as in advanced economies, average performance in the EBRD regions tends to be weaker among older survey participants. Older workers would need to update and broaden their skills – rather than simply retaining them – in line with rapid changes in technology and working practices.
The data also suggest that financial returns to skills are higher among older workers. While skill scores are lower among older workers, the wage premium associated with improved skills increases with age. The difference in wages that is associated with a one standard deviation increase in test scores rises from a few per cent for people under the age of 25 to 25 per cent for people aged between 55 and 65 (see Chart 10). Returns to skills for that oldest age group are more than twice the size of those observed for people between the ages of 25 and 34. While it may be harder to retain and update skills later in life, the financial returns may well compensate for the effort.
Chart 10. The wage premium associated with a 1 standard deviation increase in average test scores is larger for older workers
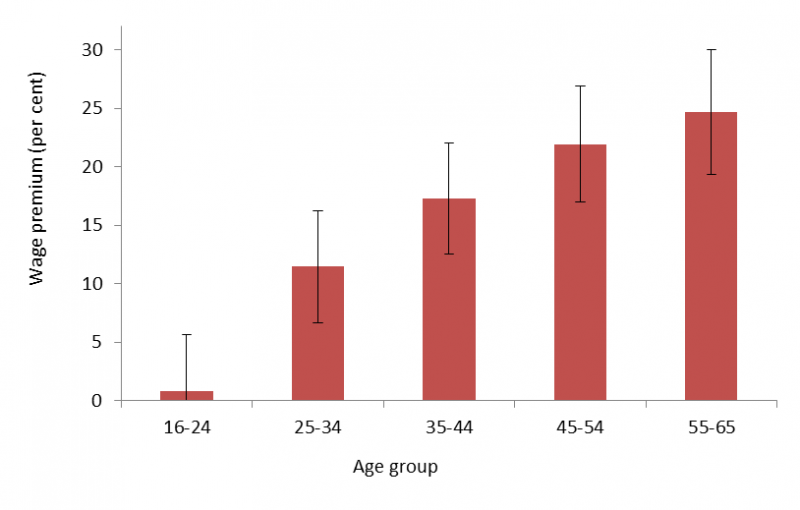
Source: EBRD Transition Report 2018.
Improving governance is another, underappreciated area, where reforms would yield long term dividends and help arrest the demographic decline and spur growth and income convergence. Although central and eastern Europe has made a lot of progress in this area, a substantial gap vis a vis G7 countries remain. This is visible in the evolution of the Worldwide Governance indicators presented in Chart 11. But it is also visible in public perceptions. For instance, while 56% of citizens of G7 countries have confidence in the national government, the judicial system and courts, honesty of elections and freedom of media and believe that corruption is not widespread throughout the government or business, this is true of only 35% citizens of central and eastern Europe. This gap has persisted for the last decade (37% in 2011). As EU accession reform momentum subsided, populism and even reform reversals gained strength in a number of economies.
Chart 11. Improvements in the quality of economic institutions in central and south east Europe have slowed down
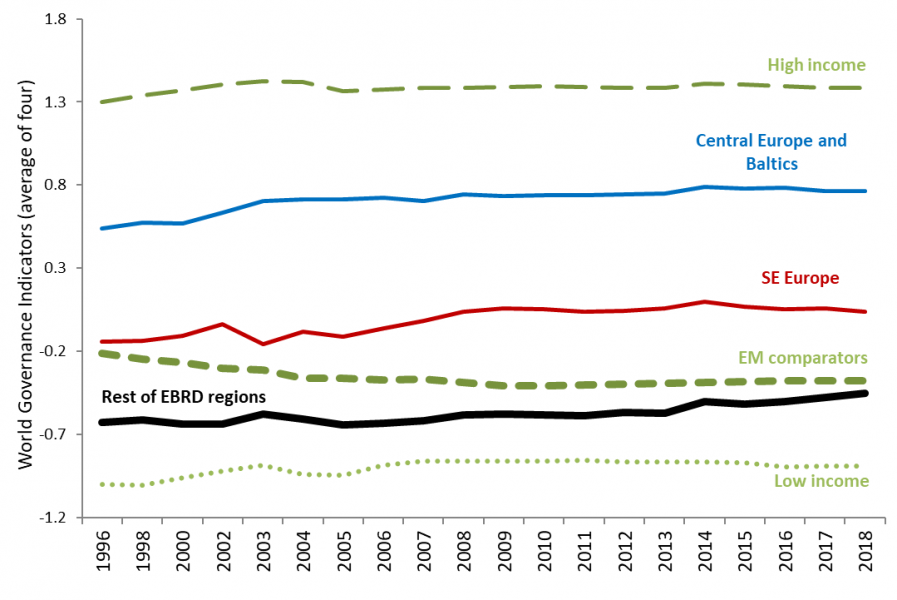
Source: EBRD Transition Report 2019. SE Europe includes Albania, Bosnia and Herzegovina, Bulgaria, Cyprus, Greece, Montenegro, North Macedonia, Romania and Serbia.
Note: The quality of economic institutions is captured by a simple average of the Worldwide Governance Indicators for control of corruption, the rule of law, regulatory quality and government effectiveness. “Low-income” economies are those with per capita incomes below the lowest value observed in the EBRD regions at market exchange rates in 2017; “high-income” economies are those with per capita incomes above the highest value observed in the EBRD regions. GDP per capita in comparator economies lies between the lowest and highest values observed in the EBRD regions.
Reforming governance is more complex to deliver, but it is essential for two reasons. First, better governance is a key ingredient for the next stage of development. Growth in the first two decades of transition followed a relatively unsophisticated model, based on cheap labour, capital accumulation and imported technology. The sources of this catch-up growth are now being exhausted. The next big leap needs to be based on innovation and entrepreneurship, both of which are particularly sensitive to the quality of governance. And fast growth will ease the demographic challenges by offering higher standard of living to people of central and eastern Europe and thus providing incentive to remain in their countries.
Good governance matters also at the level of individuals. As Transition Report 2019 shows, weak governance correlates with lower self-reported life satisfaction. And people often cite weak governance as an important factor fuelling their intentions to emigrate.
Conclusion
This brief journey through 30 years of major socioeconomic transformations in central and eastern Europe allows us to identify clear choices the region is facing. The sources of easy growth in the early years – cheap labour, trade openness and foreign investment – are largely exhausted, and the region needs a new growth model to make the next transition to high-income status. As management gurus advise middle managers: “what got you here, won’t get you there”. The region needs to promote good governance, education, skills, innovation and better health care. This is urgent, given the negative demographic trends in practically all countries of the region, with growing old age dependency ratio and high emigration, particularly of the skilled. The choice is clear: bold new reforms, or relative stagnation, with low growth and further demographic decline.
African Development Bank, Asian Development Bank, European Bank for Reconstruction and Development, Inter-American Development Bank (2019). Creating liveable cities: regional perspectives.
EBRD (2016). Transition Report 2016-2017 – Transition for all: Equal opportunities in an unequal world, London.
EBRD (2017). Transition Report 2017-2018 – Sustaining Growth, London.
EBRD (2018). Transition Report 2018-2019 – Work in Transition, London.
EBRD (2019). Transition Report 2019-2020 – Better Governance, Better Economies, London.