Why are global real interest rates so low for so long? Conventional theory appeals to structural factors that push down the ‘natural interest rates’ or r-star. We subject this view to a direct empirical test, by examining if real factors such as productivity growth and demographic shifts can explain real interest rate movements. Our findings, based on 19 countries over 145 years, cast doubt on this view, instead pointing to the overlooked role of monetary factors. We propose a new theoretical explanation of persistently low real rates, grounded on the interaction between monetary policy and the financial boom-bust cycle. From this ‘monetary hysteresis’ perspective, low real rates could arise endogenously from successive failures to stabilise the financial cycle.
More than a decade has lapsed since the 2008 Great Financial Crisis (GFC), and global interest rates today remain much lower than before it (Table 1). Central banks in Europe and Japan have yet to lift their policy rates off the effective lower bounds. Those engaged in large-scale asset purchases still have bloated balance sheets relative to GDP. In emerging markets, less affected by the crisis, nominal interest rates are close to their historical lows. Remarkably, low interest rates prevail despite the global economy growing at rates similar to the pre-crisis average, and major economies operating close to or even above estimates of potential.2 If the crisis has any lasting impact, it is not so much in terms of growth hysteresis but more in the form of ‘monetary hysteresis’.
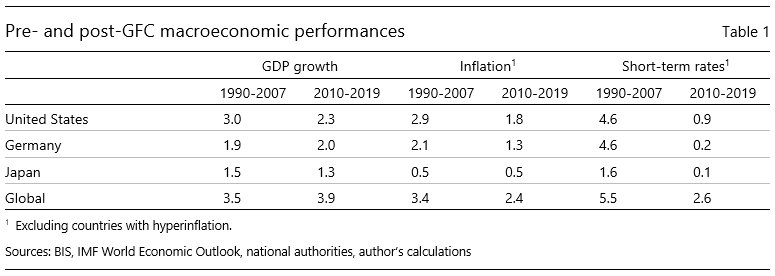
Subdued inflation helps explain low nominal interest rates, but only partly.3 Risks of deflation taking hold (or smaller risks of running the economy hot) may justify easier monetary policy even when there is little slack. But the global nominal interest rates have fallen by 3 ppts, much more than the 1-ppt decline in inflation during the post-GFC period (Table 1). As a result, the real (inflation-adjusted) interest rates have fallen by 2 ppts. A shift in the central bank reaction function seems to be at least part of the explanation.
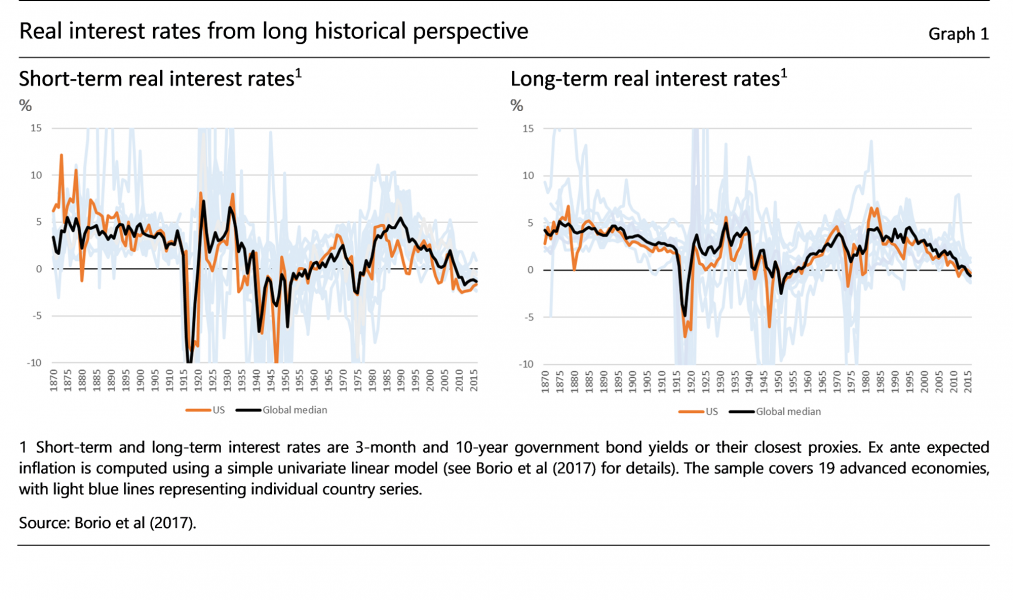
One influential hypothesis is that the ‘natural interest rate’, or r-star, has fallen over this period.4 R-star may be defined as the rate of interest that sustains full employment (equivalently, output at potential) and stable inflation in the medium run when all transitory shocks dissipate. According to this view, higher desired saving and/or lower desired investment have pushed down r-star, requiring the central banks to steer interest rates lower to sustain full employment and ensure stable inflation. In fact, under this hypothesis, shifts in saving-investment factors, unrelated to monetary policy, have been pushing down r-star for several decades since the 1980s (Graph 1).
Low r-star is often seen as the most important challenge to monetary policy since the crisis. If the nominal interest rate is subject to an effective lower bound iL, and the inflation target is a small positive number π* , the real interest rate cannot fall below iL – π* , limiting the scope for monetary easing. If r-star is close to or lower than iL – π*, there may not be enough policy space for the central bank to fulfil its mandate at all. This concern is an important consideration prompting major central banks to review their monetary policy frameworks.5
R-star is indeed a central concept in how macroeconomists today think about monetary policy. It serves as the guidepost for assessing the policy stance. Monetary policy is said to be accommodative when the real interest rate is below it, and tight when above it. To many, without an r-star, it would be difficult to conceptualise, let alone gauge, an appropriate stance of monetary policy.
In practice, estimating r-star empirically is far from straightforward. One difficulty is that r-star estimates are subject to significant statistical uncertainty, which limits their usefulness and makes them unfit for calibrating policy.6 More fundamentally, r-star is a theoretical concept and is inherently model-specific. To define it, one must take a position on what model is the best representation of reality. An r-star estimate is an implication of a preferred world view, and, like any theory, should be subject to independent validation. Model uncertainty translates into uncertainty about the associated r-star, both in quantifying and defining it.
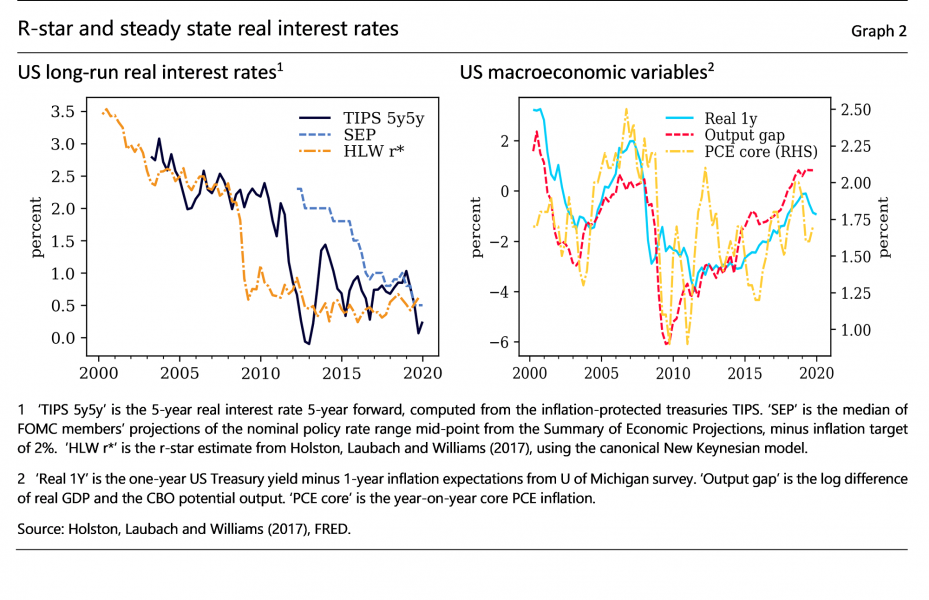
Comparing different estimates of r-star and steady-state real interest rates reveals these difficulties (Graph 2, left-hand panel). The 5-year 5-year forward rate from the TIPS market (‘TIPS 5y5y’), a market-implied measure of the steady-state real rate, hovered above 2% through the GFC and declined notably in 2011 after the euro area sovereign debt crisis set in. Meanwhile, the FOMC’s expectation of the longer-run real policy rate (‘SEP’) was close to 2% until as late as 2015, dropping quickly only from 2016 onward (right panel). Finally, an r-star estimate based on a New Keynesian model (‘HLW r*’ from Holston, Laubach and Williams (2017)) declined immediately with the onset of GFC, dropping from 2% to 0.5%, and has remained near that level since. Uneven timings of revisions are symptomatic of significant uncertainty about long-run real interest rates and their determinants. Large unanticipated revisions in all cases also sit uncomfortably with the notion that r-star should depend on slow-moving shifts in saving-investment factors.
The fact that all these indicators point in the downward direction may give a false impression of robustness. In inferring r-star, the realised path of the real policy interest rate is a key observed variable, and this has been extraordinarily low in the sample. This could make the inference prone to a circularity problem: is an r-star estimate tracking monetary policy actions or the other way around? The circularity problem is even more concerning when the model used to draw inferences is subject to shortcomings. For example, the recession in 2009 clearly has to do with a rare financial crisis, which even a drastic cut in the policy interest rate could not offset. For a simple New Keynesian model, the most natural way to reconcile a deep recession with a very low rate is to deduce that r-star has declined.
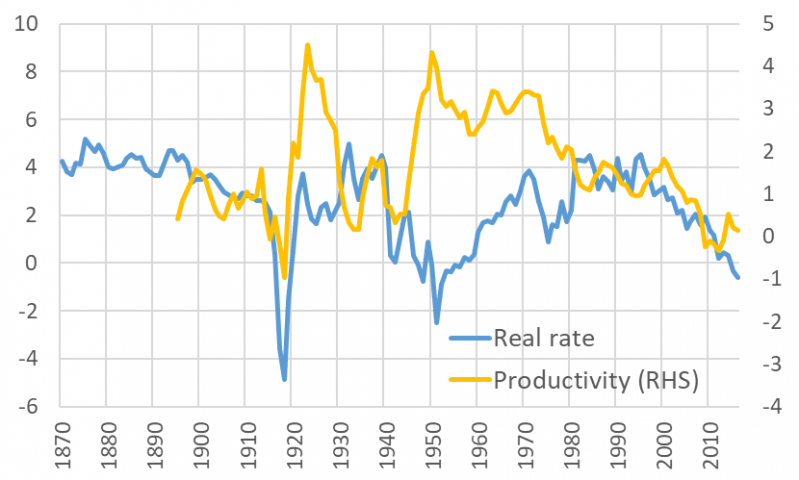
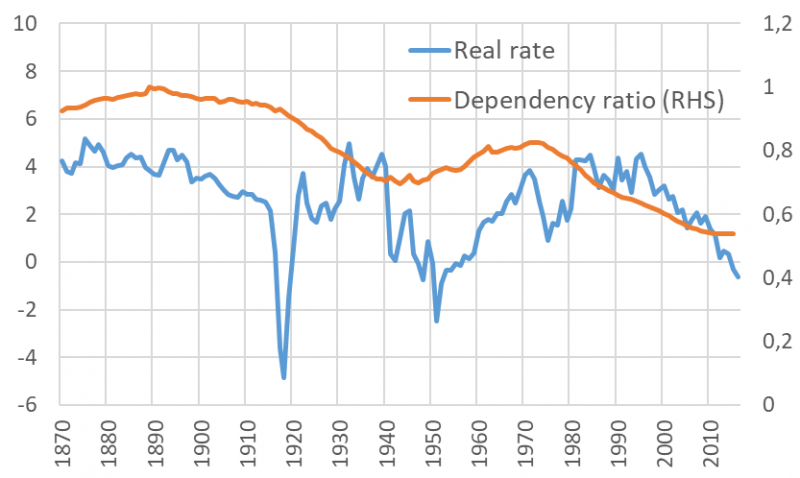
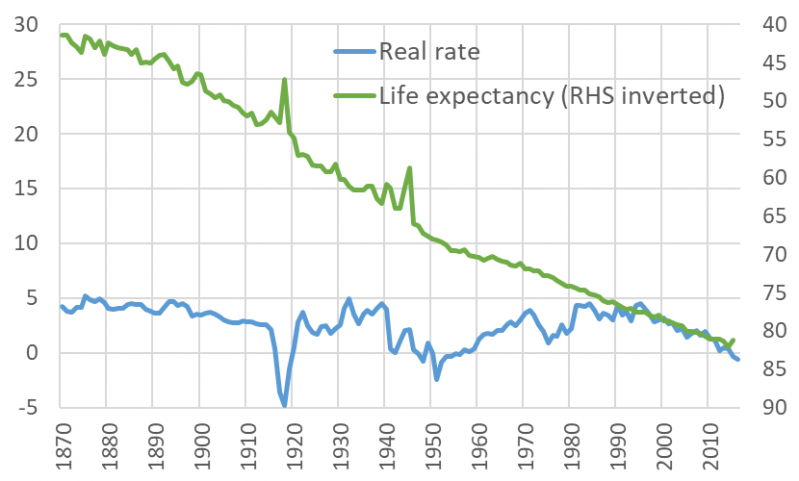
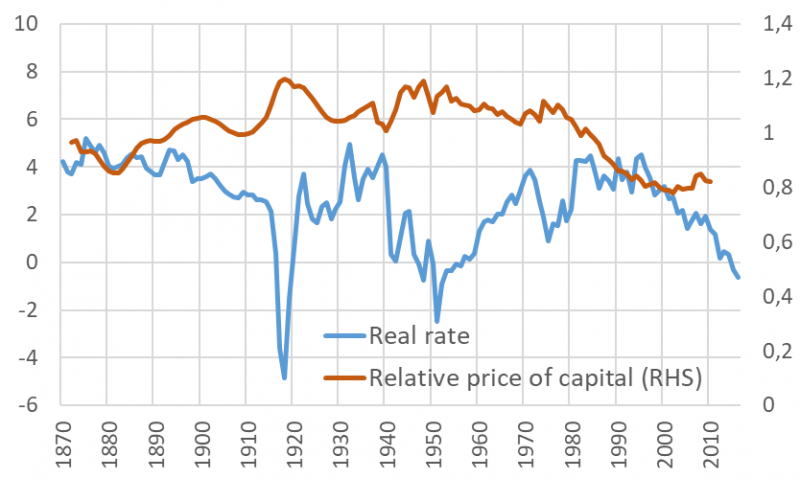
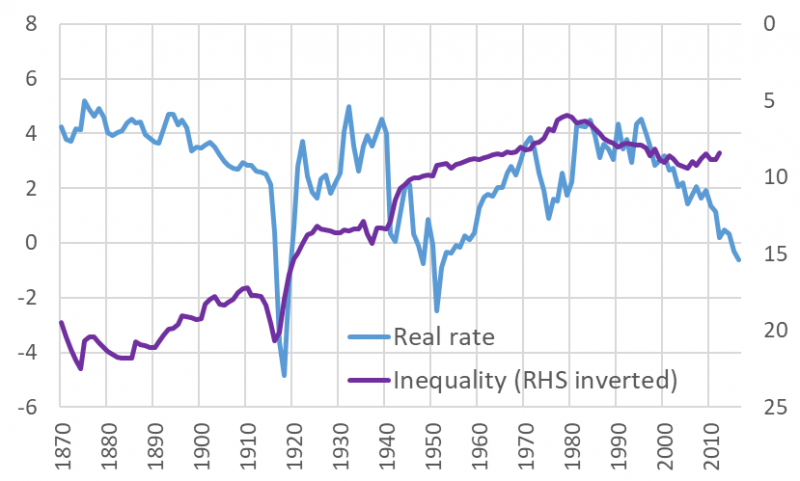
All these point to the need for an independent validation of the r-star hypothesis. One strategy is to look directly at what factors drive the real interest rate trends. The r-star hypothesis points to various saving-investment factors, the ‘usual suspects’ for causing declining real interest rates. Slowing productivity could subdue investment and lower r-star. Persistent demographic trends, such as higher life expectancy, could encourage people to save more for retirement. The hypothesised ‘saving glut’ from emerging markets could drive down r-star down globally and, with integrated markets, in advanced economies. Higher risk aversion could lower desired investment and raise desired saving. Higher income inequality could increase aggregate saving, as high-income households tend to have a lower marginal propensity to consume.
In Borio et al (2017), we directly test the hypothesised associations between real interest rates and saving-investment determinants. The sample covers a century and a half starting in 1870, which enables us to examine multiple historical trends in real interest rates, going beyond the last 20-30 years that are the focus of the studies finding support for the hypothesis. We take a global perspective and consider 19 advanced economies, exploiting both the time and cross-sectional variations. We comprehensively take into account saving-investment factors, including GDP trend growth, productivity growth, demographic variables (such as population growth, dependency ratios and life expectancy), the relative price of capital, inequality, various measures of risk premium, and the marginal product of capital. As the dependent variable, we consider short-term and long-term real interest rates (ex post and various ex ante measures), as well as Holston-Laubach-Williams r-star estimates extended further back in time.
| Graph 3 – Real interest rates and the ‘usual suspects’1 |
|
| Marginal product of capital % % |
Productivity growth % % |
 |
 |
| Dependency ratio % % |
Life expectancy % % |
 |
 |
| Relative price of capital % % |
Inequality % % |
 |
 |
| 1 All series represent cross-sectional median of 19 advanced economies. ‘Real rate’ is the 10-year nominal interest rate minus long-run expected inflation calculated with an autoregressive model. ‘Marginal product of capital’ is labour productivity divided by capital intensity times a constant capital share. ‘Productivity’ is annual total factor productivity growth.‘Dependency ratio’ is the size of people over 65 or below 19, divided by the rest. ‘Life expectancy’ is life expectancy at birth. Relative price of capital is the capital price index divided by the consumption price index. Inequality is the income share of the top 1% of the population. Source: Borio et al (2017). |
|
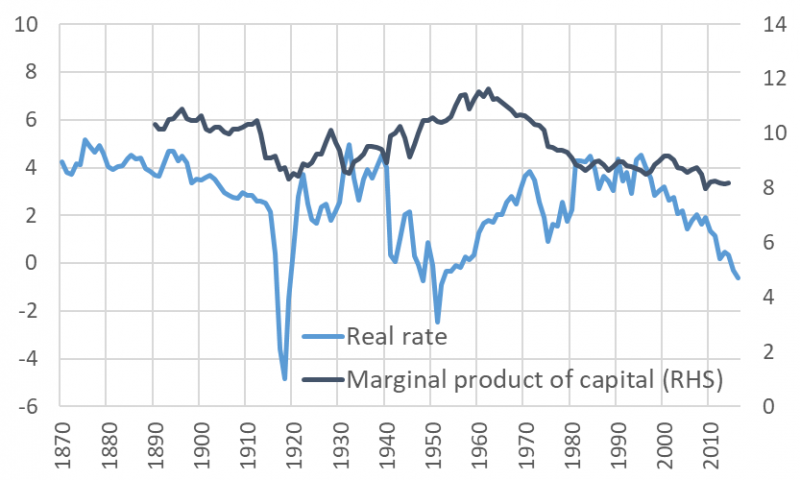
The results are surprising. While some saving-investment factors can account for the real interest rate decline over the last few decades, there is no such systematic relationship prior to this period. Graph 3 summarises this key finding by juxtaposing the cross-country median real interest rate with the median of each saving-investment factor. The marginal product of capital (MPK) should, in principles, be identical to r-star, as it incorporates all saving-investment factors’ influences. But in the data, there is little association between the real interest rate and MPK. Productivity growth, another major determinant of r-star, has indeed declined over the last 20 years, coinciding with the recent real rate trend. But the relationship breaks down in before then. The same can be said for other saving-investment variables.
The finding holds robustly in a variety of formal regressions. These include a joint specification with all factors present, in dynamic panel specifications with or without time fixed effects, and in specifications with global factors. Our results echo findings of Hamilton et al (2015) and Lunsford and West (2019), who focused on the US case and similarly found limited roles for saving-investment factors.
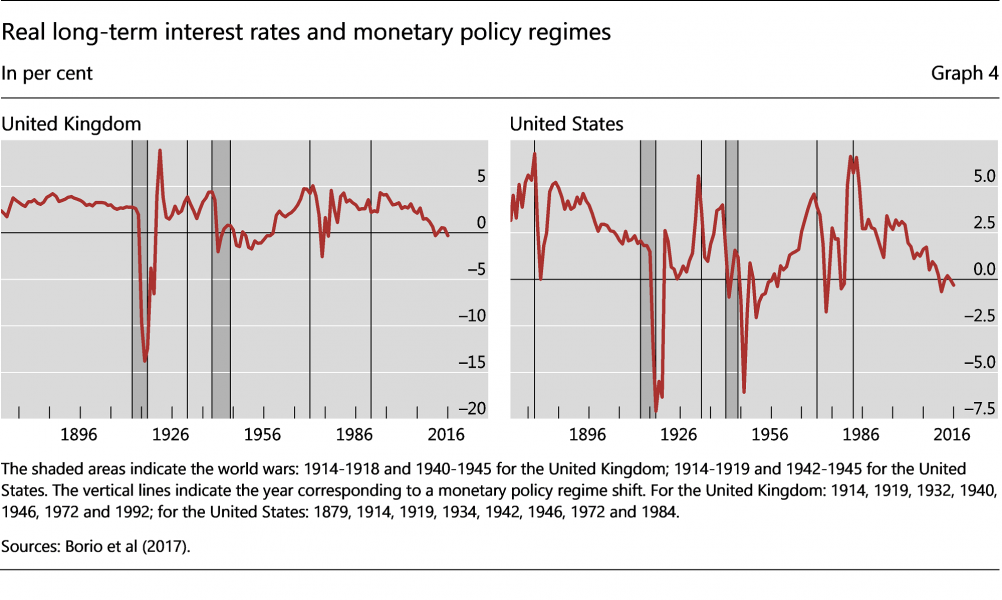
We find, in addition, that monetary policy regime shifts, such as the abandonment of gold standard in 1910s or an adoption of price-stability mandate more recently, help explain changes in real interest rate levels (Graph 4). This is so even after controlling for all saving-investment factors. The result runs counter to a key assumption of conventional models that monetary changes have no long-lasting real effects (‘money neutrality’). A violation of money neutrality, if true, would exacerbate concerns about the circularity problem associated with estimating r-star.
The idea that monetary factors can have long-lasting effect on real interest rates is, in fact, making inroads into the mainstream literature. Within the saving-investment framework, examples can be found in liquidity trap models that relate r-star to financial factors such as debt level and financial frictions. Eggertsson and Krugman (2010) analyse the problem of debt overhang in a New Keynesian setup, where a subset of households become less responsive to interest rate when they are debt-laden. This leads to a lower equilibrium real interest rate, because those unconstrained by debt need to be enticed to spend more. Mian et al (2019) study a similar problem, highlighting the role that monetary and fiscal policy plays in creating a ‘debt trap’ and low r-star situation. In a different setup, Caballero and Farhi (2017) introduce financial frictions in the form of a ‘safe asset shortage’. When safe assets are in shorter supply, there is a higher premium for them which suppresses r-star and leads to a liquidity trap. In both these cases, the low r-star has a financial cause.7
In Rungcharoenkitkul et al (2019), we explore an alternative setup where monetary policy lies at the heart of real interest rate determination. In this model, endogenous money creation by banks plays a central role. It simultaneously enables production to take place (as firms require bank loans to hire labour), and generates purchasing power through deposit creation (firms’ wage payments to households). This ensures that the supply and demand for goods is balanced ex ante, as higher production goes hand in hand with higher deposits and purchasing power. The goods market remains in equilibrium at any real interest rate, so that we can dispense with the usual concept of r-star.8 The central bank influences the bank financing cost by setting the deposit interest rate (its policy rate) via open market operations, and can sustain any level of real interest rate without upsetting the goods market clearing.
Policy constraints appear in the form of ‘financial overheating’ rather than price pressure. Banks make loan losses on loans to unproductive firms, which cannot be screened out. Due to externalities in the bank-firm matching, a coordination failure arises – each bank would set a low rate and lend aggressively when expecting others to do the same. A lower aggregate lending rate raises the number of unproductive firms and every bank’s loan losses, which no bank internalises. Left to its own devices, the banking system would alternate between spells of credit booms, where banks lend excessively but make losses that gradually deplete their capital, and credit busts where all banks curtail lending and repair their balance sheets. Output fluctuations arise because of this endogenous financial cycle. The environment creates an intertemporal tradeoff for the central bank – a larger credit boom would bring about higher output in the short run, but weaken banks and raise the likelihood of credit busts, which lower output later on.
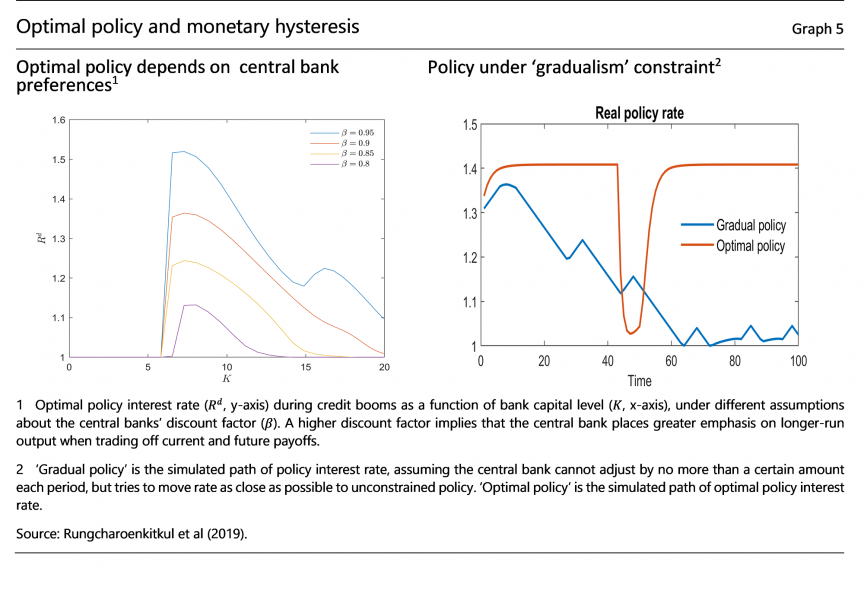
We characterise the optimal interest rate policy in the presence of this endogenous boom-bust credit cycle (Graph 5, left panel). During a boom, the central bank would set a higher interest rate than that which maximises the immediate payoff.9 Moreover, as bank capital declines during the boom and a bust becomes imminent, it is optimal to increase the policy rate. Importantly, a central bank that puts a greater weight on future outcomes sets a higher interest rate at any level of bank capital – this in turn implies a less volatile financial cycle and more stable output over time. Monetary policy frameworks or objectives thus matter for the average interest rate level as well as for long-run average output and consumption.
Failure to address the intertemporal tradeoff sufficiently can result in a ‘low interest rate trap’. Consider a naive central bank that tries to steer the policy rate as close as possible to the optimal policy, subject to a gradualism constraint that limits how much it can adjust policy each period. The policy interest rate in this case would exhibit a tendency to decline over time, even if the central bank has no bias in its preference (Graph 5, right panel). Initially when the bust starts, the central bank would nudge the interest rate lower. When the bust ends and the boom begins, there is now a larger gap between the policy rate and the optimal level needed to contain the boom. The central bank can only bridge this gap slowly given the gradualism constraint, so it ends up propelling the financial boom. As a result, the boom turns into the bust sooner, prompting the central bank to cut the rate again. Through this positive feedback process, the credit boom-bust cycle becomes more powerful, as the central bank fights off more frequent busts with an ever-lower rate. Eventually, the policy interest rate is boxed into the lower bound corner, where the central bank can never raise it enough to keep the boom under control. Hence a form of ‘monetary policy hysteresis’– failure to keep the interest rate sufficiently high today makes it even more difficult to do so tomorrow.
The extraordinary environment of unprecedented low interest rates today should encourage scrutiny of the models currently used and openness to alternative views. Our discussion suggests that it would be useful to pay close attention to the possible monetary and financial causes of low real interest rates, including in the reviews of monetary policy frameworks. After all, the standard r-star rules out monetary explanations. Because the policy implications could be considerably different and the stake is high, policymakers need to be cognizant of the r-star framework’s limitations.
Under the alternative view, low interest rates need not be a foregone conclusion. The conduct of monetary policy plays an important role. One important aspect is that policy actions today can affect the policy environment and narrow policy options tomorrow. To be sure, the focus in this article is the interaction between monetary policy and the financial cycle, but there are also other channels. A strong aversion to short-term market volatility, for example, may make the market even more sensitive to future policy surprises, entrenching the need to move gradually (see Stein and Sunderam (2018)). Dealing with these intertemporal tradeoffs may require some short-term pain that pays off in the longer term.
Borio, C, P Disyatat, M Juselius and P Rungcharoenkitkul (2017): “Why so low for so long? A long-term view of real interest rates”, BIS Working Papers no 685.
Borio, C, P Disyatat and P Rungcharoenkitkul (2019): “What anchors for the natural rate of interest?”, BIS Working Papers no 777.
Bullard, J (2018): “R-star wars: the phantom menace”, Speech at the 34th Annual National Association for Business Economics Economic Policy Conference, Washington D.C.
Caballero, R and E Farhi (2017): “The safety trap”, Review of Economic Studies, 85 (1), 223-274.
Carney, M (2019): “The growing challenges for monetary policy in the current international monetary and financial system”, Speech at the Jackson Hole Symposium, Wyoming.
Eggertsson, G and P Krugman (2012): “Debt, deleveraging, and the liquidity trap: a Fisher-Minsky-Koo approach”, the Quarterly Journal of Economics, vol 127, issue 3, August, 1469-1513.
European Central Bank (2020): “ECB launches review of its monetary policy strategy”,
https://www.ecb.europa.eu/press/pr/date/2020/html/ecb.pr200123~3b8d9fc08d.en.html.
Federal Reserve System (2019): “Review of monetary policy strategy, tools and communications”,
https://www.federalreserve.gov/monetarypolicy/review-of-monetary-policy-strategy-tools-and-communications.htm.
Hamilton, J, E Harris, J Hatzius and K West (2016): “The equilibrium real funds rate: past, present and future”, IMF Economics Review, 64, November, 660-707.
Holston, K, T Laubach and J Williams (2017): “Measuring the natural rate of interest: international trends and determinants”, Journal of International Economics, 108, supplement 1, May, S39-S75.
Lane, P (2019): “Determinants of the real interest rate”, Speech at the National Treasury Management Agency, Dublin.
Laubach, T and J Williams (2003): “Measuring the natural rate of interest”, Review of Economics and Statistics, 85, no 4, November, 1063-70.
Lunsford K and K West (2019): “Some evidence on secular drivers of US safe real rates”, American Economic Journal: Macroeconomics, vol 11, no 4, Octrober, 113-39.
Mian, A, L Straub and A Sufi (2019): “Indebted demand”, mimeo.
Powell, J (2019): “Challenges for monetary policy”, Speech at the Jackson Hole Symposium, Wyoming.
Rungcharoenkitkul, P, C Borio and P Disyatat (2019): “Monetary policy hysteresis and the financial cycle”, BIS Working Papers no 817.
Stein, J and A Sunderam (2018): “The Fed, the bond market, and gradualism in monetary policy”, the Journal of Finance, vol 73, issue 3, 1015-1060.
Warsh, K (2018): “The fault lies in r-star and in ourselves”, Opinion, the Wall Street Journal.
Wilkins, C (2020): “Our economic destiny: written in r-stars?”, Speech at the Economic Club of Canada, Toronto, Ontario.
Williams, J (2018): “’Normal’ monetary policy in words and de4eds”, Remarks at Columbia University, School of International and Public Affairs, New York City.
https://www.newyorkfed.org/newsevents/speeches/2018/wil180928
I thank Claudio Borio, Daniel Rees and an anonymous SUERF editor for their useful comments, and Emese Kuruc for her research assistance. The views expressed are my own and not necessarily those of the BIS or my colleagues.
Current unemployment rates are at or near historical lows in major economies – 3.5 percent in the US, 3.1 percent in Germany, and 2.2 percent in Japan, all below NAIRU estimates.
What causes low inflation remains a subject of open debate, and is beyond the scope of this article. The apparent disconnect between low price pressure and no/little economic slack has prompted many to cite non-cyclical factors such as globalisation, technology and demographics as potential factors.
Many governors and senior central bankers have attributed the low interest rate environment to falling natural interest rates. See Bullard (2018), Carney (2019), Lane (2019), Powell (2019), Wilkins (2020) and Williams (2018) for example.
See Federal Reserve System (2019) and ECB (2020).
The New York Fed President John Williams said “…at times r-star has actually gotten too much attention in commentary about Fed policy. Back when interest rates were well below neutral, r-star appropriately acted as a pole star for navigation. But, as we have gotten closer to the range of estimates of neutral, what appeared to be a bright point of light is really a fuzzy blur, reflecting the inherent uncertainty in measuring r-star.” (Williams, 2018). Former Fed Governor Kevin Warsh expressed a somewhat more critical view: “In my view, r-star is not a beacon in the sky but a chimera in the eye. The idea of a “neutral” rate is a useful fiction. It makes for an interesting academic thought experiment. In practice, though, it’s unobservable, unpredictable, imprecise and highly variable. That makes it a poor guide for policy makers.” (Warsh, 2018).
The saving-investment framework tends to conflate saving with financing, however, which is a conceptual drawback. See Borio et al (2019).
In the standard model, households’ intertemporal substitution is how demand excesses/shortages arise. In our setting, the supply-demand balance can be maintained under limited intertemporal substitution, which we ensure by assuming overlapping generations (OLG). Under OLG, changes in saving at the cohort level cancel out at the aggregate level in steady state. E.g. a higher spending by young households implies lower spending by old ones given the budget constraint.
In busts, there is no intertemporal tradeoff and the central bank focuses on maximising the immediate payoff. The maximum payoff in busts is still far lower than in booms, because conservative bank lending has a first-order effect on output and monetary policy is less effective.