The efficiency of banks is highly relevant for financial stability, in particular in the current low-interest rate environment. The literature has traditionally used accounting indicators to assess banks’ cost efficiency and productivity. In this note, we present the results of an industrial organisation approach-based analysis, quantifying Total Factor Productivity (TFP) growth for euro area banks and decomposing it into its main driving factors. In addition, we disentangle permanent and time-varying inefficiency in the banking sector. We focus on 17 euro area countries over the period 2006 to 2017 and find that cost efficiency in the euro area banking sector amounted to around 84% on average over the 2006 to 2017 period relative to the efficiency frontier. In addition, we observe that TFP growth for the median euro area bank decreased from around 2% in 2007 to around 1% in 2017 and that the differences between countries tend to be relatively small. These findings suggest that banks should intensify their efforts in areas such as rationalisation of branches, digitalisation of business processes and possibly mergers and acquisitions. In addition, banks should look beyond traditional cost cutting measures to reverse the trend decline in banking sector productivity.
The efficiency of the euro area banking sector is very important for financial stability. Given that banks are the largest providers of credit to companies and households in the euro area, an efficient banking sector is important to ensure low lending rates and high lending volumes. In addition, a more efficient banking sector should improve the transmission of monetary policies (Jonas and King, 2008). Moreover, banks that are more efficient are expected to be more profitable, better capitalised and more resilient to shocks. In recent years, however, weak profitability and overcapacity have become important challenges for euro area bank, in particular given the current low-interest rate environment.3
The literature has traditionally used accounting indicators to proxy efficiency in the banking sector, such as the average cost (AC) of a bank and the cost to income ratio (CIR). While these indicators are easy to compute, they are in fact ill equipped to capture efficiency in the banking sector. The AC is strongly dependent on the business model of the institutions and their size. It also depends on various country specific factors, which are outside the control of bank management. The CIR is simultaneously determined by several bank and country-specific aspects (such as bank productivity, efficiency, etc.). Moreover, income is affected by credit risk (at least indirectly).
In light of these shortcomings, we use an industrial organisation approach to compute Total Factor Productivity (TFP) growth in the euro area banking sector over the period from 2006 to 2017, decomposing TFP into its main driving factors. There is a relatively large literature estimating cost functions in Europe and abroad based on frontier analysis. Boucinha et al. (2013) use a cost function to estimate TFP in the Portuguese banking system between 1992 and 2006 and find that technological progress and scale economies shifted the cost frontier downwards throughout their period, whereas efficiency remained unchanged. Tanna et al. (2017) find a positive net impact of financial liberalisation on banks’ TFP across 88 countries over the period from 1999 to 2011. Niţoi and Spulbar (2015) find that banks in six Central and East European Countries increased efficiency between 2005 and 2008 but efficiency either stagnated or declined thereafter. Other studies link inefficiency estimates to other banking variables. For example, Altunbas et al. (2007) and Fiordelisi et al. (2011) assess the inter-temporal relationship between bank efficiency, capital and risk over the periods 1992-2000 and 1995-2007, respectively. The two papers find opposite results regarding the relationship among these variables.
An important common caveat of these studies is the assumption that all inefficiency in the banking sector is time varying. They do not distinguish between persistent and time-varying inefficiency and do not control for unobserved, bank-specific effects. By contrast, to the best of our knowledge, our analysis is the first that disentangles permanent and time-varying inefficiency in the euro area banking sector.4 We expect permanent inefficiency to play a very important role in the banking sector, as the banking industry is characterised by large sunk costs. At the same time, we expect technological progress to be the largest contributor, as traditionally found in the literature.
Total Factor Productivity (TFP) growth can be split into four main components:
We compute the four components of TFP growth using stochastic frontier analysis (SFA). The assumption behind this methodology is that the distance from the frontier is not entirely under the influence of the bank due to the random error and the functional form of the cost function.
In addition, we apply the generalized true random-effects (GTRE) model proposed by Kumbhakar et al. (2014), to decompose the error term of the stochastic cost function into:6
Our dataset consists of a panel of 2.062 commercial, cooperative and savings banks for the period 2006-2017 gathered from BankFocus (see Table 1). Commercial banks are mainly active in retail, wholesale and private banking (i.e., universal banks). Savings and cooperative banks are mainly active in retail banking (with the latter having a cooperative ownership structure).7 More than half of the banks in our sample are located in Germany. The reason is that Germany has a large system of cooperative and savings banks. Other countries with a relatively large presence in the sample are Italy (large number of cooperative banks) and Austria (savings banks). Most banks in the sample are cooperative and savings banks.
Table 1. Minimum and maximum number of banks per country and business model during the period 2006-2017
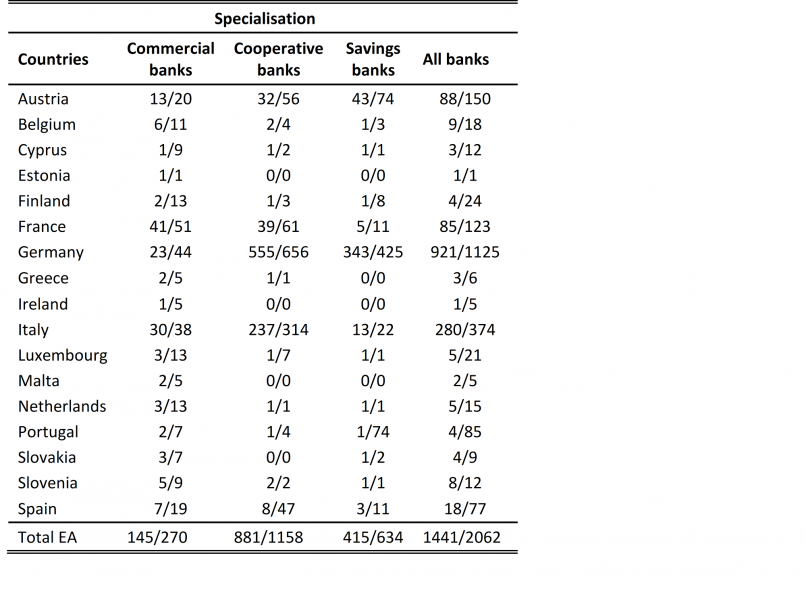
Source: Author’s calculations based on BankFocus.
Commercial banks are, on average, the largest institutions in the sample with the largest share of loans to total assets, while the share of other earning assets is broadly comparable across banks. Cooperative and savings banks are relatively more dependent on customer deposits, while commercial banks have a somewhat more diversified funding structure. Commercial banks tend to have higher average costs and staff costs than cooperative and savings banks, as they tend to offer a wider range of products to a broader range of customers, often also in foreign countries.8
Regarding the distinction between bank outputs and inputs, we adopt the accounting balance-sheet approach of Sealey and Lindley (1977) and treat liabilities as inputs and assets as outputs. In particular, we view banks as firms that use labour, fixed assets and financial capital to produce loans and other earning assets. The specification of output and input prices is similar to most previous studies on banking sector productivity (see e.g. Hughes and Mester 2008, and Fiordelisi et al. 2011). We compute the price of labour as labour expenses over the number of employees. For the price of fixed assets, we use the ratio of other (non-labour) administrative costs to fixed assets. We compute the price of funds as the ratio between interest expenses and total liabilities and total costs, our dependent variable, as the sum of these three components. Finally, we use equity to total assets as a quasi-fixed input to control for differences in risk preferences.9
We first present the results of the frontier-based technical efficiency analysis for the euro area banking sector before turning to technological progress over time.
The level of overall bank efficiency, computed as the product between persistent and time variant efficiency for the euro area banking sector was around 84% over the period from 2006 to 2017 (see Table 2). In other words, if the median bank would operate on the efficiency frontier, it could produce the same level of output with only around 84% of current costs.10 On average, across all banks, persistent (time invariant) efficiency amounted to about 88.2% while residual (time variant) efficiency amounted to about 95.4% during the period 2006 to 2017. Structural long-term factors (such as location, client structure, macroeconomic environment, regulation, etc.) thus seem to play a bigger role for bank efficiency than factors that change over time. Looking across different types of banks, there seems to be little difference within residual efficiency, while the differences are larger for persistent efficiency. In particular, cooperative and savings banks appear more efficient than commercial banks.
Table 2. Efficiency per bank specialisation (median for all banks and each category)
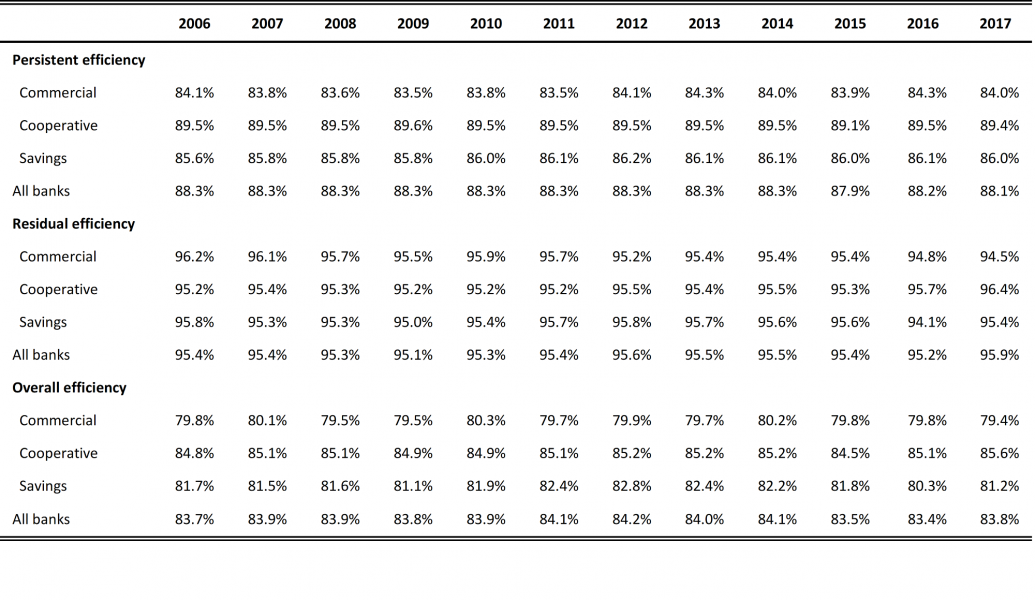
Note: For details regarding the computation of the relative distance to the frontier, see Huljak, I., Martin, R. and Moccero, D. (2019). Source: Author’s calculations based on BankFocus data.
Looking at the evolution of efficiency across bank size, measured by the respective market share in the country of origin, larger institutions tend to display lower overall efficiency scores. In 2017, the overall efficiency score for banks above the 75th percentile was around 5.5 percentage points lower than for those below the 25th percentile.11 This difference, which after a period of convergence, widened again more recently, seems to be mainly the result of differences in persistent efficiency. One reason that could explain why larger institutions are less efficient is that they are more difficult to manage, as they deploy a more sophisticated business model. Residual (time invariant) efficiency seems to be broadly unrelated to size, suggesting that lower efficiency of larger institutions is a structural rather than a time-varying phenomenon.12
The evolution of TFP growth in the euro area banking sector is estimated by aggregating the four TFP components of TFP introduced above, namely Technical efficiency, Technological progress, the scale effect and the Equity effect. Results reported in Figure 1 suggest that TFP growth of the median euro area bank was about 1.7% per year (on average) over the period between 2007 and 2017. However, TFP growth gradually decreased during this period, from above 2% in 2007 to below 1% in 2017.
Figure 1. Total factor productivity growth and components (median)
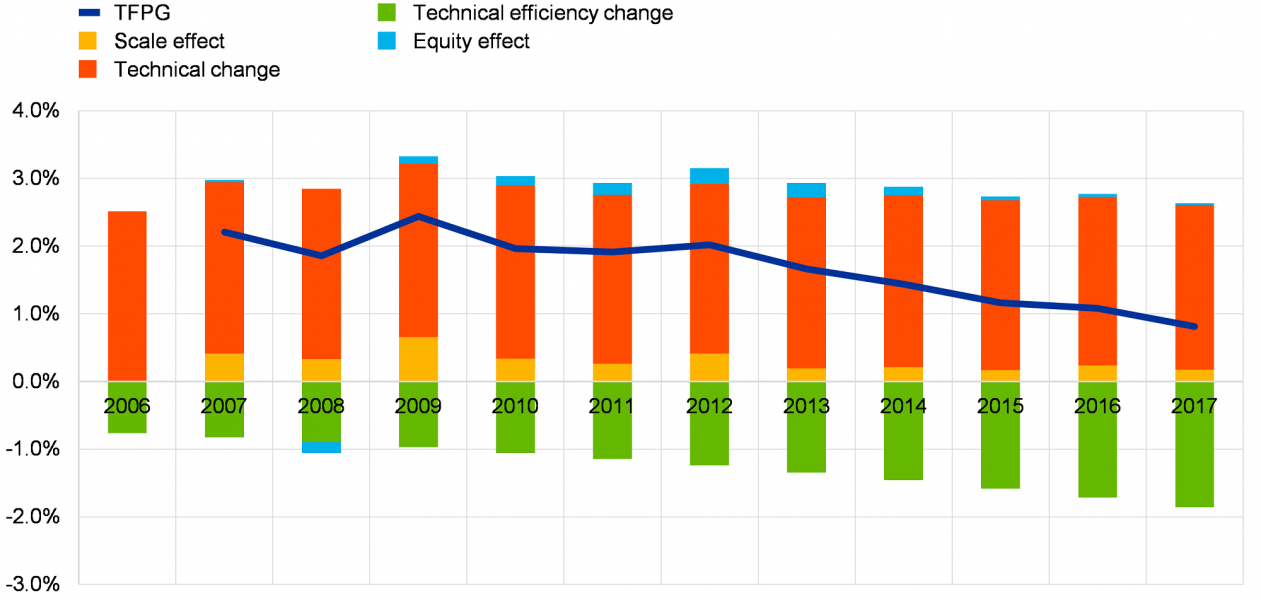
Source: Author’s calculations based on BankFocus data.
The largest component of TFP growth is technological progress and the contribution of this component remained rather stable during the last ten years, at around 2.5%. Technical efficiency change is the second largest component but unlike technological progress, it exerts an increasingly negative impact on TFP. The scale effect contributed positively to TFP growth in the euro area banking sector, although to a lesser degree over time. The equity effect played a small positive role for some years but has become largely insignificant after 2013. Overall, these results suggest that TFP growth in the euro area banking sector has gradually decreased over the last decade.
Looking at developments across those euro area countries with the largest number of banks (Austria, Germany, Spain, France and Italy), the differences between overall bank efficiency levels as well as differences in the changes in bank efficiency levels between 2006-2011 and 2012-2017 are relatively limited. TFP growth differences across countries are also relatively minor, with TFP growth decreasing over time in all five countries.
Figure 2. Efficiency and TFP growth across selected euro area countries (median)
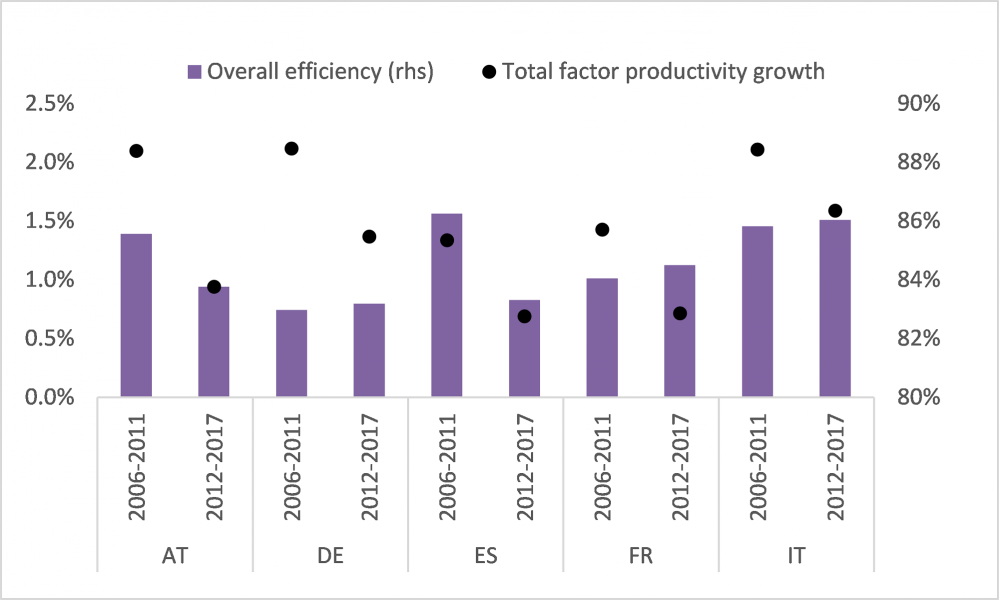
Source: Author’s calculations based on BankFocus data.
Note: The majority of euro area G-SIBs come from these five countries, which also have the highest country-specific efficiency and productivity scores.
The main findings of the paper are as follows. Overall cost efficiency for the median euro area bank amounted to around 84% on average over the period from 2006 to 2017. In other words, if the median bank would operate on the technical efficiency frontier, it could produce the same level of output with 84% of the current costs. These results are in line with other recent research in this field.
Our estimates show somewhat smaller differences across countries regarding bank efficiency than some other research in this field. The largest part of bank inefficiency in the euro area stems from persistent inefficiency, which suggests that structural long-term factors (such as location, client structure, macroeconomic environment, regulation, etc.) play a bigger role for bank inefficiency than time-specific factors. Therefore, structural policies aimed at improving persistent efficiency of the euro area banking sector should be considered.
We observe that TFP growth in the euro area banking sector decreased over the last decade from above 2% in 2007 to below 1% in 2017. This is mainly due to the increasingly negative impact of Technical efficiency change and the declining positive impact of the scale and equity effects. Overall, the trend decline in euro area banking TFP growth is undesirable, given the need to boost the profitability of euro area banks in times of stricter regulatory requirements and a protracted low-interest environment.
Our findings suggest that banks should enhance their efforts in areas such as branch rationalisation, digitalisation of business processes and possibly mergers and acquisitions. However, such cost cutting activities usually require substantial investments upfront and it might take some time until they bear fruits. In addition, our findings suggests that the magnitude of the challenge to reverse the decreasing productivity of the euro area banking industry may have been underestimated so far and that banks should look beyond traditional cost cutting measures to reverse the trend decline in banking sector productivity.
Altunbas, Y., L. Evans and P. Molyneux (2001): “Ownership and efficiency in banking”, Journal of Money, Credit and Banking, Vol. 33 (4), pp. 926–54.
Altunbas, Y., S. Carbo, E.P.M. Gardener and P. Molyneux (2007), “Examining the Relationships between Capital, Risk and Efficiency in European Banking”, European Financial Management, Vol. 13, No. 1, pp. 49–70.
Desislava, A., M. Grodzicki, C. Móré and A. Reghezza (2019), Euro area bank profitability: where can consolidation help?, ECB Financial Stability Review November 2019
Badunenko, O. and S.C Kumbhakar (2017), “Economies of scale, technical change and persistent and time-varying cost efficiency in Indian banking: Do ownership, regulation and heterogeneity matter?”, European Journal of Operational Research, Vol. 260, Issue 2, p.p. 789-803.
Baltagi, B.H. and J.M. Griffin (1988): “A General Index of Technical Change”, Journal of Political Economy, 1988, Vol. 96, Issue 1, pp. 20-41.
Boucinha, M., N. Ribeiro and T. Weyman-Jones (2013), “An assessment of Portuguese banks’ efficiency and productivity towards euro area participation”, Journal of Productivity Analysis, Vol. 39, Issue 2, pp. 177–190.
Feng, G. and A. Serletis (2009), “Efficiency and productivity of the US banking industry, 1998–2005: Evidence from the Fourier cost function satisfying global regularity conditions”, Journal of Applied Econometrics, Vol. 24, pp. 105–138.
Fiordelisi, F., D. Marques-Ibanez and P. Molyneux (2011), “Efficiency and risk in European banking”, Journal of Banking & Finance, Vol. 35, pp. 1315–1326.
Fungáčová, Z., P.-O. Klein and L.Weill (2020), “Persistent and transient inefficiency: Explaining the low efficiency of Chinese big banks”, China Economic Review, Vol. 59, February 2020.
Greene, W. (2005), “Reconsidering heterogeneity in panel data estimators of the stochastic frontier model”, Journal of Econometrics, Vol. 126, Issue 2, pp. 269–303.
Hughes, J. and L. Mester (2008), “Efficiency in banking: theory, practice, and evidence”, Working Papers, No. 08-1, Federal Reserve Bank of Philadelphia.
Huljak, I., R. Martin and D. Moccero (2019), “The cost-efficiency and productivity growth of euro area banks”, ECB Working Paper No 2305, August 2019.
Jonas, M.R. and S.K. King (2008), “Bank efficiency and the effectiveness of monetary policy”, Contemporary Economic Policy, Vol. 26, No. 4, pp. 579-589.
Kumbhakar, S.C., L. Gudbrand and J.B. Hardaker (2014), “Technical efficiency in competing panel data models: a study of Norwegian grain farming”, Journal of Productivity Analysis, Vol. 41, Issue 2, pp. 321–337.
Kumbhakar, S.C. and A. Heshmati (1996): “Technical changes and total productivity growth in Swedish manufacturing industries”, Econometric Review, Vol. 15, pp. 275–98.
Maudos, J., J.M. Pastor, F. Perez and J. Quesada (2002): “Cost and Profit Efficiency in European Banks”, Journal of International Financial Markets, Institutions and Money, Vol. 12, Issue 1, pp. 33–58.
Niţoi, M. and C. Spulbar (2015): “An Examination of Banks’ Cost Efficiency in Central and Eastern Europe”, Procedia Economics and Finance, Vol. 22, pp. 544 – 551.
Sealey, C. and J. Lindley (1977), “Inputs, outputs, and a theory of production and cost at depository financial institutions”, Journal of Finance, Vol. 32, No. 4, pp. 1251–1266.
Tanna S., Y. Luo and G. De Vita (2017), “What is the net effects of financial liberalisation on bank productivity? A decomposition analysis of bank total factor productivity growth”, Journal of Financial Stability, Vol. 30, pp. 67-78.
This note is based on Huljak, I., Martin, R. and Moccero, D. (2019), The cost-efficiency and productivity growth of euro area banks, ECB Working Paper No 2305, August 2019.
Ivan Huljak is Principal Advisor at the Croatian National Bank, Reiner Martin is Lead Economist at the Joint Vienna Institute and Diego Moccero is Principal Financial Stability Expert at the European Central Bank. The views expressed here are those of the authors and do not necessarily reflect those of their respective institutions.
See e.g. Andreeva et al. (2019).
The methodology we use was developed by Kumbhakar et al. (2014). Badunenko and Kumbhakar (2017) use it to disentangle persistent and time-varying inefficiency in the Indian banking sector. Funga c ova et al. (2020) use the approach to investigate efficiency in big Chinese banks.
See Baltagi and Griffin (1988) and Kumbhakar and Heshmati (1996).
See Greene (2005). Given the limitations of our bank sample and the degree of banking integration in the euro area, we decided to estimate a common frontier for all euro area banks rather than country-specific frontiers. We also estimated a common frontier across different types of banks to allow efficiency comparisons relative to the best practice in the entire sector, following also Altunbas et al. (2007).
We applied certain rules to remove institutions with unreliable or low quality data, or banks that might have been misclassified. See Huljak, I., Martin, R. and Moccero, D. (2019) for details.
For more details and descriptive statistics on the sample, see Huljak, I., Martin, R. and Moccero, D. (2019).
For descriptive statistics about the variables included in the model, see Huljak, I., Martin, R. and Moccero, D. (2019).
These findings are in line with those for US commercial banks (Feng and Serletis, 2009), Portuguese banks (Boucinha et al., 2013), German banks (Altunbas et al., 2001) and a sample of European banks (Maudos et al., 2002). By contrast, Fiordelisi et al. (2011) find much lower efficiency scores for European commercial banks over the period 1995-2007.
Feng and Serletis (2009), looking at a sample of US banks, also find that the largest commercial banks are less efficient than smaller banks.
For more details, see Huljak, I., Martin, R. and Moccero, D. (2019).