This analysis is an update of Falagiarda et al. (2023). The views expressed are those of the authors and do not necessarily represent those of the European Central Bank and the Croatian National Bank.
On 1 January 2023 Croatia adopted the euro and became the 20th member of the euro area. While the euro brings clear benefits for Croatia and its economy, some consumers have expressed concerns about price increases related to the euro changeover. Our analysis shows that the changeover from kuna to euro has so far had relatively little impact on Croatian consumer prices and price perceptions.
On 1 January 2023 Croatia adopted the euro and became the 20th member of the euro area.1 While the euro brings clear benefits for Croatia and its economy, some consumers have expressed concerns about possible additional price increases following the changeover from the national currency to the euro. These fears have a long history in the euro area. Media and parts of the public have often suspected that service providers such as restaurants in particular exploit the opportunity of a currency changeover to raise their prices exorbitantly. This debate about the price effects of changeovers to the euro has taken place in several countries since the entry into circulation of euro banknotes and coins in 2002. The German language even developed a word for this perceived effect: “Teuro” (from “teuer”, which means “expensive” in German). So what is the picture in Croatia a few months after it adopted the euro? In a nutshell, there is a mild price effect in the services sector but overall little evidence of a broad-based extraordinary price effect coming on top of the current inflation trend.
But let’s take a step back: price rises linked to the introduction of the euro might stem from fixed costs associated with the changeover, rounding practices to attractive price levels, but also unfair pricing behaviour by firms as a result of a lack of price transparency and competition in certain sectors.2 Croatia is a rather special case compared to earlier changeovers: it is the first changeover taking place in a high-inflation environment in the euro area. This possibly makes it easier for firms to charge more than would be justified by increases in costs or surges in demand. Although Croatian authorities have implemented several measures aimed at avoiding unjustified price increases, including a relatively long period during which dual prices must be displayed, unusual price increases have been reported since the changeover, especially in the services sector.3 But all in all, the impact on consumer prices and price perceptions in Croatia coming on top of the general inflation trend seems to have been contained so far.
Looking more closely, the Harmonised Index of Consumer Prices (HICP) for the first three months of 2023 indicate that inflation in Croatia continued its moderating trend in annual terms, decreasing from 12.7% in December 2022 to 12.5% in January, 11.7% in February and 10.5% in March 2023. Month-on-month inflation was 0.3% in January 2023, which is less than in some other euro area countries. Especially prices of food and services went up, while the prices of energy and non-energy industrial goods declined compared to December 2022. As some HICP components display a pronounced seasonality, we benchmarked the month-on-month figures for January 2023 against those recorded in the month of January over the previous ten years in order to identify unusual departures from the historical pattern. We found that the month-on-month growth rate of services prices in January 2023 was unusually high compared to past January readings (Figure 1, left panel). By contrast, month-on-month price increases for the other components were in line with historical patterns. Within the services sector in particular, bars, restaurants, hairdressers, and medical and dental services recorded high price increases. In February 2023, the month-on-month growth of Croatian HICP was 0.2%, one of the lowest increases across euro area countries, while in March 2023 was 0.8%, slightly below the euro area average. In addition, in both months all HICP components, including services, displayed a month-on-month growth in line with past regularities (Figure 1, middle and right panels), suggesting that the price impact of the euro changeover has so far been a one-off phenomenon confined to the first month of the year.
Compared with the period 2013-2022, the January 2023 HICP figures came in a context of strong inflation dynamics. To control for the different inflationary environment, we computed the difference between the month-on-month change in prices in January of year t and the average of month-on-month changes observed over the previous three, six and twelve months in year t-1. By doing so, the growth of services prices recorded in Croatia in January 2023 is very close to the upper bound of the historical range and therefore looks less pronounced (Figure 2). Seen from this angle, the unusual increases observed in January 2023 seem to be partly associated with existing underlying inflationary pressures.
Figure 1: Headline HICP inflation and its main components in Croatia (month-on-month percentage changes)
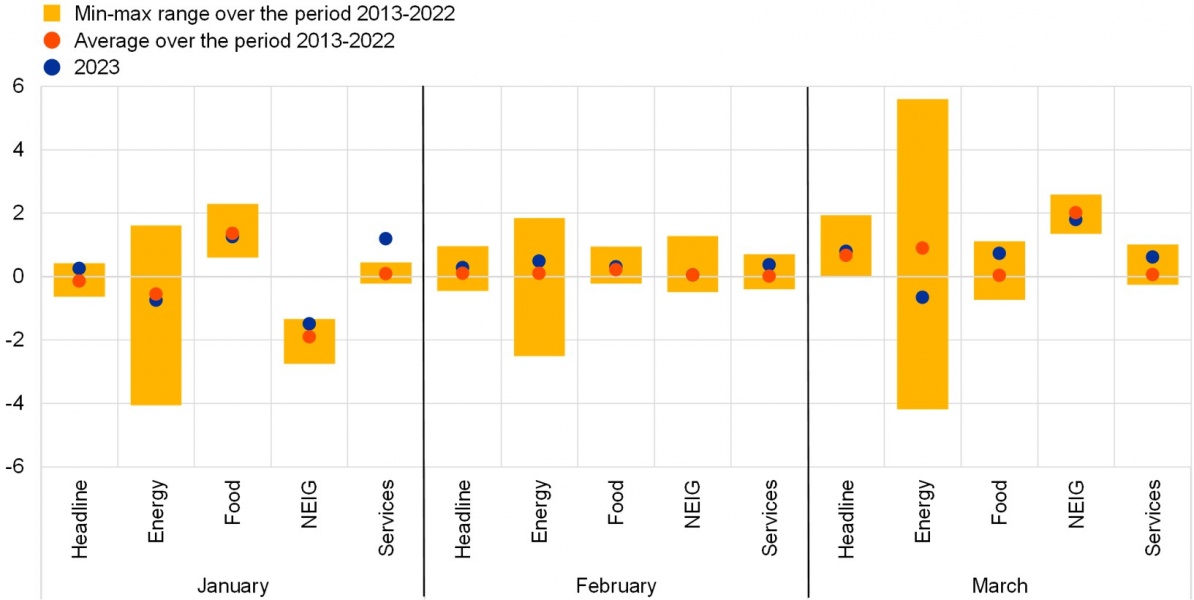
Sources: Eurostat and authors’ calculations. Notes: NEIG stands for “non-energy industrial goods”. The blue dots indicate the month-on-month percentage change in headline HICP and its components in January, February and March 2023. The red dots indicate the average month-on-month percentage change in January, February and March over the period 2013-2022. The yellow bars indicate the minimum-maximum range across month-on-month percentage changes in January, February and March over the period 2013-2022. March data based on the flash estimate released on 31 March 2023.
Figure 2: Headline HICP inflation and its main components in Croatia in January controlling for underlying inflationary pressures (differences in month-on-month percentage changes)
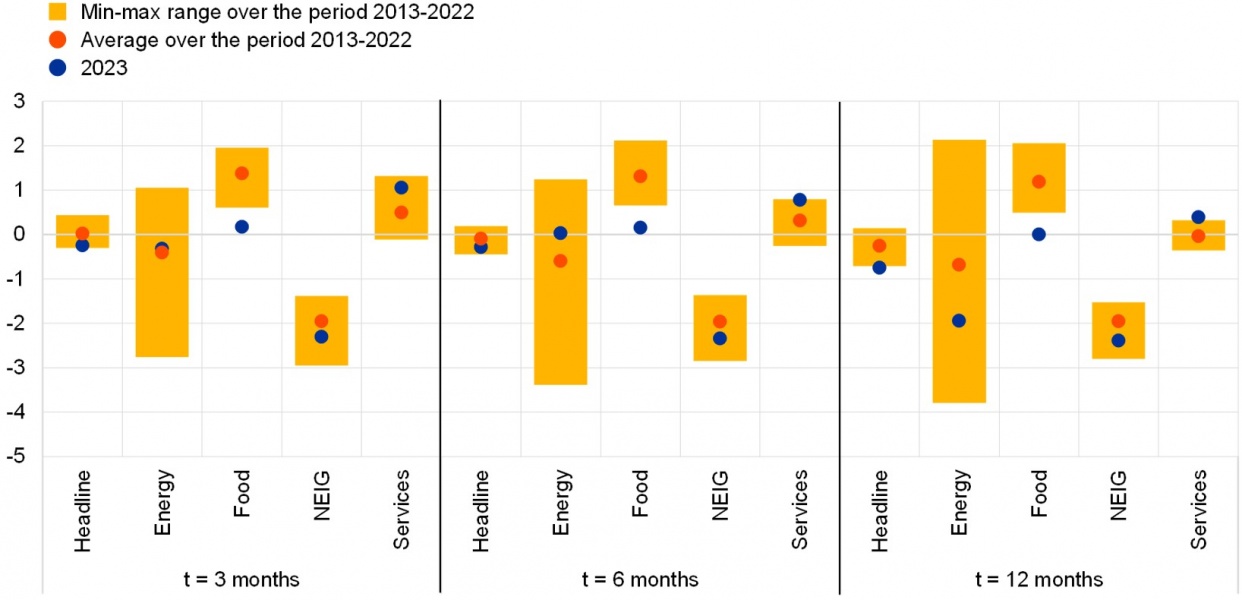
Sources: Eurostat and authors’ calculations. Notes: NEIG stands for “non-energy industrial goods”. The blue dots indicate the difference between the month-on-month percentage change in headline HICP and its components in January 2023 and the average month-on-month percentage change over the previous t months. The red dots indicate the average over the period 2013-2022 of the difference between the month-on-month percentage change in January and the average month-on-month percentage change over the previous t months. The yellow bars indicate the minimum-maximum range over the period 2013-2022 across the difference between the month-on-month percentage change in January and the average month-on-month percentage change over the previous t months.
In order to quantify the effect of the euro changeover, we assumed a hypothetical month-on-month growth rate of HICP services in January 2023 in line with the average over the period 2013-2022. According to this preliminary exercise, annual headline inflation in Croatia should have been 0.4 percentage point lower than the actual figure. In a context of higher underlying inflation compared to previous years, this early estimate marks an upper bound for the impact of the euro changeover on prices and is consistent with those from studies on previous euro changeovers. As was the case in other countries, the effect of the changeover from the national currency to the euro on consumer price inflation was generally mild, one-off and concentrated in the services sector4, which tends to be characterised by a relatively low level of competition as a result of the heterogeneity of the products offered and its local dimension.5
An analysis based on micro data from big Croatian retailers shows that the prices of around 65% of products remained unchanged from December 2022 to January 2023, with an even larger proportion of products maintaining stable prices from January to February (around 85%). This resulted in a strong decrease in the share of so-called attractive prices, those prices that sellers believe to be appealing to consumers (Figure 3). Among the remaining goods that underwent price changes (about 35% in January and 15% in February), a substantial portion of products (16% on average) exhibited a price decrease, while only around 10% (on average) experienced a price increase. This evidence suggests that retail chains have complied with the rounding rules provided for by the law, according to which prices have to be converted by applying the full amount of the conversion rate and rounding to the nearest cent. Looking ahead, it is likely that retailers will gradually set their prices at new attractive levels, as documented following earlier euro changeovers.6 Nevertheless, against the background of elevated inflation, these changes might occur as part of regular price adjustments – possibly in conjunction with higher costs – without any additional “unwarranted” impact on inflation. In addition, market competition and the obligation to display dual prices until the end of 2023 might lead retailers to adjust prices to the nearest attractive levels, which may not necessarily be higher.7
Figure 3: Pricing strategy in big retail chains in Croatia before and after the euro changeover (percentages)
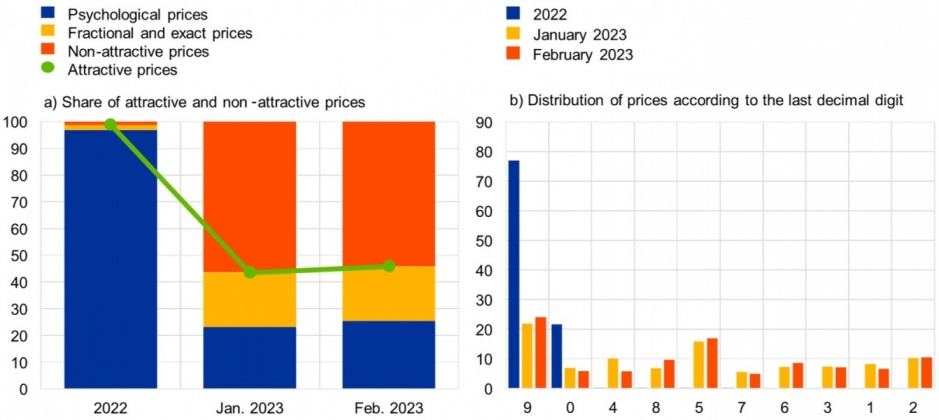
Sources: PCA (Prikupljanje cijena i analiza d.o.o.) and authors’ calculations. Notes: The analysis covers 138,452 price readings (in kuna (HRK) before the changeover, in euro afterwards) for different products (food, drinks, cleaning and maintenance products, articles for personal hygiene, etc.) from the ten biggest retail chains in Croatia. These data are highly representative for the goods in these categories and represent a substantial share of the total HICP basket. Attractive prices can be divided into three categories: (i) Psychological prices, which are those prices that are used in the belief that customers pay less attention to the digits after the decimal separator (ending with 9, 19, 29, 39, 49, 59, 69, 79, 89, 90, 95, 99 after the decimal separator); (ii) Fractional prices, which are those prices that simplify the return of change (ending with 5, 10, 15, 20, 25, 30, 35, 40, 45, 50, 55, 60, 65, 70, 75, 80, 85 after the decimal separator); (iii) Exact prices are whole numbers.
During previous euro changeovers, consumers often perceived inflation to have increased, diverging substantially from developments in measured and expected inflation. The perception of increasing prices is fuelled by consumers’ habit of emphasising price developments in frequently purchased goods and services, a possible unfamiliarity with the new currency and media reporting on rising prices. This perception gap was in the past only a temporary phenomenon with no spill-overs to the evolution of real consumption, wage formation or inflation expectations.8 In Croatia, perceived inflation remained broadly stable in the first three months of 2023 (Figure 4). At the same time, consumers foresee a decline in the 12-month-ahead inflation, confirming that inflation expectations remain anchored and unaffected by the changeover. This first evidence suggests that a perception gap in Croatia has so far not emerged, meaning that it is important to continue pursuing a proper communication strategy on the matter.9
Figure 4: Inflation perceptions and expectations in Croatia (left-hand scale: annual percentage changes; right-hand scale: balances)
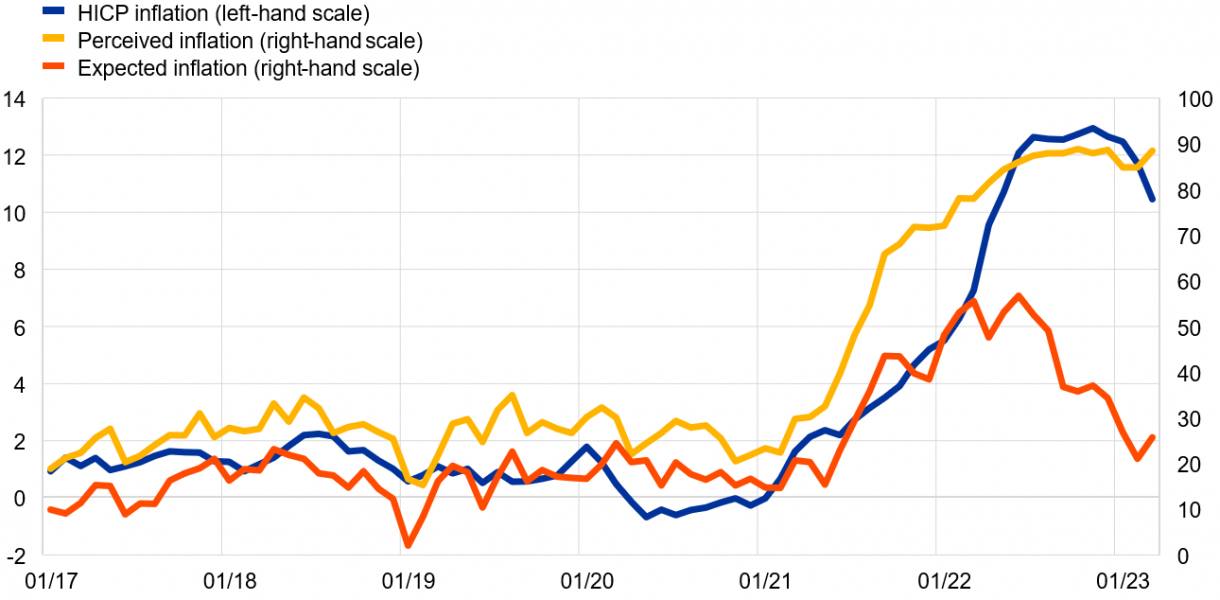
Sources: Eurostat and European Commission. Notes: Inflation perceptions and expectations obtained from the Consumer Survey of the European Commission. Inflation perceptions based on the replies to Question 5: “How do you think that consumer prices have developed over the last 12 months? They have: (a) risen a lot; (b) risen moderately; (c) risen slightly; (d) stayed about the same or (e) fallen”. Respondents may also respond “don’t know”. Inflation expectations based on the replies to Question 6 “By comparison with the past 12 months, how do you expect that consumer prices will develop in the next 12 months? They will: (a) increase more rapidly; (b) increase at the same rate; (c) increase at a slower rate; (d) stay about the same; (e) fall”. Respondents may also respond “don’t know”. The latest observations are for March 2023. March data based on the flash estimate released on 31 March 2023.
To sum up, we have shown that the impact of the euro changeover on consumer prices in Croatia has so far been relatively small and of the same order of magnitude as that observed following earlier changeovers, despite a more challenging inflationary environment. Incoming data will allow a more precise assessment of the price effect associated with the changeover, including its distributional aspects. Continued monitoring is essential. Croatia’s experience is an important lesson for other EU Member States adopting the euro, as it confirms that the economic costs arising from the effect of the changeover on inflation are limited and of a one-off nature.
Angeloni, I., Aucremanne, L. and Ciccarelli, M. (2006), “Price setting and inflation persistence: did EMU matter?”, Economic Policy, Vol. 21(46)
Aucremanne, L., Boeckx, J., Dhyne, E. and Smets, J. (2009), “What have we learned about prices and inflation in 10 years of monetary union?”, L’Europe en Formation, Vol. 351(1)
Banco de España (2003), “The Effect of the Euro Cash Changeover on Inflation”, Annual Report 2002
Banco de Portugal (2002), “Analysis on the impact of the conversion of escudos into euros”, Economic Bulletin, September 2002
Banque de France (2002), “L’impact à court terme sur les prix du passage à l’euro fiduciaire”, Bulletin No. 105
Cavalleri, M. C., Eliet, A., McAdam, P., Petroulakis, F., Soares, A. and Vansteenkiste, I. (2019), “Concentration, market power and dynamism in the euro area”, Working Paper Series No. 2253, European Central Bank
Del Giovane, P. and Sabbatini, R. (2008), “The euro, inflation and consumers’ perceptions – Lessons from Italy”, Springer
Deutsche Bundesbank (2004), “The euro and prices two years on”, Monthly Report, January 2004
Dziuda, W. and Mastrobuoni, G. (2009), “The euro changeover and its effects on price transparency and inflation”, Journal of Money, Credit and Banking, Vol. 41(1)
ECB (2006), “Competition, Productivity and prices in the euro area services sector”, Occasional Paper Series No. 44, European Central Bank
Ehrmann, M. (2006), “Rational inattention, inflation developments and perceptions after the euro cash changeover”, Working Paper Series No. 588, European Central Bank
Eife, T. A. and Coombs, W. T. (2006), “Coping with people’s inflation perceptions during a currency changeover”, Discussion Paper Series No. 435, University of Heidelberg
Ercolani, M. G. and Dutta, J. (2007), “The Impact of the euro changeover on inflation: evidence from the Harmonised Index of Consumer Prices”, In: Cobham, D. (eds) The Travails of the Eurozone. Palgrave Macmillan
Eurostat (2003), “Euro changeover effects”, News release 69/2003
Eurostat (2007), “Euro changeover and inflation in Slovenia”, March 2007
Eurostat (2008), “Euro changeover and inflation in Cyprus and Malta”, April 2008
Eurostat (2009), “Euro changeover and inflation in Slovakia”, March 2009
Eurostat (2011), “Euro changeover and inflation in Estonia”, May 2011
Eurostat (2014), “Euro changeover and inflation in Latvia”, November 2014
Eurostat (2015), “Euro changeover and inflation in Lithuania”, December 2015
Falagiarda, M. and Gartner, C. (2023), “Croatia adopts the euro”, Economic Bulletin, Issue 8, ECB, 2022
Falagiarda, M., Gartner, C., Mužić, I. and Pufnik, A. (2023), “Has the euro changeover really caused extra inflation in Croatia?”, The ECB Blog, 7 March 2023
Folkertsma, C. K., van Renselaar, C. and Stokman, A. (2002), “Smooth euro changeover, higher prices? Results of a survey among Dutch retailers”, Research Memorandum WO No. 682
Hobijn, B., Ravenna, F. and Tambalotti, A. (2006), “Menu Costs at Work: Restaurant Prices and the Introduction of the Euro”, The Quarterly Journal of Economics, Vol. 121(3)
Hüfner, F. and Koske, I. (2008), “The euro changeover in the Slovak Republic”, OECD Economics Department Working Papers No. 632
IMAD (2007), “Euro Changeover Effect on Inflation in Slovenia”, Slovenian Economic Mirror, Economic Analyses, Vol. 13 (2)
Jouvanceau, V. (2021), “The Effect of the Euro Changeover on Prices: Evidence from Lithuania”, Working Paper Series 93/2021, Lietuvos bankas
Kotliński, K. (2020), “Contributions to inflation after euro adoption: the case of Central and Eastern European countries”, Ekonomia i Prawo. Economics and Law, Vol. 19(2)
Mužić, I. and Pufnik, A. (2022), “Possible effects of the rounding of food product prices on inflation when adopting the euro”, HNBlog, December 2022
National Bank of Belgium (2002), “Effets du passage à l’euro fiduciaire sur l’inflation”, Revue Économique, June 2002
Rõõm, T. and Urke, K. (2014), “The euro changeover in Estonia: implications for inflation”, Working Paper Series 6/2014, Eesti Pank
Sturm, J. E., Fritsche, U., Graff, M., Lamla, M., Lein, S., Nitsch, V., Liechti, D. and Triet, D. (2009), “The euro and prices: changeover-related inflation and price convergence in the euro area”, European Economy – Economic Papers 381, European Commission
For more details on Croatia’s accession to the euro area, see Falagiarda and Gartner (2023).
There is extensive research on the price effects of the euro changeover (Angeloni et al., 2006; Ehrmann, 2006; Hobijn et al., 2006; Ercolani and Dutta, 2007; Dziuda and Mastrobuoni, 2009).
In addition to strengthening monitoring activities, Croatian authorities are imposing fines and whitelisting firms.
Upper bound estimates for the euro area (before the 2007 enlargement) range from 0.22 percentage points (Sturm et al., 2009) to 0.45 percentage points (internal Eurosystem estimates), with Eurostat’s estimate standing at 0.29 percentage points (Eurostat, 2003). Euro area figures typically mask cross-country heterogeneity, which can be explained by differences in the conversion rates, in the degree of price transparency and competition in some sectors, and in the costs associated with the changeover. As regards the countries that adopted the euro after 2002, Eurostat’s upper bound estimates range from 0.11 percentage points for Lithuania to 0.3 percentage points for Slovenia, Cyprus, Malta, Slovakia and Estonia, while for Latvia the price effect of the changeover is estimated 0.21 percentage points (Eurostat, 2007; 2008; 2009; 2011; 2014; 2015). For country-specific analyses, see Banque de France (2002), Folkertsma et al. (2002), National Bank of Belgium (2002), Banco de Portugal (2002), Banco de España (2003), Deutsche Bundesbank (2004), IMAD (2007), Del Giovane and Sabbatini (2008), Hüfner and Koske (2008), Rõõm and Urke (2014), Kotliński (2020), Jouvanceau (2021).
See, for example, ECB (2006) and Cavalleri et al. (2019).
See Chapter 7 in Del Giovane and Sabbatini (2008).
For more details, see Mužić and Pufnik (2022).
For more details, see Aucremanne et al. (2009).
See, for example, Eife and Coombs (2006).