menu
close

Author(s):

Guido Ascari | De Nederlandsche Bank
Paolo Bonomolo | De Nederlandsche Bank
Marco Hoeberichts | De Nederlandsche Bank
Riccardo Trezzi | University of Geneva

Keywords:

Inflation , demand , supply

JEL Codes:

E3 , E5

The views expressed are those of the authors, and do not necessarily reflect the official views of De Nederlandsche Bank. A more extensive version of this policy note can be found on the website of the De Nederlandsche Bank at: The euro area great inflation surge (dnb.nl)

How did inflation get so high? We present a narrative of the recent inflation surge in the Euro Area, based on a simple Macro101 AS-AD diagram, backed by empirical evidence. In particular, we identify three phases: the Covid shock, interpreted as a combination of negative supply and negative demand; the re-opening phase, in which aggregate demand increased sharply while supply only partially recovered; the post-reopening phase, characterised by a negative supply shock related to the sharp increase in energy prices, combined with a further increase in aggregate demand. We contrast the widespread view that merely focuses on energy prices and supply constraints with a more complex narrative, where both supply and demand factors contributed to the inflation surge and their relative contribution evolved over time. As from the standard policy trade-off after a negative supply shock, the positive pressure from demand during the last phase, while contributing to the increase in inflation, prevented the economy from falling into a severe recession. Our narrative is supported by a Bayesian VAR analysis.

1. Introduction

How did inflation get so high, and what are its main drivers? This question is at the center of the academic and policy debate right now. Its answer is crucial for policy. We show why the current debate, often solely focusing on energy prices, fails to appreciate the complexity of what happened: demand and supply both contributed to output and inflation dynamics but their absolute (and relative) contributions have changed over time. While price pressures were already building before the natural gas shock, an inflationary impulse in one sector (energy) has quickly become broad based because demand conditions remained accommodative facing the negative supply shock.

2. What happened through the lengths of a Macro101 AS-AD model

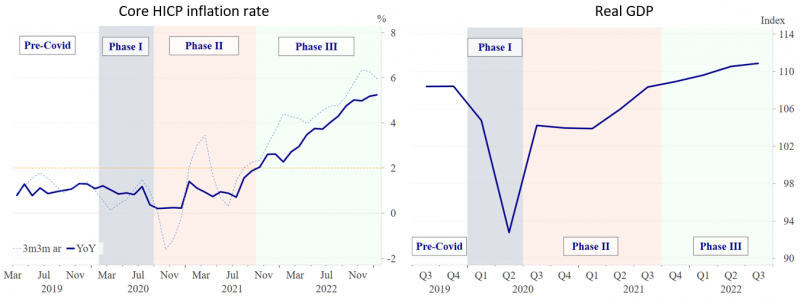
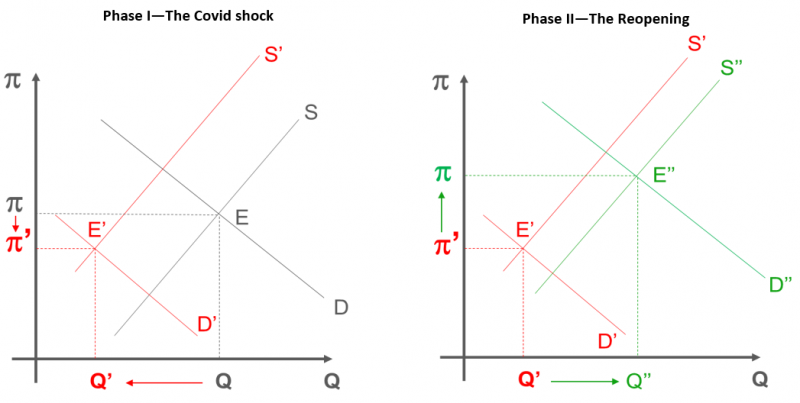
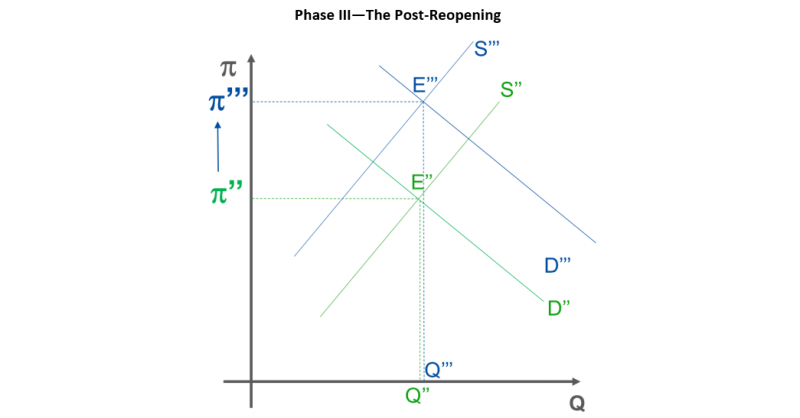
We define three chronological phases. Phase I: the covid shock (Q1 and Q2:2020); Phase II: the re-opening of the economy (Q3:2020 to Q3:2021) Phase III: the post re-opening (Q4:2021 to present). With the lens of a simple aggregate demand and aggregate supply (AS-AD) model, we first set the narrative of the relative movements of inflation and real activity of the last 3 years. Figure 1 shows the evolution of core HICP inflation and real output in the Euro area. Figure 2 shows our explanation of what happened in each phase using the AS-AD diagram.
Figure 1: Core HICP inflation rate and real GDP in the Euro area
 width=
The Covid shock (Phase I) and the following restrictions are usually interpreted as a combination of a negative supply shock and a negative demand shock. Indeed, Euro Area GDP shows an unprecedented fall and a deceleration of inflation, suggesting that in phase I the large negative demand shock more than offset the negative supply shock. In the AS-AD diagram, aggregate supply (S) shifts up and to the left (from S to S’), and aggregate demand (D) shifts down to the left (from D to D’).
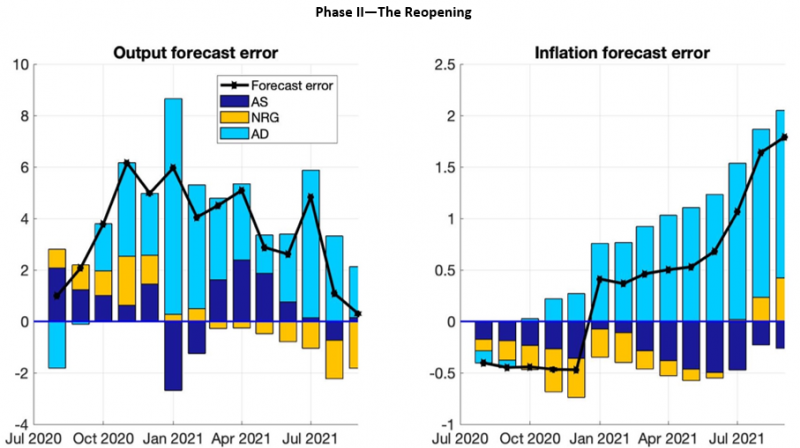
The re-opening of the economy (Phase II) was characterized by an increase in demand and supply constraints. As a result, output expanded and inflation increased. Aggregate demand, both private and public (stimuli), expanded sharply in phase II.  In some dimensions (i.e. retail sales), demand went above pre-Covid levels. Aggregate supply experienced difficulties in copying with the increase in demand, because of global supply chains bottlenecks, intermediate goods and labor shortages. In terms of the AS-AD diagram, the economy moved from E’ to E’’, a point associated with output drifting to pre-Covid levels, but with higher inflation.
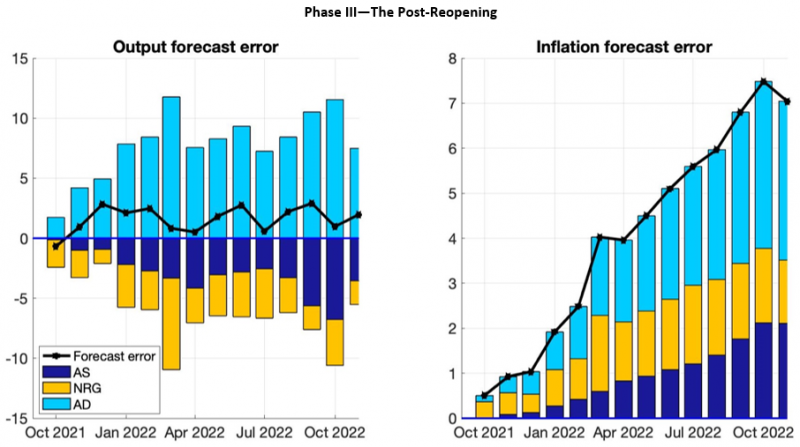
The post-reopening phase experienced an additional negative supply shock and a positive aggregate demand shock, resulting in further price pressures. In phase III, global supply chains recovered and the economies reopened further but starting in late 2021, aggregate supply in the Euro Area was hit again by a negative shock, although of a different kind this time: a sharp increase in energy prices. Both households and firms raised their consumption/investment in mid-2022 as a result of pent-up demand and extra savings. The labor market remained tight and government consumption remained elevated. In terms of the AS-AD model, the economy moved from E’’ to E’’’, a point with output similar to pre-Covid but with much higher inflation.
Figure 2: AD-AS diagram and the three phases
 width=
 width=

3. The role of supply and demand factors through the lens of a Vector Autoregressive model

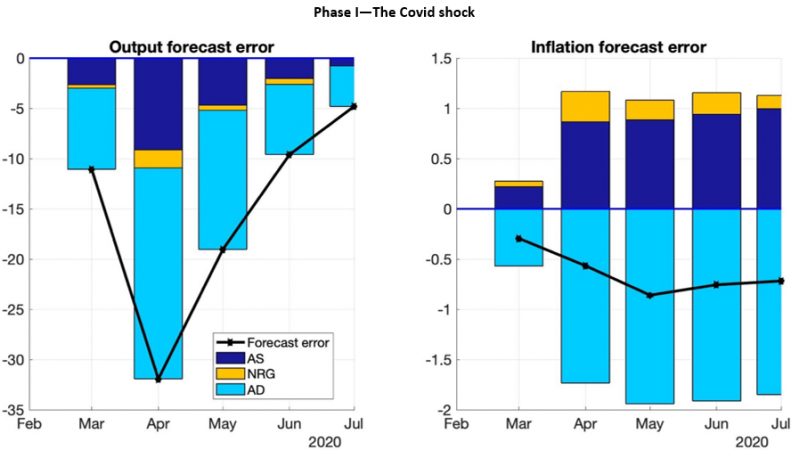
In order to identify the role of supply and demand factors in the data, we rely on a Vector Autoregressive model (VAR) forecast errors. We use conventional sign restrictions to identify supply and demand shocks: the former move inflation and output in opposite directions while the latter move them in the same direction. Among the supply factors, we also identify an energy shock, that is an exogenous pressure specific to the HICP energy component. Conditional on the information set at time “t”, the model forecast errors are generated by unexpected shocks that can be decomposed in demand and supply-driven, according to the relative movements of output and inflation.
Our analysis confirms that the first few months of the pandemic demand and supply both moved down lowering inflation and economic activity. On the other hand, the re-opening phase is characterized by positive pressure from demand and a partial recovery of supply. Energy prices start putting upward pressure on inflation at the end of Phase II. Finally, in Phase III the model estimates a positive demand shock, and a negative supply shock with an important contribution of energy. The combination of negative supply and positive demand shocks explains why inflation has surprised so much on the upside in phase III.
Our results provide a different perspective on the real-time policy debate which was dominated by the idea that the inflation dynamics was entirely supply-driven and that monetary policy should have looked through temporary supply shocks. As said, the data do not show a sharp drop in economic activity that a severe supply shock should cause precisely because demand remained accommodative.
Figure 3: VAR-based forecast errors (output and inflation)
 width=
 width=
 width=

4. Conclusions

Our analysis shows that inflation in the Euro area was sparked by the reopening of the economy and by supply side constraints. Then, the commodity cycle first, and the Ukraine war afterwards, added to the supply side problem a cost -push shock that firms passed to consumers by increasing prices and preserving their margins. The main take away from our analysis is that this was possible because demand remained sustained for the whole period after re-opening. After all, what happened is nothing but the policy trade-off between growth and inflation generated by a negative supply shock.

References

Andersson, M., Doleschel, J., Gomez-Salvador, R., Gonçalves, González Pardo, B., E., Koester, G., and Lebastard, L., (2022). “Inflation developments in the euro area and the United States” Economic Bulletin Boxes, European Central Bank, vol. 8. https://www.ecb.europa.eu/pub/economic-bulletin/focus/2023/html/ecb.ebbox202208…
Arias, J. E., Rubio-Ramírez, J. F., & Waggoner, D. F. (2018). “Inference Based on SVARs Identified with Sign and Zero Restrictions: Theory and Applications”, Econometrica, 86(2), 685–720.
Binici, M., Centorrino, S., Cevik, S., and Gwon, G. (2022). “Here Comes the Change: The Role of Global and Domestic Factors in Post-Pandemic Inflation in Europe”, IMF Working Papers, 2022(241), https://www.elibrary.imf.org/view/journals/001/2022/241/article-A001-en.xml
Cascaldi-Garcia, D., Musa O., and Zina S. (2023). “Drivers of Post-pandemic Inflation in Selected Advanced Economies and Implications for the Outlook,” FEDS Notes. Washington: Board of Governors of the Federal Reserve System, https://doi.org/10.17016/2380-7172.3232
Eickmeier, S. and Hofmann B. (2022). “What drives inflation? Disentangling demand and supply factors” BIS Working Papers, No 1047, November. https://www.bis.org/publ/work1047.pdf
Gomez-Salvador, R., Koester, G., and Ricarte, S. C., (2022). “Recent inflation developments in the United States and the euro area – an update,” Economic Bulletin Boxes, European Central Bank, vol. 1. https://www.ecb.europa.eu/pub/economic-bulletin/focus/2022/html/ecb.ebbox202201…
Gonçalves, E. and Koester, G., (2022). “The role of demand and supply in underlying inflation – decomposing HICPX inflation into components,” Economic Bulletin Boxes, European Central Bank, vol. 7. https://www.ecb.europa.eu/pub/economic-bulletin/focus/2022/html/ecb.ebbox202207_07~8b71edbfcf.en.html
OECD (2022), OECD Economic Outlook, Volume 2022 Issue 2, OECD Publishing, Paris, https://doi.org/10.1787/f6da2159-en
Koester, G., Nordeman, J., and Soudan, M. (2021). “Comparing recent inflation developments in the United States and the euro area,” Economic Bulletin Boxes, European Central Bank, vol. 6. https://www.ecb.europa.eu/pub/economic-bulletin/focus/2021/html/ecb.ebbox202106_01~11705a988e.en.html
Shapiro, A.H., “How Much Do Supply and Demand Drive Inflation?” (2022a), FRBSF Economic Letters, No 2022-15, Federal Reserve Bank of San Francisco, June 2022, https://www.frbsf.org/economic-research/publications/economic-letter/2022/june/how-much-do-supply-and-demand-drive-inflation/
Shapiro, A.H., “Decomposing Supply and Demand Driven Inflation”, (2022b) Working Papers, No 2022-18, Federal Reserve Bank of San Francisco, October 2022, https://www.frbsf.org/economic-research/publications/working-papers/2022/18/
Villani, M. (2009), “Steady-state priors for vector autoregressions”, Journal of Applied Econometrics, Vol. 24, No.4
Wolman, A. L. (2021), “How Broad-Based Is the Recent High Inflation?”, Richmond Fed Economic Brief, 21(30), https://www.richmondfed.org/publications/research/economic_brief/2021/eb_21-30

About the authors

Guido Ascari

Guido Ascari is the head of Monetary Research at De Nederlandsche Bank and Professor of Economics at University of Pavia. He was formerly a professor of Economics at Oxford University. His main contributions to the literature deal with the analysis of monetary policy and inflation dynamics. He holds a Ph.D. in Economics from the University of Warwick and from the University of Pavia.

Paolo Bonomolo

Paolo Bonomolo is a researcher at the Research Department of De Nederlandsche Bank. Before joining DNB he has been working at the Modelling Division of the Sveriges Riksbank . He obtained a Ph.D in Economics from University of Pavia.

Marco Hoeberichts

Marco Hoeberichts is an Economist at De Nederlandsche Bank. Marco previously worked at Tilburg University, Bank of Spain and Center for Financial Studies in Frankfurt. He holds a PhD in Economics from Tilburg University.

Riccardo Trezzi

Riccardo Trezzi is a Lecturer at the University of Geneva and founder of UnderlyingInflation.com. Riccardo worked on the inflation desk of the Federal Reserve in Washington D.C. and of the European Central Bank in Frankfurt. He holds a Ph.D. in Economics from the University of Cambridge in the U.K.

More on these topics

Tags: