This paper analyses the effects of the COVID-19 pandemic shock on small open economies in the euro area. Accounting for a high degree of openness and a strong dependence on intra and extra union trade, we focus on the size and the direction of international spillovers – both from the shock itself and from the ensuing fiscal response. To do so, we use a unified modelling framework: The Euro Area and the Global Economy (EAGLE) model. Within this general framework, we assess the extent to which specific modelling features shape the dynamic responses to the COVID-19 pandemic. The main messages are as follows. First, fiscal spillovers from the rest of the monetary union do matter. Second, the design of wage negotiations leads to wage subsidies having negative international fiscal policy spillovers. Third, import content of government spending interacts with the effective lower bound, strongly affecting the size and sign of spillovers. Finally, a next generation EU instrument is more effective when financed using a tax on consumption.
The COVID-19 pandemic produced an unprecedented global crisis. Faced with a health versus recession trade-off, most governments decided to shut down most non-tradable sectors, and also many tradable ones. At the same time, governments enacted large fiscal support packages. For a small and open economy in a monetary union, the impact of such an action is amplified by large financial and trade linkages.
We focus on the size and the direction of the international spillovers due to the COVID-19 pandemic itself and from the ensuing fiscal response. We use different country versions of the Euro Area and Global Economy (EAGLE) model (Gomes et al., 2012) which is a dynamic general equilibrium model (DSGE) of the euro area within the global economy.2 We calibrate the various versions of the model to four small open economies (SOEs): Ireland, Luxembourg, the Netherlands and Slovenia.3 We find significant spillover effects, either from within or from outside the EA. The rest of the EA (REA) is the largest trading partner of all modelled SOEs. Consequently, the direct international spillover effects mostly stem from this region (intra euro area effects). However, we also find large international spillover effects from the rest of the world (RW) or from the US, which transmit to the domestic SOE both directly and via the REA (extra euro area effects).
We also assess fiscal spillovers of the large-scale countercyclical fiscal policy intervention and find significant effects from the domestic fiscal stimulus, but also strong spillovers from the fiscal stimulus in the REA. Importantly, these spillovers depend on the fiscal instrument and may not be expansionary if the measures undertaken are aimed at the supply side in the presence of the effective lower bound. We show that spillovers from demand side measures can be quite significant. Finally, we explore the macroeconomic effects of the Next Generation EU program and find that it is important which instrument is used to finance the EU budget.
We assess how domestic output and inflation would have responded to the COVID shock if either the REA, the US or the RW had been immune to the pandemic. To this end, we first define the following statistic:
![]()
Here ![]() is the variable of interest (e.g., Dutch output) at time t in the baseline scenario, and
is the variable of interest (e.g., Dutch output) at time t in the baseline scenario, and ![]() is its counterpart in a hypothetical scenario where bloc i = {REA, US, RoW} is not hit by the COVID shock.
is its counterpart in a hypothetical scenario where bloc i = {REA, US, RoW} is not hit by the COVID shock.
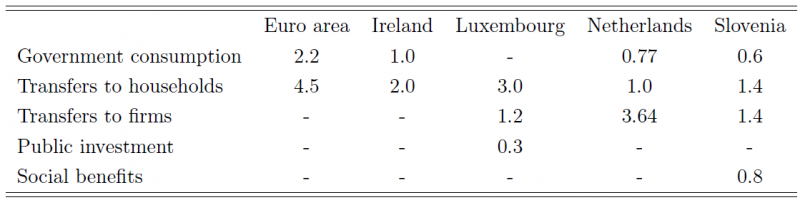
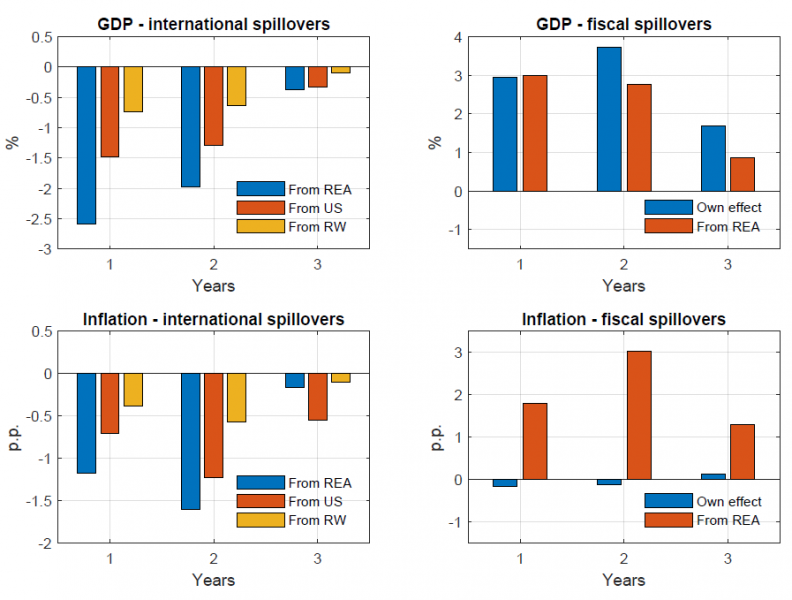
Figures 1-4 illustrate international spillovers for output and inflation. Three key channels govern international spillovers in our economies. First, there is a direct demand channel. Even if prices remain unchanged, a fall in economic activity among trading partners has a detrimental effect on exports. Second, the reaction of prices, and in particular the exchange rate in the case of extra-monetary union trade, can either mitigate or aggravate the consequences of the decrease in foreign demand. Here, the effective lower bound (ELB) in the euro area causes the exchange rate to appreciate, which negatively affects countries that trade more with non-EA regions. Third, when government spending has a significant import component, government spending expansion in the main trading partners can help the economy to alleviate the real interest rate increase due to the ELB.
For Ireland (Figure 1) spillovers reflect the structure of its foreign trade, which is much more open to non-EA regions. Spillovers from the RW, which includes the UK, are the strongest, amounting to about 1 p.p. of GDP (i.e., Irish output would drop by 1 p.p. less if there was no shock in the RW), followed by the spillovers from the US, and by the spillovers from the REA. When there is an effective lower bound for the EA, but not for the US and the RW, the euro appreciates after the shock, because the non-euro blocs can lower their interest rates. If the US or the RW are not hit by the shock, the real exchange rate for Ireland appreciates less, which implies that exports to the US or the RW are less affected by the relative price. The exchange rate channel is much less powerful in trade with the REA, because the nominal exchange rate is fixed and the real exchange rate only reflects relative changes in (sticky) goods prices, resulting in lower spillovers. Nominal exchange rate appreciation lowers inflation through lower import prices and reduces foreign demand. The latter affects domestic production and labour demand, resulting in lower wages and marginal costs, which lowers inflation. Lower wages spill over to all sectors of the economy due to the ability of marginal workers in tradable and non-tradable sectors to move between sectors. This negative inflation effect compounds the effect of nominal appreciation. Therefore, when there is no shock in the RW (to which Ireland is most exposed), the drop in inflation is substantially reduced. The nominal exchange rate effect is absent for trade with the REA, but the global shock causes an appreciation of the euro and this induces a recession in the entire monetary union. Inflation in Ireland falls by slightly more when the REA has not been affected by the shock, because the expected future path of the euro interest rate is higher, as part of the area has not been hit by the shock, so the appreciation is stronger.
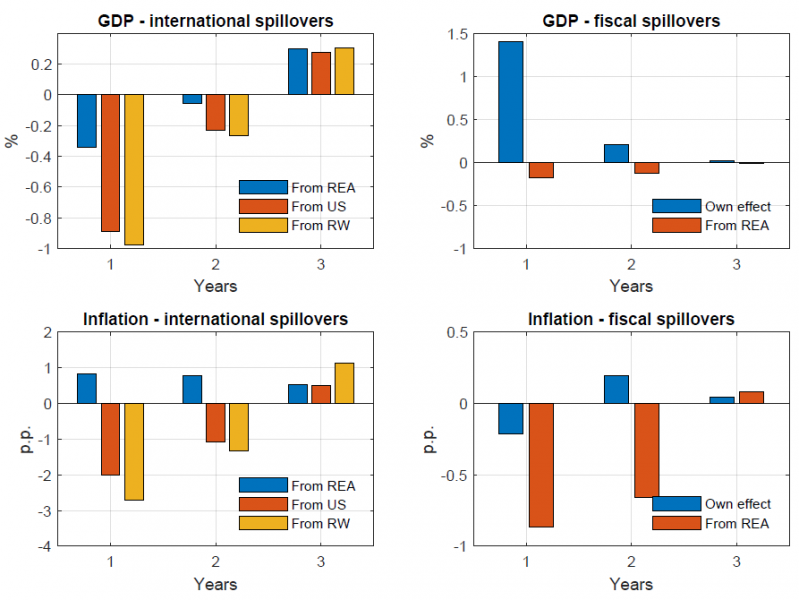
In Luxembourg (Figure 2), the strongest spillovers come from within the monetary union, since the REA bloc is by far the largest trading partner. Luxembourg also features the strongest negative spillovers: on impact, the decline in output in the absence of euro area shocks is 0.6% instead of 7.6%.4 The large export to GDP ratio (close to 190%) provides the main explanation for this result. In terms of inflation, the bottom left panel in Figure 2 reveals sizeable spillovers and provides an interesting insight. In the absence of strong output spillovers, the fall in aggregate demand in Luxembourg is not enough to offset the inflationary pressures from the negative supply shocks. That is why Luxembourg inflation is higher without foreign shocks.
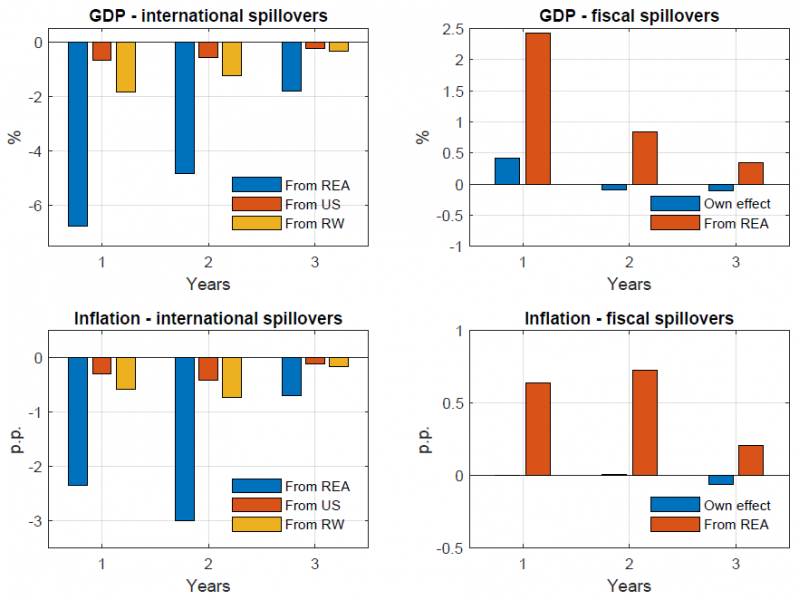
For the Netherlands (Figure 3) the paradox of a deeper contraction in output is observed when the REA is not hit by the global shock. This is triggered by the stronger real effective exchange rate under this counterfactual scenario.5 Given the strong dependence of the Dutch economy on international trade, the stronger appreciation harms its exporting sector, and thus output. Therefore, it seems that the REA, when hit by the global shock, acts as absorber which allows for a milder real effective exchange rate appreciation in the benchmark scenario. As a result, the exporting sector is hit less in the benchmark economy than in the counterfactual scenario, which leads to a milder contraction. As regards the contribution of other regions, the US seems to have a non-negligible spillover in the Dutch economy. The spillover from the US economy amounts to 0.9 p.p. of GDP (i.e., Dutch output would drop by 0.9 p.p. less if there was no shock in the US) and it is almost double the spillover from the RW. As regards inflation, the stronger appreciation of the real effective exchange rate when the global shock is absent in the REA leads to a deeper decline in inflation due to a non-negligible exchange rate pass-through to Dutch prices. Obviously, the amplified response of inflation is further fuelled by the sharper output decline in the export sector. Spillovers to inflation from the other two regions are small to negligible.
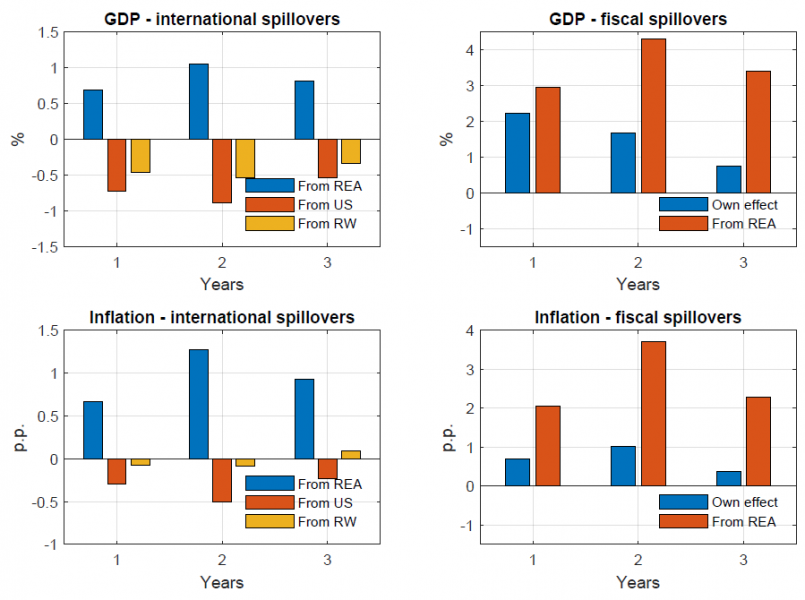
For Slovenia (Figure 4), the largest spillover comes from the REA, but the sign is the opposite of the expected one. This results from how fiscal policy is modelled, with foreign government purchases including imports from Slovenia.6 When the REA shock is switched off, government spending in this bloc is also switched off, and with it some of the positive effect it has on the Slovene economy. At the ELB, lack of demand lowers domestic inflation and increases the domestic real rate. This occurs because spillover from the REA fiscal stimulus overshadows the (negative) spillover from the REA economy excluding the fiscal part.7 The higher real rate significantly reduces domestic consumption, which magnifies the spillover.8 Spillovers from the US and the RW are smaller and carry the expected sign, as both trading partners account for roughly 30% of exports and the fiscal spillovers are small. Nevertheless, domestic fiscal stimulus matters. On impact, it reduces the output drop almost 3 p.p. On the other hand, fiscal stimulus from the REA provides even more support to the domestic economy in the first year.9
3.1 Fiscal measures and the monetary regime
Note that we analyse the first wave of the pandemic, where many fiscal measures were either not yet implemented or not taken up by firms and households (e.g., loan guarantees). To achieve comparability between countries, we cast the fiscal measures in terms of direct government spending and transfers (or subsidies) to firms and households. A common feature of all countries is an increase in direct government consumption (mostly health expenditure-related) and an increase in transfers to households and firms (including subsidies). Table 1 lists the fiscal measures considered in each economy. We assume the ELB is binding during the first three years of the simulation.
Table 1. Fiscal Measures (% of ex-ante annual GDP)
3.2 Fiscal spillovers
To investigate the role of fiscal policy spillovers, we compare the paths of output and inflation in the baseline scenario with their counterparts in a hypothetical scenario where either the domestic economy or the REA bloc does not implement any fiscal measure.
Right panels in Figures 1 – 4 present the effects of fiscal policy during the first three years. Two key findings emerge. First, domestic fiscal policy generally has moderate effects on both quantities and prices. For instance, fiscal support in Luxembourg boosts output by 0.5% in the first year, while it leaves inflation unchanged. Moderate effects mainly reflect import leakages in SOEs, due to high import content of consumption, investment and exports, and in some cases government spending.10 Second, the effects of spillovers depend on the fiscal policy measure. If such measures are supply-side oriented, they may worsen the performance of the domestic economy and of trading partners if they lead to lower prices and thus exacerbate the ELB. Given the size of the fiscal package worth 6.7% of ex-ante annual GDP in the REA, spillovers are large. Passive monetary policy tends to amplify these spillovers.
Domestic fiscal policy in Ireland (Figure 1) is calibrated on the initial response of the government to the first wave of the pandemic. Government consumption directly stimulates domestic output, as expected. A subsidy to wages supports households’ after-tax income and prevents firms severing employment relationships. Within the wage-bargaining framework, the wage subsidy becomes part of the match surplus that is negotiated between households and firms. Households are willing to accept lower wages, because the wage subsidy keeps their take-home income unchanged (or its decline is limited) despite the wage cut. Firms benefit from lower wage costs and preserve more employment relationships. Within the wage bargaining framework a wage subsidy to households effectively becomes a supply-side measure that lowers inflation. This is an important insight, because in the presence of the ELB this channel reduces the fiscal multiplier (and reduces spillovers) through the increase in the real interest rate. The wage subsidy mechanism outlined above also operates in other blocs of the model. In the REA, the fiscal package is tilted towards wage subsidies (as it is in Ireland), so it mainly favours domestic producers by lowering their marginal costs. Irish exporters would be more competitive if the REA did not subsidise wages, which would result in a lower fall in output in Ireland. However, subsidizing wages in the REA is a double-edged sword given the ELB, because it further reduces inflation and increases the real interest rate. This dampens consumption and investment in the REA and is the reason why fiscal policy spillovers from the REA to Ireland are negative. Again, this is only the case because the fiscal package is tilted towards wage subsidies. For other fiscal measures, such as government spending, the spillovers are positive.
In the Netherlands, fiscal policy in the first year leads to a milder output contraction (2 percentage points less than in the case of no domestic fiscal support). The effectiveness of domestic fiscal measures is quite persistent, mitigating the recession up to 0.7% three years later. As regards inflation, the effects are visible from the first year, when inflation slows by approximately 0.6% less than in the no fiscal support scenario. Owing to price stickiness, the effects of expansionary fiscal measures build up gradually and then dissipate.
Looking at the spillovers from fiscal measures in the REA, their impact is quite substantial in the Netherlands. Given the high degree of openness of the Dutch economy, and its strong dependence on external demand, expansionary fiscal measures in the REA alleviate the impact of the pandemic shock substantially. Spillovers from the REA are very persistent.
Due to the direct import-content of government spending in the Slovenian version of the model (Figure 4), it is difficult to separate the pure fiscal and the pure international effect, and we have discussed both together in the previous section.
Following the sharp contraction of European economies during the pandemic, in July 2020 the European Council agreed to launch the Next Generation EU (NGEU) instrument. NGEU is a coordinated fiscal response to the crisis aiming to be an exceptional temporary recovery measure. In practice, NGEU allows the European Commission to issue debt to finance grants and loans to EU Member States, with the disbursement of funds focusing on the countries most affected by the crisis.
Against this background, we consider an extended version of the EAGLE model that features a supranational fiscal authority in the euro Area. The European fiscal authority issues long-term bonds and collects lump-sum or VAT taxes from households in the home country and in the REA. More taxes are paid by households in the bigger region.
The supranational authority uses the funds raised by issuing long-term debt either to provide support to the non-tradable goods sector or to finance part of member states’ outstanding debt. The two scenarios are considered separately. In both cases, it is assumed that the supranational authority implements additional spending for three quarters. As in Bartocci et al. (2020), taxes used to finance debt issued by the supranational fiscal authority are not active in the first three quarters when funds are distributed to member states. In both scenarios, we assume that additional union-wide spending amounts to five percent of euro area GDP.
In all the scenarios considered in this section, we take the Netherlands as the home country. Under EU lump-sum taxes, the Netherlands benefits only marginally from EU transfers towards the non-tradable goods sector. In fact, output contracts only slightly less. Turning to lump-sum transfers to finance national government debt (bottom panels), effects are nearly zero. Obviously, this is largely driven by the fact that both national governments and the supranational authority use lump-sum taxes to stabilize debt. Under EU VAT taxes, both the transfers to the nontradable goods sector and transfers to finance national debt mitigate the contraction in Dutch output. The intuition is as follows. Households are aware that the supranational authority will not raise VAT taxes immediately, but only in the future. Therefore, households front-load the effects of higher future VAT and, as a result, decide to raise their consumption (or limit the decline in their consumption) before the rise in taxes is actually implemented. This puts upward pressure on prices in both regions, and downward pressure to the real interest rate, given the ELB in the first three years. As a result, the contraction of output is mitigated.
We investigate the role of international spillovers during the COVID-19 pandemic for small open economies that are members of the monetary union. We find that the 2020 decline in economic activity in Ireland, Luxembourg, the Netherlands and Slovenia in large part resulted from foreign factors, either related to trade or to fiscal policies. However, the specific design of fiscal measures, and the effective lower bound on monetary policy can significantly affect the results. In particular, the interaction of fiscal policy with the effective lower bound is important for the effects of national fiscal policies and for international spillovers. Similarly, the choice of fiscal instrument also matters for the Next Generation EU program.
Figure 1. Spillovers in Ireland
Horizontal axes: Years.
Vertical axes: Percent deviations from the initial value, except for inflation (p. p. dev.).
Figure 2. Spillovers in Luxembourg
Horizontal axes: Years.
Vertical axes: Percent deviations from the initial value, except for inflation (p. p. dev.).
Figure 3. Spillovers in The Netherlands
Horizontal axes: Years.
Vertical axes: Percent deviations from the initial value, except for inflation (p. p. dev.).
Figure 4. Spillovers in Slovenia
Horizontal axes: Years.
Vertical axes: Percent deviations from the initial value, except for inflation (p. p. dev.).
Figure 5. EU transfers
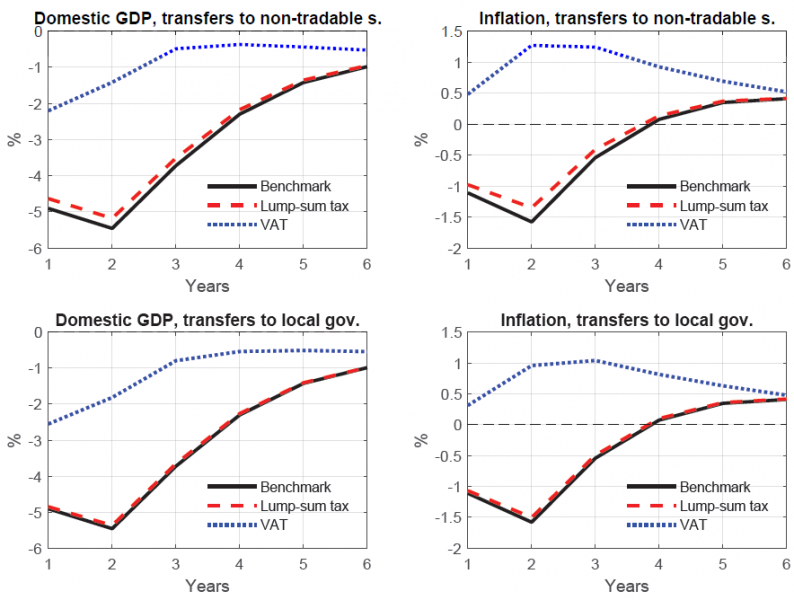
Horizontal axes: Years.
Vertical axes: Percent deviations from the initial value, except for inflation (percentage point deviations).
Bartocci, A., Notarpietro, A., Pisani, M., 2020. The COVID-19 shock and a fiscal-monetary policy mix in a monetary union. Bank of Italy Working Paper 1313.
Bolt, W., Mavromatis, K., van Wijnbergen, S., 2019. The Global Macroeconomics of a Trade War: The EAGLE model on the US-China trade conflict. CEPR Discussion Papers 13495. C.E.P.R. Discussion Papers.
Clancy, D., Jacquinot, P., Lozej, M., 2016. Government expenditure composition and fiscal policy spillovers in small open economies within a monetary union. Journal of Macroeconomics 48, 305–326.
Garcia, P., Jacquinot, P., Lenarcic, C., Lozej, M., Mavromatis, K., 2021. Global models for a global pandemic: the impact of COVID-19 on small euro area economies. ECB Working Paper No 2603.
Garcia Sanchez, P., Moura, A., 2019. The LU-EAGLE model with disaggregated public expenditure. Central Bank of Luxembourg Working Paper 135.
Gomes, S., Jacquinot, P., Pisani, M., 2012. The EAGLE. A model for policy analysis of macroeconomic interdependence in the euro area. Economic Modelling 29, 1686–1714.
Ilzetzki, E., Mendoza, E.G., Végh, C.A., 2013. How big (small?) are fiscal multipliers? Journal of Monetary Economics 60, 239–254.
Jacquinot, P., Lozej, M., Pisani, M., 2018. Labor tax reforms, cross-country coordination, and the monetary policy stance in the euro area: A structural model-based approach. International Journal of Central Banking 14, 65–140.
To replicate the first Covid-19 wave, we opt for a combination of supply and demand shocks that captures the following stylized facts: (1) a sharp drop in private consumption, especially that of services, and a reorientation towards domestic goods, (2) a fall in investment, and (3) a fall in prices that is lower than what would be expected in a recession of this magnitude, and more concentrated in the tradable sector. We focus on the first wave of the pandemic, so our shocks last for the first four quarters of the simulation. See Garcia et al. (2021) for details.
In reality, it is unlikely that EA shocks account for 92% of the fall of Luxembourg GDP. However, our exercise should be seen as a pedagogical device highlighting the importance of international spillovers. We do not aim to provide precise quantitative estimates.
This result is sensitive to the presence of the effective lower bound.
An example are pharmaceuticals and private consumption subsidized by the government, for instance, the cash-for-clunkers scheme in Germany, where car parts of cars bought with the subsidy are produced in Slovenia.
This can be seen in the top-right panel of the figure, where fiscal spillovers from the REA are high, and in the bottom-right panel, showing a fairly high contribution of the REA fiscal policy to domestic inflation in Slovenia.
We show that this effect is not present when there is no ELB.
This is consistent with empirical evidence, which finds smaller multipliers in SOEs (Ilzetzki et al., 2013).