This Policy Note is based on “Will Higher Rates Plunge Governments Into Despair?”, RaboResearch, 2023.
Debt ratios in the Eurozone reached unprecedented highs during the low-interest period, but as interest rates rise, some countries’ debt sustainability is being questioned. In this report, we forecast a few key debt metrics for the major Eurozone countries, and we find that Italy and Spain, in particular, appear vulnerable, even if inflation – and interest rates – fall faster than currently expected. Despite our concerns, we do not expect a new debt crisis because European institutions have a few tricks up their sleeves to intervene if needed. Nonetheless, governments across the bloc will have to improve their budgets balances to prevent debt ratios from spiralling upwards.
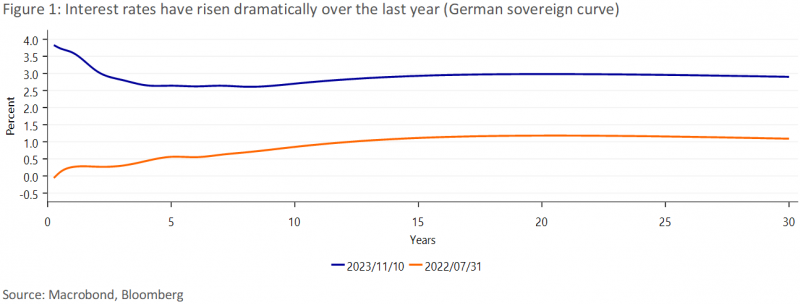
Last year we published a piece on the effect of higher interest rates on Italy’s debt sustainability. We argued that higher rates seem bearable in the short run, but that in the medium term, debt affordability could become a serious issue. Since we published the report, yields on Italian bonds have risen further, raising the question whether the situation has become even more pressing.
But high debt ratios and increasing interest rates are not just an Italian problem. Plenty of other eurozone countries face rising interest costs. Obviously, higher interest costs are unpleasant for every government, but for some more than for others. At the same time, higher nominal GDP growth could dampen the implications of higher rates for debt sustainability across the eurozone.
In this follow-up special we will try to answer two questions: i) Which eurozone countries are hardest hit by the increase in interest rates? And ii) How would countries fare under different interest rate and inflation regimes?1
Recently, the spotlight has been on Italy, as it is a major eurozone country with a massive debt pile. During the eurozone debt crisis, however, it was the smaller countries that sparked panic in financial markets. We assess each eurozone country on a number of indicators to see if similar trouble is brewing as a result of the recent interest rate shock. Given that our analysis does not suggest that the smallest member states warrant great attention, we only include the data for Germany, France, Italy, Spain, the Netherlands, Belgium, Portugal and Greece in this report.
Debt sustainability is dependent on quite a number of factors, but in order not to overcomplicate things, we select a few critical indicators to discuss: (i) the debt-to-GDP ratio, (ii) interest payments as a percentage of revenues, and (iii) gross financing needs as a percentage of GDP.
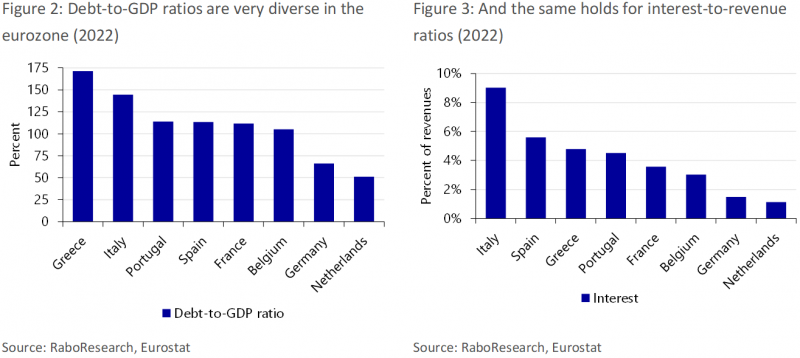
For the debt-to-GDP ratio, not only the level but also the direction of travel matters. This direction of travel depends on a few variables, namely the primary balance, the implicit interest rate, GDP growth, and stock-flow adjustments.2 A persistently increasing debt ratio is a strong indicator that servicing that debt will become harder and harder. Generally speaking, however, low-debt countries tend to be better able to cope with rising debt ratios than high-debt countries. From this perspective, Italy has much less fiscal space than the Netherlands, for example (see Figure 2).
It’s not just the ratio of debt to GDP that is important. The composition of the debt, specifically the maturity profile and at what yield the bonds were issued, is important as well. Some countries used the low interest rate environment of the past years to lock in low yields. Austria for example, locked in a favorable interest rate when it issued a 100-year zero coupon bond in 2020. Meanwhile, Greece, Spain, Portugal and Cyprus still benefit from European support dating back to the eurozone debt crisis. Especially in Greece this has led to relatively low interest payments compared to its outstanding debt. Not only because the support has depressed yields – EU loans bear lower rates than market financing for Greece – but also because it does not have to pay interest on the sizeable share of its EFSF loans (37% of total debt) until 2032.
In order to assess the affordability of debt, we should also take government revenues into account. The higher the revenues, the easier it is to service the debt and vice versa. The ratio of interest payments to government revenues is often used as a measure for such debt affordability.3 Not surprisingly, Italy currently spends the largest portion of its revenues on interest payments (see Figure 3), as it has a large debt and does not have EU support like Greece. Last year’s ratio came close to the median of speculative graded countries at credit rating agencies (see footnote 2).
A combination of the aforementioned factors and current fiscal policy yields a third commonly used indicator in debt sustainability analysis: gross financing needs as a percentage of GDP (GFN). The gross financing needs-to-GDP ratio assesses liquidity issues and rollover risk and is impacted by the primary budget balance, interest payments, maturing debt, and stock-flow adjustments. According to the European Commission, the indicator is particularly useful in assessing the risk of fiscal stress in the short term, but it is also useful in medium-term assessments. The IMF assesses medium-term liquidity risks using GFN within its sovereign risk and debt sustainability framework.
While servicing debt was relatively easy in a world of ultra-low interest rates and accommodative monetary policy, it may not be as simple today. As interest costs rise, governments may need to take action to prevent the debt-to-GDP ratio from rising. One way to do so is to raise the primary budget balance, i.e. the general government budget balance excluding interest payments, through austerity measures. But given that nominal GDP is an important component of the debt-to-GDP ratio, a higher primary budget balance should not come at the detriment of GDP growth.
Turning the latter observation around, it is also true that as long as the economy is growing at a sufficient pace, discretionary action need not be required to compensate for higher interest payments. First, because the primary balance generally tends to improve when the economy grows. Second, as long as the economy is growing in nominal terms, a growing debt pile does not have to lead to an increase in the debt-to-GDP ratio.
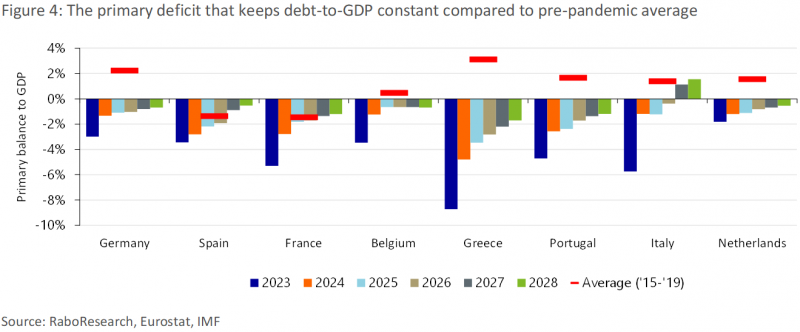
Our analysis shows that governments can permit to run a primary deficit in the coming years without sending the debt-to-GDP ratio upwards (see Figure 4), since every economy is expected to grow considerably in nominal terms. In fact, in the coming years, member states can afford a larger primary deficit than their pre-pandemic average (2015-2019). That said, it is evident that the maximum bearable deficit to keep the debt ratio constant will fall over the years. This is the result of more modest nominal GDP growth in the medium term, while at the same time, higher interest costs (based on the current forward interest rates) start to bite. Moreover, Figure 4 only shows the primary balance required to stabilize the debt ratio and not the ratio required to put debt on a downward trajectory, which will be especially important for high debt member states.
The degree to which these higher interest rates will start to bite, differs from country to country. Some have locked in low rates for long periods or simply don’t have much debt. To see how each member state fares, we have simulated the sustainability metrics mentioned, based on economic forecasts for GDP, inflation and the primary budget balance. We have furthermore assumed that governments will lock in future financing costs by entering forward rate agreements. This is a simplification, but it saves us from making explicit assumptions regarding the shape of the future spot curve.
Our projections show rather diverging trajectories for the debt ratio across the block (see Figure 5). Despite an increase in interest costs between 2023 and 2028, the debt ratio is actually expected to fall in Portugal (-13.4pp), Italy (-10.2pp), Greece (-17.6pp) and Germany (-5.3pp). It is expected to increase in Belgium (12.2pp), France (1.6pp), Spain (2.6pp), the Netherlands (2.6pp).
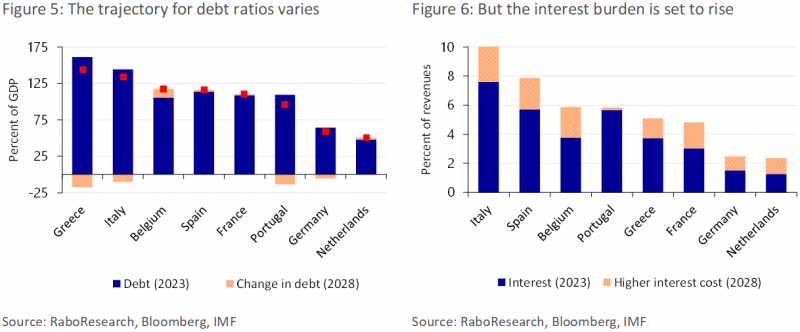
The main reason for the varying changes in debt-to-GDP ratios is not necessarily different vulnerability to the higher interest rate environment (except for Greece, which pays relatively little interest on its debt as a result of a favorable agreement with the ESM). Indeed, Figure 6 shows that the interest burden also increases in the countries in which the debt ratio is set to decline. Instead, different paths for nominal GDP growth and the primary balance are more important. While strong nominal GDP growth keeps a lid on the increase in the debt ratio in all member states, the extent differs. Meanwhile, projections for the primary balance diverge even more, with some countries expected to run a surplus and others a deficit. The strong rise in Belgium’s debt-to-GDP ratio, for example, is mainly driven by a high primary deficit, compared to a pre-pandemic surplus. Italy on the contrary, is expected to improve its primary balance significantly in the coming years according to the IMF, even beyond its pre-pandemic average. Consequently, the figures might overstate the increase in the debt-to-GDP ratio for Belgium, whilst understating it for Italy if such a trajectory doesn’t come to pass. Beyond our forecast horizon, the impact of higher yields is expected to increase, however, as more and more debt is rolled over at higher yields.
All in all, the fact that we project the debt-to-GDP ratio to fall in some countries, doesn’t necessarily mean that no fiscal effort is required on behalf of these member states. Especially not if they want to put the debt-to-GDP ratio on a firm downward trajectory. Especially in France, Italy, Spain and Belgium stabilizing or decreasing the ratio may require painful steps.
The interest burden is set to increase over the coming years (see Figure 6). Unsurprisingly, the increase is largest in high debt countries, with the notable exception of Portugal. This can be explained by the fact that Portugal has a sizeable amount of outstanding high coupon bonds from 2006 and 2010. Refinancing those at the current interest rates in some cases actually mean that interest costs will still fall.
The figures are particularly worrisome for Italy. Compared to the report published last year, the results are quite similar despite the higher interest rates, mainly because the outlook for nominal GDP growth – and thus revenues – improved. The projected interest-to-revenue ratio still exceeds the threshold for a speculative grade rating, however, while the ratio moves in that direction in Spain. While credit ratings are not based on solely one indicator, these figures require alertness.
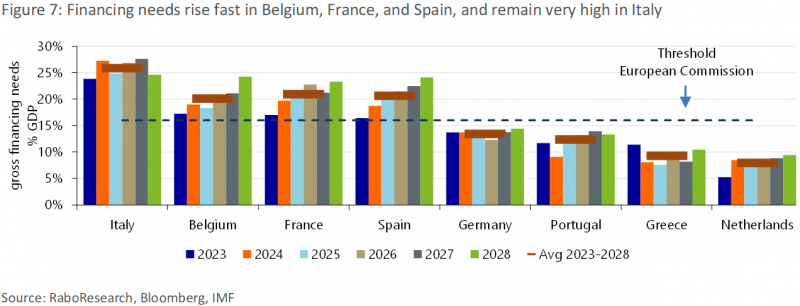
Figure 74 shows that gross financing needs are projected to increase in all countries but Germany over the coming five years. The increase is most pronounced in Belgium, France and Spain, while they will remain very high in Italy. On average, GFN are projected to surpass the European Commission’s high vulnerability threshold of 16% in Italy, Belgium, France and Spain.5
The relatively contained increase in financing needs in Italy and Greece in the coming years may appear counterintuitive given their massive debt burdens, but can be explained from their projected primary surpluses, as mentioned above. Meanwhile, as with the debt ratio projections, the increase in GFN for Belgium may be overstated given the forecast of a very large deficit.
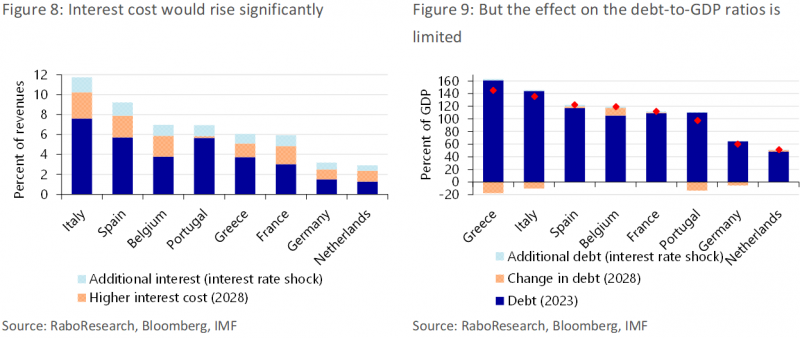
Inflation – and thus interest rates – have been surrounded by much uncertainty lately. So what if the latter rise further? To get a feeling for how sensitive our results are to interest rate shocks, we have applied a parallel shift of 100 basis points to the current yield curve of every country.
There are a couple of things that stand out in Figures 8 and 9. As expected, interest costs rise further, similar to the effect seen in Figure 6, with high-debt countries leading the pack. Another point worth noting, is that the effect of higher interest on the debt-to-GDP ratio is fairly limited. Over the forecast horizon, the debt-to-GDP ratio is more sensitive to the rate of nominal GDP growth than to changes in interest rates. It takes a while before higher interest rates seep through to the outstanding debt.
While these results provide some insights, a parallel shift to the yield curve, without any changes to the economic outlook, is not a realistic scenario, since higher interest rates seldom come in isolation. The current rise in interest rates for example, is driven by higher inflation, but interest rates could also rise because investors demand higher compensation for the perceived risk. In case of the latter, the impact on debt metrics could be larger, if they are, for example, the result of a deterioration of fiscal balances or the growth outlook. At the same time, as our baseline analysis shows, higher yields against the backdrop of higher inflation prove much less damaging for certain debt metrics – at least in the short to medium term. We should therefore work with scenarios, rather than just tweaking one variable.
If the last two years have taught us anything, it’s that forecasting inflation is particularly difficult. Since inflation began to rise in late 2021, economists and central bankers have consistently underestimated the rate and persistence of inflation. This is why we look at two alternative scenarios: one with a higher inflation and interest rate path, and one with lower paths.
Currently, markets don’t really price in structurally higher inflation rates in the long term. The 5y5y inflation swap (an indicator closely followed by the ECB) for example, is currently priced at 2.64%. This is slightly higher than before the European debt crisis. There are plenty of arguments why inflation could structurally overshoot the ECB’s target (see this report as an example). Geopolitical tensions have risen and there are risks of further escalation, threatening to derail global supply chains once more. In anticipation of these risks, some companies indicate that they intend to re-shore some of their production, which is likely to be inflationary.
Given these risks, it’s worth considering a scenario in which inflation – and interest rates – remain higher for longer. Although reality can differ, textbook economic models say that if long-term inflation expectations shift higher, long-term rates rise faster than short-term rates. In an environment of structurally higher inflation, investors could demand a higher risk premium and/or term premium, potentially resulting in a bear steepening of the yield curve.
We created a scenario in which we assume inflation will stabilize at 3 percent rather than the ECB’s target rate of 2 percent. We anticipate that interest rates will rise along the curve, but especially on the long end of the curve. Additionally, higher inflation will also increase nominal GDP growth. We have included the results of this scenario in Figures 10 and 11.
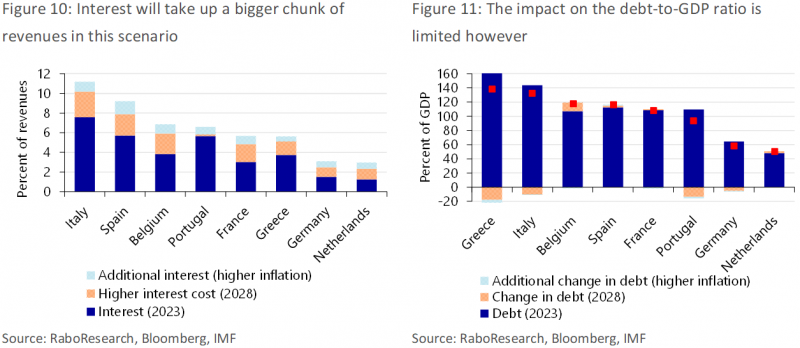
As expected, interest cost will eat up a bigger portion of revenues than in our base case scenario. If this scenario were to materialize, Italy would actually cross the 10% interest-to-revenue threshold (see footnote 2), while Spain would come dangerously close to it. Interest costs rise quite aggressively in Belgium as well, while the higher interest rates seem to have a much smaller effect on Portugal due to the already mentioned maturing of very high-yielding bonds. Turning to the other indicators, the outlook for both debt to GDP and financing needs to GDP does not materially change over the forecast horizon compared to our baseline scenario. If anything, the debt ratios come in somewhat lower than in our baseline. So, in the short to medium term, downward pressure from higher nominal GDP growth outweighs the upward pressure coming from higher yields. Beyond our forecast horizon, we expect the opposite.
These higher interest rates, and the associated risks to debt sustainability, are unlikely to go unnoticed. Investors may demand a higher return to compensate for the associated risk in certain countries. Furthermore, in times of turmoil, investors may seek safe havens such as German bonds, further increasing spreads. The change in peripheral spreads would require a country-by-country analysis however, which is beyond the scope of this report.
The risks are not only to the downside, however. A steep fall in energy prices last year showed that inflation can fall quicker than expected as well. Although this is not our base case, one could argue that the price for goods may even fall (or at least not rise as fast) since there is evidence that inventories are piling up, while consumer demand is falling at the same time. Producer price inflation has already collapsed, so why shouldn’t consumer price inflation do the same? In this case we expect short-term interest rates to fall faster than long-term rates.
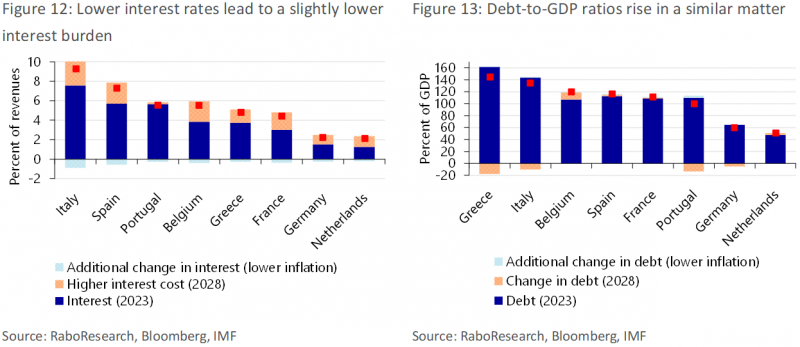
What stands out from Figure 12, is that despite the lower interest rates, the decline in the portion of revenues spent on interest cost is limited. Although this might seem counterintuitive, it does make sense. Together with the lower interest rates, inflation and nominal GDP growth drop as well. Consequently, government revenues also fall compared to the baseline.
Like in scenario I, the outlook for both debt to GDP and financing needs to GDP does not materially change over the forecast horizon compared to our baseline scenario. Yet contrary to the higher for longer scenario, the debt ratios in fact come in somewhat higher than in our baseline due to lower nominal GDP growth. Again, in the short to medium term, the impact of a different path for nominal GDP growth outweighs the impact of a different path for yields.
According to the analyses conducted in this report, another eurozone debt crisis is not on the horizon. However, some worsening debt sustainability metrics are a cause for concern as higher interest rates begin to bite. In short, the rest of the decade will see very high financing needs, particularly in Italy, Spain, France, and Belgium. To keep debt sustainable – let alone to get the debt ratio and financing needs at a firm downward trajectory – a firm commitment to improve the primary budget balance is required – without destroying GDP growth. Lifting nominal GDP could also be a way out, but that is even easier said than done, especially in the short to medium term. While no government is doomed to fail, there is little room for complacency or fiscal slippage as governments can still be vulnerable to shocks.
While interest payments will require a larger portion of all countries’ revenues, Italy and Spain are expected to face the greatest debt affordability challenges. In Italy, the interest-to-revenue ratio is expected to reach a level broadly matching that of countries with a speculative grade rating. On the bright side, there is still time to avoid such a situation.
At the moment, investors clearly distinguish between the health of different member states’ public finances, as evidenced by spreads in bond yields across the bloc. However, there is little evidence of genuine panic or excessive spreads. Still, the longer the current environment persists, the greater the risk that a shock will push a country into an upward debt and interest spiral. The ECB still has a few tricks up its sleeve (flexible reinvestment of maturing instruments under PEPP and the TPI), but intervening would put the ECB in an awkward position of tightening and loosening monetary policy at the same.
Another option for countries in great difficulty would be for governments to turn to the ESM – and possibly subsequently request the so far never-used ECB tool OMT. Yet that would come with conditionality, which may deter some governments.
This report uses the yields and projections for primary balances (IMF), growth and inflation (in-house) that were present at August 23. The full report including the technical appendix can be found here.
Stock-flow adjustments are flows that alter the debt-to-GDP ratio but not the budget balance. They include the acquisition of financial assets such as banking shares during/in the aftermath of the financial crisis. And also, for example, tax credits related to energy saving house renovations in Italy – known as the Superbonus 110. Due to accounting guidelines such tax credits appear in the budget balance at the time of issuance, while they only affect revenue and hence debt at the moment they are actually used to offset taxes (see Italy’s Stability Programme 2023, P.19). The year of issuance can differ from the year of usage.
As a reference, the median interest-to-revenue ratio for countries credit rating agency Fitch rates at BBB and the speculative BB is 7% and 9.2%, respectively. For the sake of simplicity, we use a ratio of 10% or higher that warrants at best a speculative degree rating, i.e. indicating the country is vulnerable to shocks and default risk.
The IMF no longer uses a single threshold. Instead it incorporates its GFN projections in a stress scenario, supplemented by data and judgement about possible risk dampening or amplifying factors. Such factors include the availability of cash buffers, the size of the domestic investor base, and absorption capacity of the domestic banking sector in case foreign investors flee in times of a shock.
We have not included the Italian tax credits mentioned in footnote 1 in the projections for Italy’s gross financing needs, since it is unknown when they will be used to offset taxes. Since tax credits handed out in 2021 and 2022 but not yet used amount to about 4.5 percent of GDP, we possibly underestimate financing needs by about that same amount on an accumulated basis.