This Policy Brief is based on Central Bank of Ireland Economic Letters Vol 2023, No. 3. The views expressed are solely those of the authors and do not necessarily reflect the views of the Central Bank of Ireland.
The pace of current monetary policy tightening has been unprecedented in the history of the Eurosystem. The key ECB interest rates started to increase in July 2022, the first rate rise in 11 years, and have increased sharply by 450 basis points since then. Within this policy brief, we examine two aspects of monetary policy transmission to euro area financial conditions, in particular to loan and deposit pricing by banks. First, does monetary policy pass-through differ across financial products? Second, is there evidence that pass-through is different in this tightening cycle? Our results indicate that pass-through is typically incomplete and varies across financial products. We find that pass-through in the current cycle is weaker relative to previous cycles for household deposits, is stronger for new business loan rates and appears to be the same for a number of other loan and deposit products.
Monetary policy is transmitted to the economy, and ultimately to inflation, through a number of channels. One such channel is how changes in monetary policy rates affect financial conditions, including interest rates faced by the public on financial products offered by commercial banks. The euro area has a particularly bank-based financial structure (Gambacorta et al., 2014). As such, bank interest rates are some of the most important in the euro area, influencing the saving, investment and consumption decisions of households and firms. The responses of these rates, together with adjustments to the quantity/quality of credit available from banks, comprise the “banking channel” of monetary policy (Lane, 2023).
Assessing the strength of this transmission channel is an important input to the overall assessment of the effectiveness of the monetary policy stance in achieving the inflation target over the medium-term. ECB Governing Council communication has highlighted the importance of the strength of transmission in its interest rate decisions1. In a recent study2, we assess the transmission of changes in euro area monetary policy rates to banks’ rates and compare transmission in the current tightening cycle to historical euro area norms.
As monetary policy pass-through can vary across financial products, we examine a range of loan and deposit rates. On the deposit side, we differentiate between overnight3 and term deposits for businesses and households. On the lending side, we differentiate between business4 lending and household mortgage lending, both new and outstanding. While interest rates on loans generally respond quickly to changes in monetary policy, interest rates on deposits, especially overnight deposits are typically slow to respond (Lane 2023; Messer and Niepmann, 2023). Pass-through can be affected by a country’s macroeconomic conditions, including government bond yields, the market structure of the banking system and the range of alternative product options. It can also be affected by banks’ characteristics, such as the quality and volume of their assets or their ability to access funding (Brissimis et al. 2014; Holton and Rodriguez d’Acri, 2015; Byrne and Kelly, 2019; Kho, 2023). Our results show that pass-through is typically incomplete, and that the magnitude of pass-through differs considerably across financial products in the current monetary policy tightening cycle.
We mark June 2022 as the start of the current monetary policy tightening cycle. Excluding data from after this point, we are able to examine the profile of bank-based transmission across financial products over the preceding two decades of the euro area’s existence. Our dataset comprises a monthly, balanced panel of bank product rates and macroeconomic and financial data for the 12 original euro area countries5. Following the panel Local Projections technique (Jordà, 2005), we examine the dynamic response of each bank product rate to a change in the euro area short-term rate6 over an 18-month horizon7.
Table 1: Euro area pass-through multipliers, by horizon, 1999-2022 (pre-June 2022 tightening cycle)
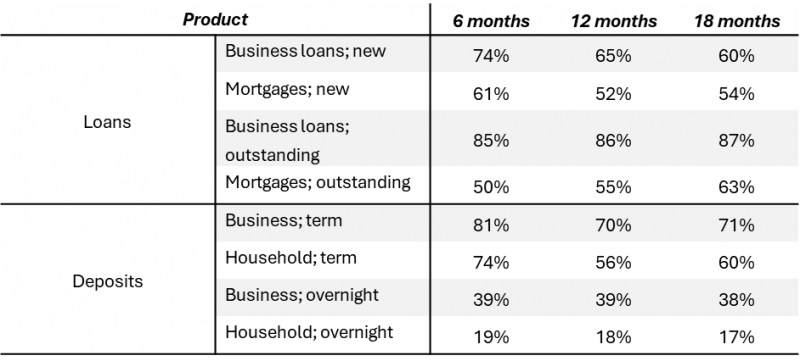
Note: Multipliers are by product on average for the period 1999-2022. The multipliers are the percentage of the total change in monetary policy rates over the same horizon. A value of 100% would be complete pass-through.
Table 1 provides a summary of pass-through for four loan and four deposit products, evaluated at intervals of six month over the horizon. Pass-through is expressed as a multiplier; the cumulative response of the product rate is scaled by the cumulative change in the short-term rate itself. This accounts for the fact that a number of monetary policy changes often occur in quick succession during a tightening or loosening cycle.
In Table 1, a value of 100 per cent would indicate complete pass-through, whereby the product rates move one-for-one with the short-term rate. This relationship does not hold for any of the product rates. The magnitude of pass-through also differs considerably by product. Pass-through is greatest for NFC loan rates and NFC term deposit rates, but is typically much lower for overnight deposit rates, especially for households. Our results are broadly in-line with recent work by Messer and Niepmann (2023) looking at euro area deposit pass-through. On the lending side, we find that pass-through to household loans is weaker than pass-through to NFC loans. Our estimates are also similar to those of Illes et al. (2019).
Extending the data to September 20238, allows us to examine whether pass-through is different in the current monetary policy tightening cycle. Using a dummy variable for the post-June 2022 period, we allow for flexibility in the pass-through relationship in this cycle. Due to the relatively short duration of the current monetary policy cycle, we limit our comparison to nine months ahead9. As such, we interpret these results as the evidence that can be gleaned so far. Further analysis will be possible in the months to come.
Figure 1 shows the dynamic responses (Impulse Response Functions) of NFC and household loans, new and outstanding, following a change in the short-term rate. In each panel, the blue series shows the average response over the full sample (1999 to September 2023), while the green series shows whether there is evidence for pass-through being different after June 2022. The green line should be interpreted as indicating that there is stronger pass-through where it is positive and statistically different from zero, slower pass-through when the converse holds, and the same pass-through where it is not statistically different from zero. For outstanding loans (household and NFC) and for new household mortgages, there is no statistical evidence that pass-through to lending rates is different in this cycle over a nine-month horizon. For new NFC loans, on the other hand, pass-through appears to be stronger after June 2022 than the typical relationship.
Figure 1: Pass-through to bank loan products
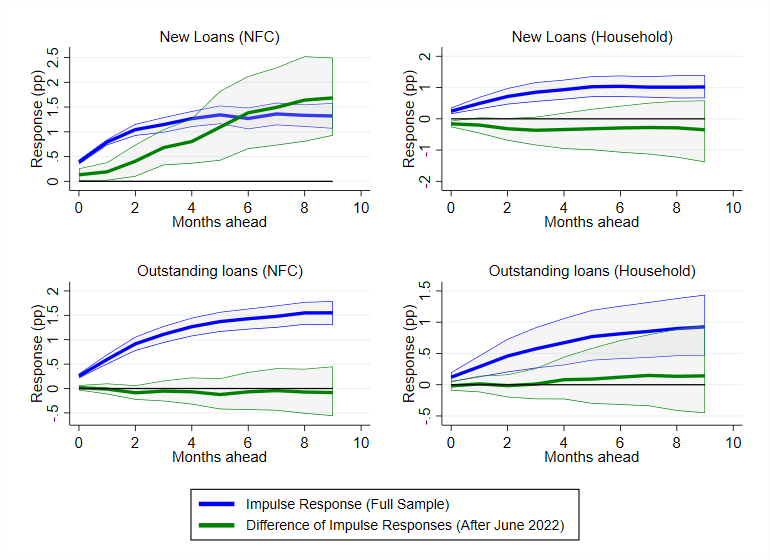
Notes: The blue line represents monetary policy pass-through during the period January 1999-June 2022. The green line shows whether pass-through is different in the period July 2022-September 2023. Confidence bands are 95%.
Figure 2: Pass-through to deposit products
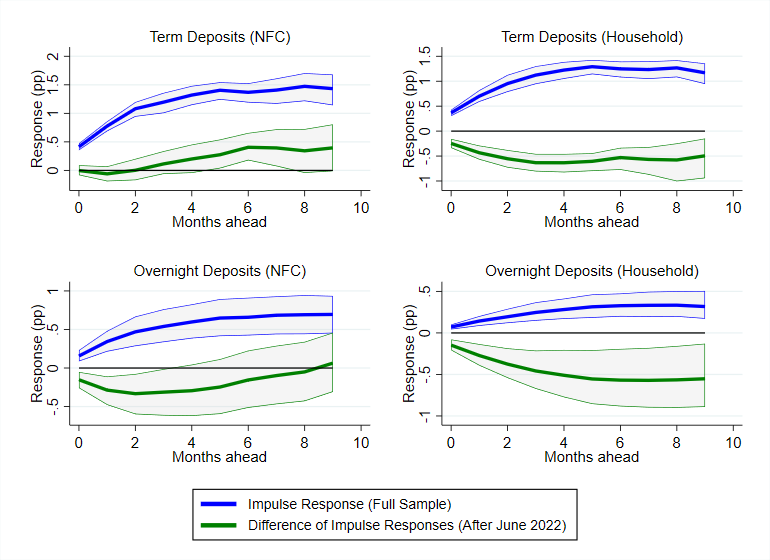
Notes: The blue line represents monetary policy pass-through during the period January 1999-June 2022. The green line shows whether pass-through is different in the period July 2022-September 2023. Confidence bands are 95%.
In Figure 2, we repeat this exercise for deposit products. For NFC term deposit rates, there is marginal evidence that pass-through is stronger in this cycle. For NFC overnight deposit rates, pass-through appears to be in-line with the historical norm. For household deposits, whether looking at term or overnight deposits, pass-through appears to be weaker.
Figures 1 and 2 are not presented in multiplier form. This means that the stronger pass-through observed to new business loans in this cycle could simply reflect the larger scale of monetary tightening in this cycle rather than a greater pass-through per unit of monetary tightening. However, for products where pass-through is smaller in this cycle, namely household term and overnight deposits, we can infer that pass-through per unit of monetary tightening is lower.
The euro area monetary policy stance has tightened appreciably since the summer of 2022. Pass-through of these monetary policy changes to the pricing of bank loan and deposit products is a “basic step” in monetary policy transmission (Lane, 2023). Our work addresses two main questions, namely what is the typical degree of pass-through by banks in the euro area, and is the pass-through different so far in this tightening cycle.
Looking at eight different loan and deposit products, we find that over the history of the euro area, pass-through by banks is not 100 per cent for any product and differs by the type of product. Pass-through is typically strongest to business loans and business term deposits. Pass-through is weaker to mortgage rates and weaker still to overnight deposit rates, especially for households.
Turning to this monetary policy tightening cycle, we find that pass-through is stronger, so far, to new business lending rates. Pass-through appears to the same as the historical norm for NFC deposits and household loans. Pass-through is weaker, meanwhile, to household overnight and term deposits. A number of factors could explain the weaker household deposit pass-through, including excess liquidity, competition and bank health. As more data becomes available in coming months, it will be possible to give a more complete assessment of pass-through.
Brissimis, Sophocles, Manthos Delis and Maria Iosifidi (2014). “Bank market power and monetary policy transmission.” International Journal of Central Banking, 10 (4): 173-214.
Byrne, David and Robert Kelly (2019). “Bank asset quality and monetary policy pass-through.” Applied Economics, 51 (23): 2501-2521.
Byrne, David and Sorcha Foster (2023). “Transmission of monetary policy: Bank interest rates pass-through in Ireland and the euro area”, Central Bank of Ireland Economic Letters Vol. 2023, No. 3.
Gambacorta, Leonardo, Jing Yang and Kostas Tsatsaronis (2014). “Financial structure and growth”, BIS Quarterly Review, March: 21-35
Holton, Sarah and Costanza Rodriguez-d’Acri (2018). “Interest rate pass-through since the euro area crisis.” Journal of Banking & Finance, Vol 96: 277-291.
Illes, Anamaria, Marco J. Lombardi and Paul Mizen (2019). “The divergence of bank lending rates from policy rates after the financial crisis: the role of bank funding costs.” Journal of International Money and Finance. Vol 93: 117-141.
Jordà, Òscar (2005). “Estimation and Inference of Impulse Responses by Local Projections.” American Economic Review, 95 (1): 161-182.
Kho, Stephen (2023). “Deposit market concentration and monetary transmission: evidence from the euro area.” DNB Working Paper Series No. 790
Lane, Philip (2023). “The Banking Channel of Monetary Policy Tightening in the euro area.” NBER Summer Institute 2023 Macro, Money and Financial Frictions Workshop. July 2023.
Messer, Todd and Friederike Niepmann (2023). “What determines pass-through of policy rates to deposit rates in the euro area?” FEDS Notes, Board of Governors of the Federal Reserve System. July 2023.
See the October 2023 ECB Monetary Policy Statement, for example.
See Byrne and Foster (2023), the companion paper to this policy brief, for more details.
Overnight deposits are those with instant access, while term deposits are those with agreed maturity.
“Business” refers to “Non-financial Corporates”, hereafter “NFCs”.
The bank interest rate data are weighted by volume and are sourced from the ECB’s Monetary Financial Institution interest rate statistics database. The macroeconomic and financial data include the unemployment rate, the core inflation rate and the long-term government bond yield for each country. For more detail, see Byrne and Foster (2023).
We use the Euro Overnight Index Average (EONIA) until 2019. Thereafter, we use the Euro Short Term Rate (€STR) with a margin of 8.5 basis points.
We control for country-level average differences over the sample period and for the effective lower bound period (July 2014 to June 2022). Byrne and Foster (2023) provide a full description of the estimation methodology including optimal lag selection, inference (following the cluster-robust bootstrap method of Roodman et al., 2019) and treatment of co-integrating relationships, if applicable.
The latest month for which data was available at the time of writing.
Beyond this horizon, there are too few distinct months for estimation purposes for which there is another 10 or more months ahead.