This policy brief is based on BIS Working Paper No 1264 “Inflation cycles: evidence from international data”. The authors are thankful to Claudio Borio, Julián Caballero, Ben Cohen and Georg Junge for useful comments and suggestions. The views here expressed are those of the authors and do not necessarily reflect those of the Bank for International Settlements or the Norges Bank.
Abstract
Identifying and documenting key patterns and characteristics of inflation cycles is crucial for market participants, households, firms, and central banks alike. In this column, we investigate different definitions of inflation cycles and establish stylised facts for a broad panel of advanced and emerging market economies. Finally, we present a heuristic—a rule of thumb—that classifies inflation into high- and low-inflation regimes. We show how our classification of high- and low-inflation regimes allows us to establish a critical link between inflation and business cycles: entering a high-inflation regime significantly raises the likelihood of a recession in the quarters that follow. To support further research, we provide a publicly available cross-country dataset on inflation cycles on the BIS website and through the BIS open-source python library ‘gingado’.
Inflation not only shapes economic decision-making directly but also influences a wide range of other economic variables. A key challenge lies in distinguishing periods of low inflation from those of sustained higher inflation, as the latter can become self-reinforcing and present unique policy challenges (BIS 2022, 2024).
To identify the properties of inflation dynamics, we use a century of inflation data to introduce three complementary concepts of inflation cycles. The first highlights medium- to long-term inflation trends, aligning with how inflation targets and expectations are typically framed. While we do not attempt to at model underlying inflation trends explicitly, long-term movements have been found to capture the bulk of inflation volatility (see Ascari and Sbordone, 2014). The second concept, measuring deviations of inflation from its low-frequency trend, connects naturally to theoretical models of inflation, such as those based on the Phillips Curve or DSGE frameworks (Hamilton, 2018). Finally, the third concept categorises inflation into a “high regime” and a “low regime”, based on a simple heuristic with empirical support for a broad range of countries.
By providing a multi-dimensional view of inflation cycles in a cross-country context across both advanced economies (AEs) and emerging market economies (EMEs), this work offers a valuable policy foundation for understanding inflation.1
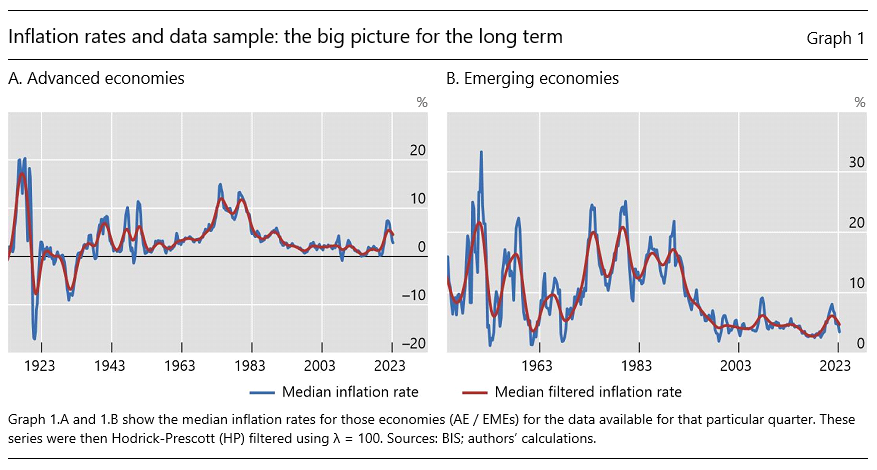
We examine a sample of 14 advanced and 13 emerging market economies for which we have near-complete coverage of long-dated inflation series from 1970 onward for the advanced economies (Graph 1), with some of the series starting in the 1910s. We observe that:
While some characteristics of inflation cycles have remained stable over the past 7–10 decades, some changes have occurred over time, plausibly due to the adoption of inflation-targeting. Since 1985, median amplitudes of inflation cycles have significantly dropped. Advanced economies saw a reduction in the median amplitude from 4.1 to 2.1 percentage points. Emerging market economies experienced a drop in the median amplitude from 6.5 to 4.5 percentage points.
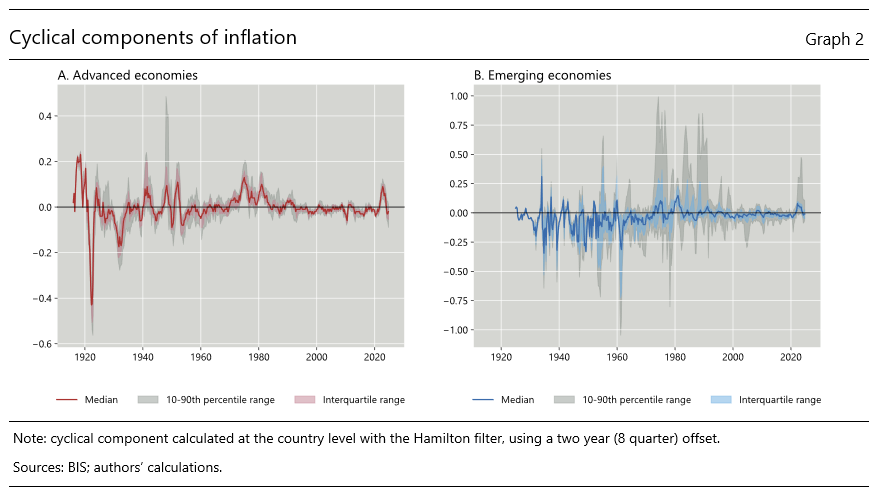
While longer-term trends reflect underlying structural changes in the economy, short-term fluctuations may be influenced by temporary factors such as supply shocks. For example, Phillips curve models associate measures of slack to deviations of inflation from its full-sample mean or, in more sophisticated models, from slower-moving trends.2 These relationships help explain inflation dynamics driven by conjunctural factors rather than structural ones. For instance, the 2022 inflation surge was tied to high post-Covid demand and tight supply chains. Such deviations are hard to forecast and pose policy challenges, particularly in distinguishing between transitory deviations and permanent trend shifts. Detrended inflation cycles can also serve as benchmarks for macroeconomic models, such as DSGE models, that focus on deviations from steady state. We measure the higher-frequency deviation of inflation from its low-frequency trend as long-run autoregressive forecast errors (Hamilton (2018)).
Our findings reveal that these deviations from long-term trends are quite limited most of the time but may go up markedly in periods known to be cyclically high inflation regimes (Graph 2). The periods of high cyclical inflation coincide with those in Graph 1, ie after the two World Wars, during the 1970s/80s/(90s) and most recently after the Covid-19 pandemic episode. AEs also experienced cyclically low inflation around the GFC. Interestingly, the dispersion in inflation cycles is visibly larger for the EMEs in our sample (right panel) compared to the AEs (left panel).
There is ample evidence that economies behave differently during periods of high inflation, which has given rise to the notion of low- and high-inflation regimes. As argued by Borio et al (2023), during low-inflation regimes, inflation fluctuates within a narrow range and displays strong mean-reverting properties. But in high inflation regimes, inflation becomes unmoored; ceases to revert to mean and is more volatile.
Building on these insights, we propose an intuitive and simple heuristic that can be applied across countries to capture this binary characterisation of inflation. The algorithm is defined by an entrance parameter (X), an exit parameter (Y) and a phase length parameter (Z). From a low inflation regime, a high inflation regime starts when an economy’s year-on-year inflation rate is more than X ppt above its five-year average, and is at least X. Hence, the parameter X defines the threshold for the entrance to a high inflation regime. Once in a high inflation regime, we date the return to a low inflation regime when year-on-year inflation declines to within Y ppt of the five-year moving average in the quarter in which the economy entered the high inflation regime. Hence, the parameter Y defines the threshold for the exit from a high inflation regime. To avoid spurious switches between regimes following temporary inflation spikes or troughs, we impose a minimum phase length for both regimes of Z quarters.
In Graph 3 below, we illustrate this algorithm with three economies: the United States, Germany and Thailand, using our preferred configuration with an entrance parameter (X) of 2 ppt, an exit parameter (Y) of 1 ppt, and a phase length parameter (Z) of 5 quarters. This rule-of-thumb matches well the quantitative definition of cyclically high inflation as per the Hamilton filter for a diverse panel of countries. A key takeaway from our classification of high and low inflation regimes is its versatility: while highly effective for cross-country analyses, its parameters can be tailored for application in single-country contexts.
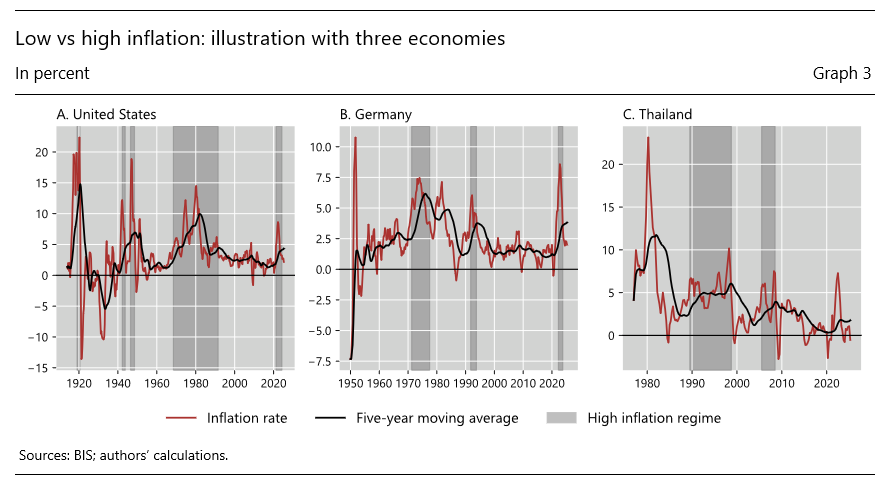
With the forementioned selected parameters, the US data, spanning back to 1920, reveals high inflation regimes during the two world wars, the Korean War, a prolonged period from 1970 to 1991, and a recent post-Covid episode from 2021 to 2023. Germany’s high inflation episodes were shorter, occurring in the 1970s (1972–1978), briefly during unification, and post-Covid. For Thailand, the algorithm identifies a significant high inflation period from 1990 to the Asian Financial Crisis in 1998, a shorter spell from 2007 to 2009, and consistent low inflation since, with the 2021 inflation spike too brief to qualify as a regime.
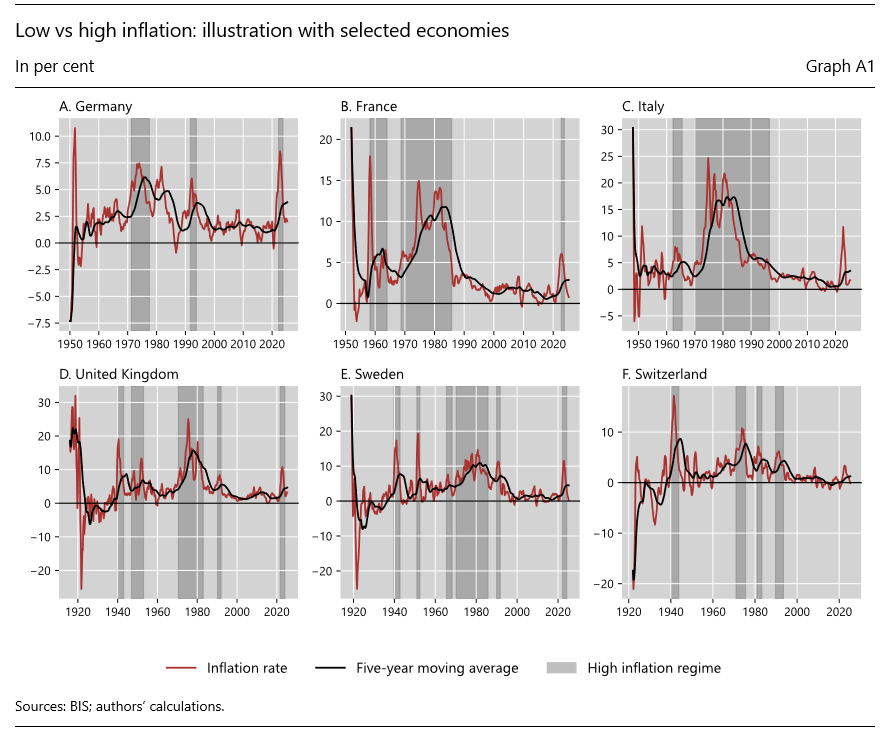
A selection of European countries with varying inflation dynamics (Graph A1 in the Annex) shows that, following the high inflation period of the 1970s—which affected all economies—countries have since experienced differences in episodes of high inflation. In the early 1990s, the United Kingdom and Sweden saw renewed inflationary pressures, often linked to each country’s credit market liberalization policies. More recently, while most countries experienced a surge in inflation following the Covid-19 pandemic, Italy and Switzerland stand out as exceptions, having avoided significant post-Covid inflation.
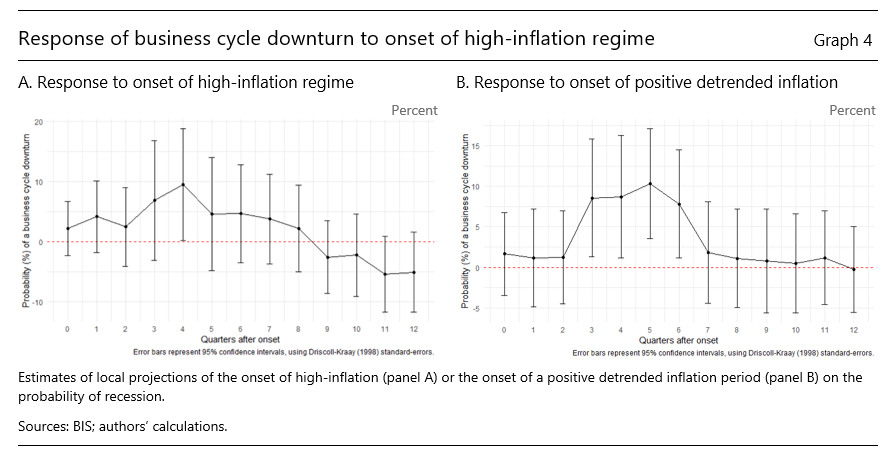
Given the dichotomy between the well-behaved cyclical inflation and the periods of high (cyclical) inflation, we test whether there are any broader implications when countries switch from one to the other. Using local projections (Jordà (2005), we estimate the dynamic effect on recession probability caused by a country entering a period of high inflation. On average, entering a high inflation regime increases the probability of recession by approximately 10 percentage points in the following year (Graph 4).3 The onset of the cyclically high inflation according to our detrended measure leads to similar effects. This result further underscores the importance of spotlighting more the cyclical component of inflation.
With this study, we seek to contribute to the general understanding of inflation cycles, ie what to expect for their duration and amplitude, as well as their relationship vis-à-vis economic growth cycles, based on long-term patterns. Our findings suggest that there are some defining characteristics which have remained stable over time – inflation cycle length, pairwise cross-country correlations and relationship with growth cycles – other dimensions, most notably the amplitude of inflation cycles, have changed over time. We offer a simple rule-of-thumb to identify periods of high inflation, which tracks well a more formal definition for a broad range of countries.
These three inflation cycles concepts offer different policy-relevant insights. The cycles in inflation levels correspond to the medium- to long-term frequencies over which inflation targets and expectations are often measured. And while this cycle measure does not explicitly model the underlying trend, it tends to reflect it as the bulk of inflation volatility is due to long-term movements. The second measure intuitively maps to theoretical models of inflation ranging from the Phillips Curve to DSGE models. And the third measure serves as a broadly applicable summary statistic about the inflation regime, which tends to be self-reinforcing in the case of high inflation. The data is made publicly available.
Along with the stylised facts on inflation cycles established in this paper, our work can serve other research endeavours to clarify inflation cycle patterns and their implications for broader macro-financial conditions. For instance, we show evidence that the onset of cyclically high inflation periods significantly increases the chance of worse business cycle outcomes starting one year ahead. This is important because the combination of high inflation and recession would further complicate the policy trade-offs to attain monetary stability.
Ascari, G and A M Sbordone (2014): “The macroeconomics of trend inflation”, Journal of Economic Literature, v.52, n.3, p.679-739.
Bank for International Settlements (2022): “Inflation: a look under the hood”, Annual Economic Report, Chapter 2.
——— (2024): “Monetary policy in the 21st century: lessons learned and challenges ahead”, Annual Economic Report, 30 June 2024.
Borio, C, Lombardi, M, Yetman, J and E Zakrajšek, 2023, The two-regime view of inflation, BIS Paper no 133.
Borio, C and M Chavaz (2025): “Moving targets? Inflation targeting frameworks, 1990-2025”, BIS Quarterly Review, March 2025, pp 31 – 52.
Hamilton, J D (2018): “Why you should never use the Hodrick-Prescott filter”, Review of Economics and Statistics, v.100, n.5, p.831-843.
Jordà, Ò (2005): “Estimation and inference of impulse responses by local projections”, American Economic Review, v.95, n.1, p.161-182.
Wolla, S A (2023): “All About the Business Cycle: Where Do Recessions Come From?”, Federal Reserve Bank of St Louis.
Our cycles time series are publicly available at https://www.bis.org/publ/work1264.htm.
The former is the traditional Phillips Curve formula with a constant intercept, linking demeaned inflation to measures of slack. The latter type of models can be estimated with moving averages or time-varying intercepts, thus associating slack to the gap between inflation and its trend.
A voluminous literature studies the Phillips Curve, including how inflation responds to recessions; see Ball and Mazumder (2011) and Del Negro et al (2015) as examples re-examining inflation in the wake of the GFC. In our case, we are interested in switching roles between these variables, examining the role of entering a high-inflation state has on recession. While we don’t explore the mechanisms, since our goal is only to point to the economic relevance of the cyclical decomposition of inflation, potential mechanisms could be, for example, due to monetary tightening, reduced purchasing power or increased uncertainty in business planning.